
 ?Mathematical formulae have been encoded as MathML and are displayed in this HTML version using MathJax in order to improve their display. Uncheck the box to turn MathJax off. This feature requires Javascript. Click on a formula to zoom.
ABSTRACT
Using a roadside survey among 1026 drivers and recording actual mean speed of vehicles, we develop a hybrid speed choice model to investigate the simultaneous effects of latent psychological and manifest variables in speed choice analysis. The latent variable part measures psychological factors derived from the theory of planned behavior (TPB). The results show that most factors of the TPB including attitudes, perceived behavioral control and intentions significantly predicted speed choice behavior. Females and older drivers (>60 years) have stronger attitudes and intentions to comply with the speed limit, which in turn, are positively related to slow driving behavior (<100 km/h) in freeways. Policy-scenario analyses show that an enhancement (one-point increase in the Likert scale) in attitudes and intentions to comply with the speed limit range would decrease the share of fast driving (>120 km/h) by around 5.5% (from 15% to 9.5%) and 3.5% (from 15% to 11.5%), respectively.
Introduction
Drivers’ speed choice with regard to speed limits is one of the main factors which can influence the probability and potential severity of consequences of a crash (Af Wåhlberg Citation2006; Ayuso, Guillén, and Alcañiz Citation2010; Anastasopoulos and Mannering Citation2016). It has been reported that a 10% reduction in speed can decrease the number of traffic crash fatalities by around 38% (Elvik et al., 2004). In the human-environment-vehicle system, several studies have shown that human factors have the most significant contribution (around 93%) to an accident (RSM Citation2003). Therefore, a better analysis of drivers’ speed choice behavior in high-speed roads, such as freeways, can augment policymakers’ insights into how socicialcognitive factors can faciliate behavioral changes. In the current study, based on the mean recorded speed of drivers in a freeway, we investigate the role of human factors on slow driving (<100 km/h), driving within the range of speed limits between 100 km/h and 120 km/h, and fast/speed limit exceeding driving (>120 km/h).
From a theoretical perspective, beliefs and attitudes concerning complying with a specific behavior could play an important role in the formation of that behavior (Ajzen Citation1991). Thus, drivers’ beliefs and attitudes with respect to complying with speed limits can associate with speed choice behavior. Many studies also supported that speeding is a planned behavior which can be explained by the theory of planned behavior (Warner, Özkan, and Lajunen Citation2009; Jacques, Velloso, and Torres Citation2018; Etika, Merat, and Carsten Citation2020; Bordarie Citation2019; Peterson and Gaugler Citation2021). Meanwhile, drivers with different demographic and socioeconomic characteristics may have different beliefs and attitudes toward complying with the speed limit and driving speed choice. Therefore, it seems that drivers’ beliefs and attitudes concerning complying with the speed limit can have a mediating role in the relationship between drivers’ background variables (i.e. demographic and socioeconomic factors) and speed choice behavior.
Although several variables can influence driving speed choice, from a behavioral point of view (human factors), a review of the literature shows that correlates of speed choice behavior can be segmented into two distinguishable types: manifest and latent psychological attributes. Manifest attributes include personal characteristics of a driver such as age, gender, and educational background (Stephens et al. Citation2017; Shinar, Schechtman, and Compton Citation2001; Stradling, Meadows, and Beatty Citation2001; Quimby et al. Citation1999; Kashani, Anvari, and Mohammadian Citation2016), while latent factors contain psychological aspects of drivers such as attitudes toward speeding (Etika, Merat, and Carsten Citation2020; Warner, Özkan, and Lajunen Citation2009; Bordarie Citation2019; Stephens et al. Citation2017).
As for the manifest variables, a closer look at the literature shows that male drivers are more likely to exceed the speed limit compared to females (e.g. Shinar, Schechtman, and Compton Citation2001; Watson et al. Citation2015; Hong et al. Citation2020). In a study conducted in a large representative sample of the US adult driving population, Shinar, Schechtman, and Compton (Citation2001) reported that speed limit compliance was found to be lower among male than female drivers (see also Yadav & Velaga Citation2021). Using a total of 84,456 speeding offenses in Queensland, Australia, Watson et al. (Citation2015) showed that male drivers exceeded the speed limit significantly more than females. Employing a sample of English motorists, Stradling, Meadows, and Beatty (Citation2001) also showed that males were more likely to drive above the speed limit than females. Regarding the role of age on speed compliance, previous research unanimously reported that younger drivers are more likely to exceed the speed limit than older drivers (Yadav and Velaga Citation2021; Fildes, Rumbold, and Leening Citation1991; Shinar, Schechtman, and Compton Citation2001; Stradling, Meadows, and Beatty Citation2001). Some studies also reported that well-educated (e.g. university degree) drivers are more likely to comply with the speed limit than drivers with less education (Shinar, Schechtman, and Compton Citation2001; Yadav and Velaga Citation2021). Furthermore, Yadav and Velaga (Citation2021) reported that more experienced drivers were more likely to exceed the speed limit.
Regarding psychological factors, many studies highlighted the role of beliefs and motivations behind speeding behavior (e.g. De Pelsmacker and Janssens Citation2007; Haglund and Åberg Citation2000; Jacques, Velloso, and Torres Citation2018; Iversen and Rundmo Citation2004; Ulleberg and Rundmo Citation2002). Using a sample of 334 Belgian individuals, De Pelsmacker and Janssens (Citation2007) investigated the competitive roles of norms, attitudes and habits on speeding behavior. They found that attitudes toward speeding and habit formation have the most important role in speed compliance. Employing an interview and questionnaire study among 533 drivers, Haglund and Åberg (Citation2000) examined the role of attitudes toward speeding and norms on speed compliance. They found that social norms (i.e., influence from family members) had no impact on speed decisions. Using a sample of 914 licensed drivers in Brazil, Jacques, Velloso, and Torres (Citation2018) investigated intention to comply with speed limits through the theory of planned behavior (TPB). Except for subjective norm (the role of friends and family members), other TPB constructs (i.e. attitudes and perceived behavioral control) were significant predictors of intention to comply with speed limits. Using a sample of 219 Swedish and 252 Turkish drivers, Warner, Özkan, and Lajunen (Citation2009) compared psychological predictors of speed choice behavior between Swedish and Turkish drivers. They found that Swedish drivers reported a more positive attitude toward speed limit compliance, a higher subjective norm, a higher perceived behavioral control, and a more positive intention to comply with the speed limit than Turkish drivers. Employing a sample of Nigerian drivers and the TPB, Etika, Merat, and Carsten (Citation2020) compared attitudes on speed limit compliance between work and private drivers. Their results showed that drivers had a more positive intention of speed compliance in their work than in private settings. Bordarie (Citation2019) reported that an extended version of the TPB including beliefs and self-report habit index explained 53% of the variance of behavioral intention in a sample of 391 French drivers.
Although the direct effects of both types of abovementioned variables have been separately investigated on speed choice behavior, there is no knowledge about how and to what extent these variables simultaneously associate with speed choice behavior. Akin to the literature, female drivers are more likely to comply with speed limit rules than males (Shinar, Schechtman, and Compton Citation2001; Stradling, Meadows, and Beatty Citation2001). Another study, for instance, shows that drivers who have more favorable attitudes (as a latent variable) toward speeding (i.e. those who enjoy speeding more) are more likely to violate speed limits (Stephens et al. Citation2017; Warner, Özkan, and Lajunen Citation2009; Ahie, Charlton, and Starkey Citation2015). Despite these findings, the simultaneous relationships of manifest and latent variables on speed choice behavior are mainly unknown. For example, it may be hypothesized that male drivers have more favorable attitudes toward speeding, which in turn can positively relate to speed limit violations. In these interrelationships between gender, attitudes and speed choice behavior, attitudes r can play a mediating role. Previous studies have overlooked such indirect effects on speed choice analysis. Developing such a mediating framework can give new insights into our understanding of speed choice behavior of different segments of drivers with certain psychological characteristics.
A closer look at the literature shows that no study has investigated the simultaneous associations of the manifest (i.e. background variables) and latent variables (i.e. beliefs and attitudes) in an integrated choice and latent variable model when it comes to behavioral analysis of speed choice. We contribute to the state of the art by developing a hybrid choice model with respect to complying with the speed limit and driving speed choice behavior. Furthermore, we use actual speed choice data as the dependent variable instead of self-reported speed choice which can noticeably decrease Common Method Variance (CMV) bias. When both explanatory and dependent variables are collected by self-reported data, the significant associations between them may be attributed to the method rather than the actual interrelations (Af Wåhlberg, Dorn, and Kline Citation2011; Podsakoff et al. Citation2003). Most previous research has overlooked this bias and tended to obtain the independent and dependent variables solely by self-reports.
Conceptual modeling framework
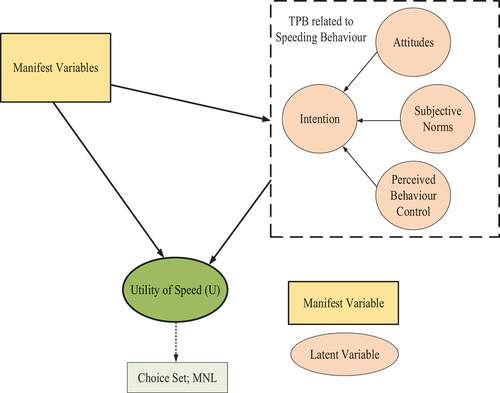
As illustrated in , the conceptual modeling framework of the current study includes two main parts: a latent variable part and a discrete choice model part. In the latent variable part, the theory of planned behavior (TPB) is utilized. The TPB has four major psychological constructs which theoretically links one’s beliefs and behavior (Ajzen Citation1991). In this theory, attitudes toward behavior, subjective norm and perceived behavioral control, in combination, can lead to the formation of a behavioral intention, which basically reflects motivational strength and overlaps with the self-efficacy concept (see Bandura Citation1991 for details). Behavioral intention is in turn assumed to be associated with the outcome behavior (actual speed choice). Previous studies have also shown the importance of the TPB factors on self-reported speed choice behavior (e.g. Etika, Merat, and Carsten Citation2020; Warner, Özkan, and Lajunen Citation2009). In our modeling framework, psychological constructs are treated as latent (i.e. unobserved) variables, which can help explain the heterogeneity in preferences. On the other hand, manifest variables related to personal profiles of drivers, such as age and gender, are hypothesized to be simultaneous predictors of the TPB factors and speed choice behavior.
Figure 1. A hybrid speed choice and latent variables framework.
Method and materials
A roadside survey was conducted through August 2019. A random sampling procedure was employed at a road toll of a main freeway in Iran. The randomization element of sampling was based on every 50 vehicles passing through gate A of the road toll. 1500 light vehicles were asked to participate in the study at the road toll. A total of 1032 drivers agreed to take part in the survey (response rate = 68.8%). As different speed limits were posted for heavy vehicles we exclusively focused on light vehicles in the study. The posted speed limit for light vehicles in this freeway is either 100 km/h in tunnels/ curves or 120 km/h in other (straight) sections. Due to this fact, we chose these specific speed limit thresholds for the study. The selected freeway was equipped with multiple and invisible speed cameras which measured the mean speed of each vehicle in addition to recording vehicles’ license plates. This helped us to uncover each respondent’s chosen speed along the freeways. First, the speeds/license plates of all vehicles were recorded throughout the freeway by cameras. Then, we randomly asked drivers of vehicles to participate in the study at the end of the freeway (i.e., the road toll). Finally, we linked each respondent to his/her vehicle’ license plate recorded by cameras. As the count of speed cameras in curved/tunnel sections is different than that of the other sections a weighted mean speed was calculated. In total, 15 speed cameras were utilized. Ten of these cameras were installed on straight segments, and five on curves/tunnels.
With a length of 138 km, this freeway called ‘Qazvin – Rasht Freeway’ is part of the Iranian North-South Corridor system. This freeway has 10 tunnels with a total length of 5.5 km. Of note, the issue of speed limit is very context-dependent. In some European countries, for instance, the upper-speed limit on the safest highways is 100 Km/h (in Norway), 120 km/h (in Spain and Sweden), and 130 km/h (in France).Footnote1 There are also various maximum speed limits on freeways in other countries (112 km/h in the UK, 128 km/h in the US, 120 km/h in Turkey), on average ranging from 100 to 130 km/h. As for ethical standards related to the administration of the roadside survey, a case officer at the ‘Guilan Provincial Department of Road Maintenance and Transportation (GPDRMT)’ was consulted both orally and in writing. The officer approved the procedures to be well-aligned with ethical standards and that the integrity of the participants was adequately handled. Moreover, the police were consulted when cameras were installed.
In the first part of the survey, we asked respondents about their driving experience and driving license status to find appropriate drivers for our study’s sample. Finally, our data were limited to 1026 respondents, who reported a minimum driving experience of three months. The second part measured our main manifest variables including age, gender, educational status, and car price. The third part was devoted to measuring the different components of the theory of planned behavior with regard to complying with or exceeding the speed limit in freeways. All items were asked using a seven-point Likert scale for speed limit range of 100 km/h to 120 km/h in freeways. Previous research also confirmed and validated this instrument for measuring the TPB components (Warner, Özkan, and Lajunen Citation2009).
To measure attitudes, four questions including ‘For me to comply with the speed limit range of 100 km/h to 120 km/h in freeways over the next 3 months would be:’ harmful/beneficial, unpleasant/pleasant, bad/good and not acceptable/acceptable were asked from participants.
Subjective norm was evaluated by three statements containing ‘I think people who are important to me want me to comply with the speed limit range of 100 km/h to 120 km/h in freeways over the next 3 months’ agree/disagree, ‘I think people who are important to me think I should not/think I should comply with the speed limit range of 100 km/h to 120 km/h in freeways over the next 3 months’, and ‘People who are important to me approve/disapprove of me exceeding the speed limit 120 km/h in freeways over the next 3 months’.
Perceived behavioral control was assessed by two statements: ‘For me to comply with the speed limit range of 100 km/h to 120 km/h in freeways over the next 3 months would be:’ very difficult/very easy and ‘How confident are you that you will be able to comply with the speed limit range of 100 km/h to 120 km/h in freeways over the next 3 months?’ not very confident/very confident.
Intention to comply with the speed limit range was evaluated by three items: ‘Do you intend to comply with the speed limit range of 100 km/h to 120 km/h in freeways over the next 3 months?’ definitely do not/definitely do, ‘How much do you want to comply with the speed limit range of 100 km/h to 120 km/h in freeways over the next 3 months?’ not at all/very much, and ‘How likely is it that you will comply with the speed limit range of 100 km/h to 120 km/h in freeways over the next 3 months?’ very unlikely/very likely.
As mentioned earlier, the chosen speed of each driver was assumed to be the mean speed of his/her vehicle recorded by a number of speed cameras along the freeway. As for the analysis purpose, we define three categories of speed choice behavior: slow driving behavior (those who had mean speed lower than 100 km/h), speed limit range driving (between 100 km/h and 120 km/h), and fast driving behavior (those who exceeded the speed limit of 120 km/h).
Sample characteristics
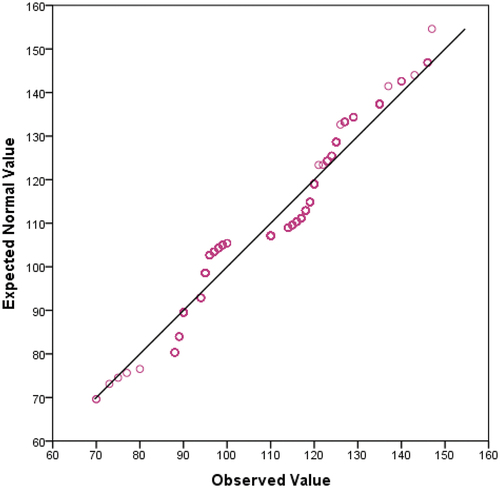
Among 1026 valid observations, 72% are male drivers (n = 735), around 29% of the respondents are well educated and the mean age of drivers is about 41.8 years (SD = 14.6, range = 18–76). The mean recorded speed of drivers is about 111 km/h (SD = 13.55). As shown in , both statistical tests and visual inspections show that speed data are normally distributed. The null hypothesis for the Shapiro-Wilk test is that the data are normally distributed. The p-value for this test was 0.11 (greater than 0.05), then the null hypothesis is supported.
Figure 2. Normal Q-Q plot of speed.
As shown in , 34% (n = 347) of the participants are in the slow driving group, 48% (n = 493) fall into the speed limit range group and the remaining drivers (18%) exceed the speed limit of 120 km/h. Descriptive statistics of the TPB items are exhibited in . Among the psychological constructs, the items of subjective norm have the highest scores.
Table 1. Descriptive statistics of the sample
Table 2. Statistics of the TPB items
Model structure
An econometric method named integrated choice and latent variable model (ICLV) or hybrid choice model (HCM) (Ben-Akiva et al., 2002; Walker Citation2001; Mehdizadeh and Ermagun Citation2020) is employed to test our hypothetical framework. This model allows an analyst to simultaneously examine the role of latent and manifest variables.
Although the speeding behavior (the outcome variable) in our modeling framework has a continuous nature, we converted it to a discrete output to develop a hybrid choice and structural equation model. Although by solely developing a structural equation model (SEM) one can investigate the simultaneous association of observed and latent factors on a continuous outcome variable (e.g. speeding behavior), SEM analysis is overall considered as a descriptive tool and is not suitable for conducting sensitivity analysis of variables such as elasticities and marginal effects. By employing an HCM, we were able to segment speed into three discrete alternatives (i.e. the choice set conceptually was segmented to three distinguishable speeding behaviors: slow driving, speed limit range driving, and fast driving) which conceptually is in line with the order of speeding behavior (from slow to fast driving behavior). This discrete choice outcome also covers all values of recorded speeding behavior. In such an HCM model we can predict the share of alternatives and conduct a sensitivity analysis. In other words, adding the choice part and mixing it with SEM yields more flexibility in terms of undertaking policy-sensitive analysis with clear-cut behavioral implications.
HCMs have two main parts: discrete choice and latent variable parts. In the latent variable part, both the measurement model and structural equation models are run. To do this, a confirmatory factor analysis (CFA) was first carried out to test the underlying factors of the TPB and their indicators. Cronbach’s α (alpha) was also calculated to determine the internal consistency of the psychological items . Several well-known fit indices including the Tucker-Lewis Index (TLI), Root Mean Square Error of Approximation (RMSEA), and Comparative Fit Index (CFI) are examined to check the model-data fit of the CFA (Kline Citation2015). A RMSEA value below 0.06 and TLI and CFI between 0.90 and 0.95 indicate a good fit. After confirming the measurement model, the structural relationships (arrows) of latent variables and manifest variables are added to the discrete choice model (here multinomial logit model). However, all parameters both in the latent variable model and choice part are estimated simultaneously.
The final estimated model is exhibited in . Different combinations of direct and indirect effects are tested, however, a model with the maximum number of statistically significant coefficients and acceptable goodness of fit is selected. The utility of three speeding groups is a function of manifest (MN) and latent variables (LV) (Ben-Akiva et al., 2002; Walker Citation2001). EquationEquation (1)(1)
(1) expresses the utility function (
) of the discrete choice part:
where,
: the utility of the speeding choice
for driver
: the vector of constants specific for
speeding alternatives.
: a vector of manifest variables (
is the unknown coefficients).
:
th latent variable (
is the respective coefficients).
: error term that is presumed to be identically and independently distributed (IID) extreme value type 1.
EquationEquation (2)(2)
(2) indicates how the LV itself can be expressed
where,
: is a different vector of manifest variables predicting zth latent variable.
: is a coefficient of latent variable
that hierarchically associate with latent variable
: is a normal distributed error term with zero mean and standard deviation
, capturing the random element of the latent variable.
In the measurement equation, the indicator of latent variables () is identified by EquationEq. 3
(3)
(3) :
where,
: is the
th indicator for
th latent variable of individual
.
: is the constant in the measurement equations for indicator
of the latent variable
.
: is the coefficient associated with the latent variable
.
: shows a normally distributed error term with zero mean and standard deviation
.
and
: are normalized to zero and one for the first indicator of each latent variable for identification purposes.
Regarding the theory of the random utility maximization, based on EquationEq. 4(4)
(4) a speeding group is chosen for driver
in discrete choice part:
where,
: is the choice indicator, taking the value 1 if group
is chosen (
has the highest utility among all speeding groups in the choice set) and takes the value of 0, otherwise.
As for the distributions of the latent variable and the indicator, the following equations are used:
where,
: is the standard normal distribution function.
Meanwhile, the choice probability can be specified by EquationEq. 7(7)
(7) :
The log-likelihood function is given by the logarithm of the product of the unconditional probability, where is an index that equals one if j is the behavior chosen by driver
:
A full information approach using PythonBiogeme (Bierlaire Citation2016) is used for estimation purposes.
Model testing
Akin to , The CFA of the TPB shows a satisfactory fit according to the data and literature (Warner, Özkan, and Lajunen Citation2009) (χ2 = 136.35, df = 48, p < 0.001, RMSEA = 0.046, TLI = 0.91, CFI = 0.91). As displayed in , the log-likelihood values for the null (zero) HCM (ICLV) model and the converged one are found to be −1652.01 and −1127.17, respectively. The overall fit of the final model (with respect to the zero model) also reached an acceptable value of 0.32.
Figure 3. Confirmatory factor analysis of the theory of planned behavior.
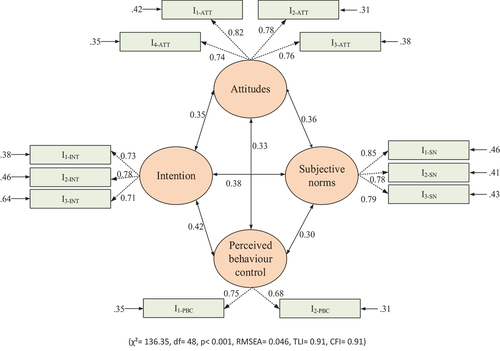
Figure 4. Hybrid speed choice model based on behavioral variables.
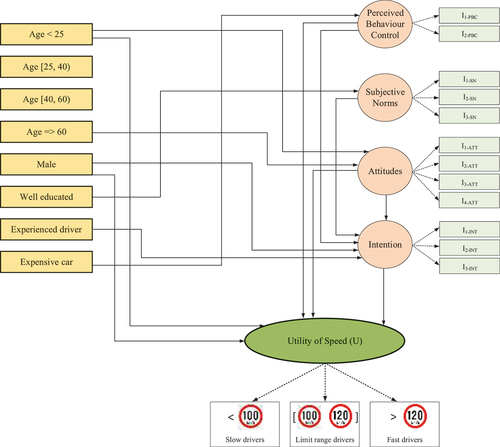
As depicted in , three utility functions corresponding to our three speeding groups are specified. Among eight demographic and socioeconomic attributes, two variables including being younger than 25 years old and gender are found statistically significant at CI 95% in the discrete choice part. In this part, except subjective norm, other psychological factors including perceived behavioral control, attitudes, and intentions significantly predicted membership in different speeding groups. In the latent variable part, a vector of demographic and socioeconomic variables including car price, education level, age lower than 25, age over 60 years old, gender, and driving experience predicts different TPB’s factors. Meanwhile, the structural relationships between TPB’s factors are also found statistically significant. Moreover, all parameters of the measurement relationships between factors and indicators are also significant.
Table 3. Estimation results of the hybrid speed choice model
HCMs have the capability to not only incorporate the relative role of latent psychological factors in the analysis, but also to predict the share of alternatives of choice set through simulating (generating 1,000 draws) different policy scenarios. As the five variables in the discrete choice model part of the HCM are either in dummy or Likert scale we simulated eleven policy scenarios. shows observed market shares of the estimated HCM before (do nothing) and after applying policy scenarios: (a) being male, (b) being younger than 25 years old, (c) an enhancement (one scale point increase) in PBC, (d) an enhancement in attitudes, (e) an enhancement in intentions, (f) being female plus an enhancement in PBC, (g) being female plus an enhancement in attitudes, (h) being female plus an enhancement in intentions, (i) being older than 25 plus an enhancement in PBC, (j) being older than 25 plus an enhancement in attitudes, (k) being older than 25 plus an enhancement in intentions. As for dummy variables, we predicted what would be the share of each alternative if everyone in the sample were in one specific category of a dummy variable. For example, ‘being male’ means what would be the share of each alternative if everyone in the sample were male. As for latent variables, we predicted what would be the share of each alternative if we had an enhancement (a one-point increase in the Likert scale of the relevant items for a latent variable). For instance, as depicted in , the sensitivity analysis shows an enhancement in attitudes toward complying with speed limits would decrease 2% of the share of the fast-driving group.
Figure 5. Changing share on speeding groups after applying policy scenarios.
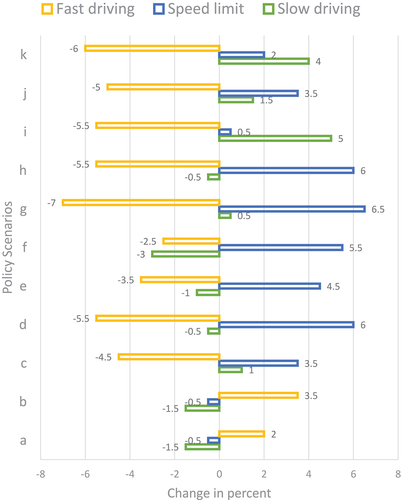
Table 4. Predicting changes in the speed choice alternatives
Analysis of results and discussion
Our study reveals that both latent psychological aspects of complying with speed limit and personal characteristics of drivers can simultaneously predict speed choice behavior. In the psychological part of our framework, a cost-benefit evaluation of speeding behavior employing the theory of planned behavior predicts speed choice behavior. This theory is also predicted by demographic and socioeconomic attributes. In line with our hypothesis, a hybrid behavioral framework could explain speed choice, highlighting the mediating role of TPB’s factors in the relationship between drivers’ personal characteristics and speeding behavior. In contrast with previous studies, our established hybrid model helps us to better understand how a combination of latent and manifest variables explains speed choice behavior.
Among the factors of the TPB, perceived behavioral control, attitudes and intentions could predict speed choice behavior. A more positive evaluation of these factors is either positively associated with slow and speed limit driving or negatively related to fast driving behavior. An enhancement in PBC, attitudes and intentions would decrease the share of fast driving by around 4.5%, 5.5%, and 3.5%, respectively.
Akin to personal characteristics of drivers, although some variables are not found statistically significant predictors of speed choice, some have only an indirect effect and others have both direct and indirect effects. We find that the youngest age group of drivers (between 18 to 25 years old) and gender both directly and indirectly (through the mediating role of TPB’s factors) influence speeding behavior. The analysis shows that the share of fast driving (> 120 km/h) among males is 2% greater than females. Females also are more likely than males to comply with a speed limit range of 100 to 120 km/h in freeways. The share of fast driving among younger drivers (<25 years old) is 3.5% greater than other drivers.These drivers (< 25) are also less likely to fall into the slow driving group (< 100 km/h). On the other hand, these two variables are also correlated with attitudes and intentions. Males are less likely to report strong intentions about complying with the speed limit range. In addition, younger drivers are more likely to report weak attitudes toward speeding in the speed limit range. This highlights weaker beliefs among males and younger drivers in terms of complying with the speed limit range, which in turn, lead to fast driving behavior among these drivers in freeways.
Our results cast a new light on the analytical method of speed choice behavior. In contrast with different speed choice analysis approaches in the literature, we find that some traditional explanatory variables are not direct predictors of speed choice behavior; they may have an indirect impact. Where we to employ a simple regression or discrete choice model, we would not have been able to disclose such indirect effects. For example, car price is not found to be a direct predictor of speed choice, but our model revealed participants who drive an expensive car to be more likely to report lower PBC with regard to complying with the speed limit range, which in turn could influence speeding behavior. Expensive cars are more likely to induce stronger safety perceptions in drivers and this may be related to weaker PBC related to speeding behavior. Some measures should be taken by vehicle manufacturers to control the speed status of high-cost vehicles.
Well educated drivers reported strong subjective norms, highlighting the role of family members, friends and those who are important to drivers in terms of complying with speed limits and speed choice behavior. Two age groups including the youngest and the oldest could associate with attitudes. While the oldest group (over 60 years old) are more likely to state stronger attitudes toward complying with speed limits, the youngest group (<25 years) reported less safety-favorable attitudes. Moreover, female and experienced drivers reported stronger intentions to comply with the speed limit range.
Policy scenarios of our advanced analytical method demonstrate that (1) latent psychological factors have more impacts on speed choice behavior compared to demographic and socioeconomic variables, (2) if all drivers were females, an enhancement in attitudes, perceived behavioral control and intentions to comply with speed limit would decrease the share of fast driving by 7%, 2.5% and 5.5%, respectively, (3) if all drivers were older than 25 years old, an enhancement in attitudes, perceived behavioral control and intentions would decrease the share of fast driving by 5.5%, 5% and 6%, respectively. These findings imply that road safety experts could focus on younger as well as male drivers when it comes to attitudinal campaigns and instructions in terms of speed-related policies.
Previous studies also showed that road familiarity/features, behavior of other drivers, traffic conditions and atmospheric conditions can also influence speed choice behavior (e.g. Haglund and Åberg Citation2000; Colonna et al. Citation2016; Kanellaidis Citation1995). Although we gathered the data under the same weather conditions (i.e., sunny days) in the summertime (August) to control for potential biases concerning atmospheric conditions the data in this study are limited to self-reported behavioral (human) factors. We aimed to exclusively focus on individual and psychological factors in speed choice analysis.
Conclusions
The current study casts a new light on the analysis of speed choice behavior. We advanced a hybrid model to investigate how human factors can predict speed choice behavior. The findings boost our knowledge about which segment of drivers are more likely to obey speed limit rules. Our analytical method also presents policy scenarios to evaluate the relative importance of different latent and manifest variables. When it comes to the sole effect of a variable, an enhancement in attitudes toward speed limit compliance has the most impact on the reduction of fast driving. This implies that changing speeding behavior through nudging of attitudes can yield promising results.
In terms of policy and implications, first, we recommend that to establish an efficient policy in terms of speed compliance, beliefs and attitudinal campaigns should be targeted toward male and young drivers. Anti-speeding campaigns could develop specific training for male drivers in the driving education process.
Second, novice drivers and drivers who drove expensive car are more likely to report weak intentions and perceived behavioral control, which may lead to exceeding speed limits. Some measures should be taken to inform novice drivers about the different consequences of fast driving. It may be helpful to incorporate both information and practical demonstrations of rather small speed increases in driving education. Future studies could fruitfully explore behavioral change of novice drivers further by employing longitudinal data.
Even though subjective norm was positively related to intention it had no direct influence on speed choice behavior. This issue may highlight that there is a weak social pressure regarding speeding behavior in Iran. Policymakers could take more relevant measures through general media to increase social pressure regarding complying with speed limits. Family members, peers, and friends can play an important role, encouraging drivers to comply with speed limits. Future research should consider the potential effects of driving behavior of family members, friends and other drivers more carefully, to understand how the social environment can impact speeding behavior.
Disclosure statement
No potential conflict of interest was reported by the author(s).
Notes
1. World Health Organization. (2018). Global status report on road safety 2018. World Health Organization.
References
- Af Wåhlberg, A., L. Dorn, and T. Kline. 2011. “The Manchester Driver Behaviour Questionnaire as a Predictor of Road Traffic Accidents.” Theoretical Issues in Ergonomics Science 12 (1): 66–86. doi:10.1080/14639220903023376.
- Af Wåhlberg, A. E. 2006. “Speed Choice versus Celeration Behavior as Traffic Accident Predictor.” Journal of Safety Research 37 (1): 43–51. doi:10.1016/j.jsr.2005.10.017.
- Ahie, L. M., S. G. Charlton, and N. J. Starkey. 2015. “The Role of Preference in Speed Choice.” Transportation Research Part F: Traffic Psychology and Behaviour 30: 66–73. doi:10.1016/j.trf.2015.02.007.
- Ajzen, I. 1991. “The Theory of Planned Behavior.” Organizational Behavior and Human Decision Processes 50 (2): 179–211. doi:10.1016/0749-5978(91)90020-T.
- Anastasopoulos, P. C., and F. L. Mannering. 2016. “The Effect of Speed Limits on Drivers’ Choice of Speed: A Random Parameters Seemingly Unrelated Equations Approach.” Analytic Methods in Accident Research 10: 1–11. doi:10.1016/j.amar.2016.03.001.
- Ayuso, M., M. Guillén, and M. Alcañiz. 2010. “The Impact of Traffic Violations on the Estimated Cost of Traffic Accidents with Victims.” Accident Analysis & Prevention 42 (2): 709–717. doi:10.1016/j.aap.2009.10.020.
- Bandura, A. 1991. “Social Cognitive Theory of Self-regulation.” Organizational Behavior and Human Decision Processes 50 (2): 248–287. doi:10.1016/0749-5978(91)90022-L.
- Bierlaire, M. 2016. Estimating Choice Models with Latent Variables with PythonBiogeme (No. REP_WORK).
- Bordarie, J. 2019. “Predicting Intentions to Comply with Speed Limits Using a ‘Decision Tree’applied to an Extended Version of the Theory of Planned Behaviour.” Transportation Research Part F: Traffic Psychology and Behaviour 63: 174–185. doi:10.1016/j.trf.2019.04.005.
- Colonna, P., P. Intini, N. Berloco, and V. Ranieri. 2016. “The Influence of Memory on Driving Behavior: How Route Familiarity Is Related to Speed Choice.” An On-road Study. Safety Science 82: 456–468.
- De Pelsmacker, P., and W. Janssens. 2007. “The Effect of Norms, Attitudes and Habits on Speeding Behavior: Scale Development and Model Building and Estimation.” Accident Analysis & Prevention 39 (1): 6–15. doi:10.1016/j.aap.2006.05.011.
- Etika, A. A., N. Merat, and O. Carsten. 2020. “Do Drivers Differ in Their Attitudes on Speed Limit Compliance between Work and Private Settings? Results from a Group of Nigerian Drivers.” Transportation Research Part F: Traffic Psychology and Behaviour 73: 281–291. doi:10.1016/j.trf.2020.06.024.
- Fildes, B. N., G. Rumbold, and A. Leening. 1991. “Speed Behaviour and Drivers’ Attitude to Speeding.” Monash University Accident Research Centre, Report 16: 186.
- Haglund, M., and L. Åberg. 2000. “Speed Choice in Relation to Speed Limit and Influences from Other Drivers.” Transportation Research Part F: Traffic Psychology and Behaviour 3 (1): 39–51. doi:10.1016/S1369-8478(00)00014-0.
- Hong, V., S. K. Iwamoto, R. Goto, S. Young, S. Chomduangthip, N. Weeranakin, A. Nishi, and F. Chen. 2020. “Socio-demographic Determinants of Motorcycle Speeding in Maha Sarakham, Thailand.” PLoS one 15 (12): e0243930. doi:10.1371/journal.pone.0243930.
- Iversen, H., and T. Rundmo. 2004. “Attitudes Towards Traffic Safety, Driving Behaviour and Accident Involvement among the Norwegian Public.” Ergonomics 47 (5): 555–572. doi:10.1080/00140130410001658709.
- Jacques, M. A. P., M. S. Velloso, and C. V. Torres. 2018. “Study of Drivers’ Salient Beliefs and Intention to Comply with Speed Limits on Urban Roads.” Transportation Research Part F: Traffic Psychology and Behaviour 55: 435–450. doi:10.1016/j.trf.2018.03.022.
- Kanellaidis, G. 1995. “Factors Affecting Drivers’ Choice of Speed on Roadway Curves.” Journal of Safety Research 26 (1): 49–56. doi:10.1016/0022-4375(94)00024-7.
- Kashani, A. T., M. B. Anvari, and A. Mohammadian. 2016. “Male Drivers Speed Choice in Iran in Relation to Driver and Front Passenger Characteristics.” Transportation Research Part F: Traffic Psychology and Behaviour 41: 97–103. doi:10.1016/j.trf.2016.06.011.
- Kline, R. B. 2015. Principles and Practice of Structural Equation Modeling. Guilford publications.
- Mehdizadeh, M., and A. Ermagun. 2020. ““I’ll Never Stop Driving My Child to School”: On Multimodal and Monomodal Car Users.” Transportation 47 (3): 1071–1102. doi:10.1007/s11116-018-9949-5.
- Peterson, C. M., and J. E. Gaugler. 2021. “To Speed or Not to Speed: Thematic Analysis of American Driving Narratives.” Journal of Safety Research 78: 129–137. doi:10.1016/j.jsr.2021.04.005.
- Podsakoff, P. M., S. B. MacKenzie, J. Y. Lee, and N. P. Podsakoff. 2003. “Common Method Biases in Behavioral Research: A Critical Review of the Literature and Recommended Remedies.” Journal of Applied Psychology 88 (5): 879. doi:10.1037/0021-9010.88.5.879.
- Quimby, A., G. Maycock, C. Palmer, and S. Buttress. 1999. The Factors that Influence a Driver’s Choice of Speed: A Questionnaire Study. Crowthorne, UK: Transport Research Laboratory.
- RSM. 2003. Road Safety Manual. World Road Association (PIARC).
- Shinar, D., E. Schechtman, and R. Compton. 2001. “Self-reports of Safe Driving Behaviors in Relationship to Sex, Age, Education and Income in the US Adult Driving Population.” Accident Analysis & Prevention 33 (1): 111–116. doi:10.1016/S0001-4575(00)00021-X.
- Stephens, A. N., M. Nieuwesteeg, J. Page-Smith, and M. Fitzharris. 2017. “Self-reported Speed Compliance and Attitudes Towards Speeding in a Representative Sample of Drivers in Australia.” Accident Analysis & Prevention 103: 56–64. doi:10.1016/j.aap.2017.03.020.
- Stradling, S., M. Meadows, and S. Beatty (2001). “Characteristics of Speeding, Violating and Thrill-seeking Drivers.” In International conference on traffic and transport psychology-ICTTP 2000, held 4–7 September 2000, Berne, Switzerland-keynotes, symposia, thematic sessions, workshops, posters, list of participants and word viewer-CD ROM.
- Ulleberg, P., and T. Rundmo. 2002. “Risk–taking Attitudes among Young Drivers: The Psychometric Qualities and Dimensionality of an Instrument to Measure Young Drivers’ Risk–taking Attitudes.” Scandinavian Journal of Psychology 43 (3): 227–237. doi:10.1111/1467-9450.00291.
- Walker, J. L. (2001). Extended discrete choice models: integrated framework, flexible error structures, and latent variables (Doctoral dissertation, Massachusetts Institute of Technology).
- Warner, H. W., T. Özkan, and T. Lajunen. 2009. “Cross-cultural Differences in Drivers’ Speed Choice.” Accident Analysis & Prevention 41 (4): 816–819. doi:10.1016/j.aap.2009.04.004.
- Watson, B., A. Watson, V. Siskind, J. Fleiter, and D. Soole. 2015. “Profiling High-range Speeding Offenders: Investigating Criminal History, Personal Characteristics, Traffic Offences, and Crash History.” Accident Analysis & Prevention 74: 87–96. doi:10.1016/j.aap.2014.10.013.
- Yadav, A. K., and N. R. Velaga. 2021. “Investigating the Effects of Driving Environment and Driver Characteristics on Drivers’ Compliance with Speed Limits.” Traffic Injury Prevention 22 (3): 201–206. doi:10.1080/15389588.2021.1893699.