
 ?Mathematical formulae have been encoded as MathML and are displayed in this HTML version using MathJax in order to improve their display. Uncheck the box to turn MathJax off. This feature requires Javascript. Click on a formula to zoom.
ABSTRACT
Ride-sourcing drivers, as individual service suppliers, can freely adopt their own relocation strategies, including waiting, cruising freely, or following the platform recommendations. These decisions substantially impact the balance between supply and demand, and consequently affect system performance. We conducted a stated choice experiment to study the searching behaviour of ride-sourcing drivers and examine novel policies. A unique dataset of 576 ride-sourcing drivers working in the US was collected and a choice modelling approach was used to estimate the effects of multiple existing and hypothetical attributes. The results suggest that ride-sourcing drivers’ relocation strategies vary considerably between different drivers groups. Surge pricing significantly stimulates drivers to head toward the designated areas. However, the distance between the driver’s location and surge or high-demand areas demotivates them from following the platform repositioning recommendations. We discuss the implications of our findings for various platform policies on real-time information sharing and platform repositioning guidance.
Introduction
Ride-sourcing companies – also known as Transport Network Companies (TNCs) – such as Uber and Lyft have been receiving a positive reception from the general public given their growing market share, especially among urban travellers (Conway, Salon, and King Citation2018), and have gained more than one-third of the international taxi market (Bryan and Gans Citation2019). Ride-sourcing is a two-sided digital platform that matches ride requests submitted by riders via a mobile app with available drivers who supply a door-to-door transport service. In this setting, drivers are not only chauffeurs but also private fleet providers. Therefore, ride-sourcing drivers can make various choices at the strategic, tactical, and operational levels. At the operational level, drivers can independently decide on whether to wait around the drop-off location of the last rider, drive to the areas recommended by the platform, or cruise freely with the aim of finding a ride request. This freedom has fundamental implications for the system performance in general and the balance between supply and demand in particular. For instance, the unavailability of drivers in a certain region can increase the rider’s waiting time and decrease the match rate, and consequently the system reliability. Furthermore, the so-called idle cruising – referring to moving while no passenger is in the car – can contribute to traffic congestion caused by ride-sourcing operations (Tirachini Citation2020; Tengilimoglu and Wadud Citation2021).
Ride-sourcing platforms are interested in steering individual suppliers so as to keep the balance between supply and demand. This is a complex task due to the unpredictable nature of the dynamic demand and the heterogeneity among service suppliers. Platforms adopt various dispatching algorithms, initiatives, and pricing strategies to efficiently reposition empty vehicles and possibly reduce the fleet size and total vehicle mileage. Using taxi trip data in New York, Vazifeh et al. (Citation2018) propose a near-optimal repositioning framework that can decrease the fleet size by 30%. The mainstream of the literature is focused on the optimal algorithms for empty vehicle routing and repositioning to minimise the number of rebalancing vehicles (Zhang and Pavone Citation2016; Wen, Zhao, and Jaillet Citation2018; Braverman et al. Citation2019) and fleet size (Iglesias et al. Citation2019; Narayan et al. Citation2021), or maximise the profit of the platform and drivers (Godfrey and Powell Citation2002; Gao, Jiang, and Xu Citation2018). Another research direction is concerned with optimal surge pricing as a financial relocation incentive and its implications (Lu, Frazier, and Kislev Citation2018; Chen et al. Citation2020; Besbes, Castro, and Lobel Citation2021). Despite the advanced algorithms that have been proposed in the literature and the variety of strategies tested in practice, related challenges such as a high number of idle vehicles, increasing empty mileage and traffic congestion persist (Henao and Marshall Citation2019; Tirachini Citation2020; Tengilimoglu and Wadud Citation2021). Most of the studies assume that the drivers are fully compliant with the repositioning algorithms and policies of a centralised platform and ignore the behavioural aspects of individual drivers. While drivers’ strikes worldwide and related court cases demonstrate a widespread dissatisfaction of drivers with the system operations that causes distrust. Such distrust leads to drivers’ dismissal of the platform suggestions and therefore influences the system efficiency and particularly idle repositioning (Özer, Subramanian, and Wang Citation2018). This calls for gaining a better understanding of drivers’ behaviour and their response to various policies and strategies.
There is a growing body of literature aiming to explore the behaviour of ride-sourcing drivers in various aspects (Fielbaum and Tirachini Citation2020; Xu et al. Citation2020; Zuniga-Garcia et al. Citation2020; Ashkrof et al. Citation2022; He Citation2021). Ashkrof et al. (Citation2020) carried out a qualitative analysis of system operations from the drivers’ perspective and proposed a framework that maps the relationship between the tactical and operational decisions of drivers. They concluded that even though all drivers attempt to maximise their income, their approach differs considerably depending on the platform strategies, drivers’ and riders’ characteristics, as well as exogenous factors. Analysing 9000 ride-sourcing trips in Beijing, Leng et al. (Citation2016) found that the idle time of drivers is reduced when a set of financial incentives are offered by the platform. Zuniga-Garcia et al. (Citation2020) demonstrated that the current relocation and pricing algorithms do not sufficiently take drivers’ decisions into account. Using trajectory information of the DiDi drivers in China, Xu et al. (Citation2020) reported clear customer search behavioural differences at various times of the day, especially between full-time and part-time drivers. Publicly available ride-sourcing data does not contain information on drivers’ positions when travelling without a passenger on board and, therefore, cannot fully reveal drivers’ repositioning behaviour and preferences. A tailored experiment is therefore needed to investigate the relocation decisions and preferences of drivers under various circumstances.
To the best of our knowledge, this is the first study specifically designed to empirically investigate drivers’ relocation strategies and their reaction to the platform repositioning guidance. Furthermore, we also study drivers’ responses to potential alternative policies and related information provisioned. To this end, a unique dataset of 576 ride-sourcing drivers working in the US is collected using an original carefully designed stated preference survey, and then a choice modelling approach is applied to analysing the data. The findings offer deep insights for platform providers, algorithm developers, policymakers, and other researchers in this field to facilitate the improvement of supply-side operations and planning. The following sections describe the survey design, data collection process, modelling, results, discussion, and conclusions.
Survey design
Ride-sourcing drivers switch between three repositioning states during their work shift: wait/cruise to find a ride request, drive to pick up an assigned rider, and transport a rider to his/her destination. The first state is primarily dependent on the choices of the individual ride-sourcing driver while the others are mainly directed by the platform. These three states are highly interconnected; therefore, they can influence each other. To illustrate, successful matching, which is the main objective of ride-sourcing systems, is dependent on the availability of idle drivers in proximity to the clients which can be affected by their earlier decisions. Idle ride-sourcing drivers who intend to continue their shift and search for a new ride request have several relocation choices: (i) waiting in a place near the drop-off location of the last fulfilled trip; (ii) following the platform repositioning recommendation (e.g. driving to a surge area or a high-demand area), and; (iii) cruising to move away from the drop-off location neighbourhood based on the driver’s experience, preferences, and intuition. Given the inherent difference between surge area, where surge pricing occurs due to a high local imbalance between supply and demand, and high-demand area – locations where the demand is expected to be high while the trip fare remains at the normal rate – driving to surge areas and driving to high-demand areas are considered in the following to constitute two distinctive options.
In this study, we consider the choice situation occurring when the driver has recently completed a ride and is searching for a new passenger while both surge and high-demand areas are available. Therefore, four relocation alternatives are defined:
Staying as much as possible close to the current location (standstill or driving around)
Driving to a surge area (shown by a coloured area ranging from light orange to dark red in the app)
Driving to a high-demand area (marked by a blue flashlight icon in the app)
Cruising freely into a different area based on the driver’s experience, preferences, or intuition
We hypothesise this choice to be dependent on various factors, including the spatial-temporal status of drivers, information display settings, driver’s working pattern, and their socioeconomic characteristics. To investigate the relocation strategies of ride-sourcing drivers and the explanatory factors, a Stated Choice (SC) experiment is designed. Respondents (ride-sourcing drivers) are asked to choose whether to stay around their current location, follow the surge area, drive to the high-demand area, or cruise freely. The choice is first made based upon a set of existing attributes that drivers currently experience with existing ride-sourcing systems. Subsequently, some currently unavailable information and incentives are added to investigate their potential implications in the relocation choice. illustrates the experiment set-up employed in this study.
Figure 1. The stated choice experiment set-up.
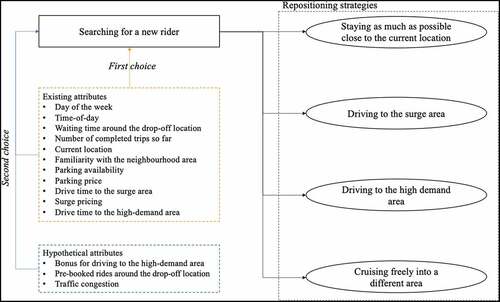
All of the existing and hypothetical attributes and their respective levels are identified based on the current system operations, driver-side app display, existing literature and past qualitative research (a focus group study with ride-sourcing drivers conducted by Ashkrof et al. Citation2020), and posts made by drivers on drivers’ online forums. provides more details about the attributes as well as their respective levels and labels.
Table 1. Attributes, attribute levels, and labels.
Day of the Week and Time of Day are pivoted around the driver’s working pattern. At the beginning of the survey, drivers are requested to state their working days and hours. This information is dynamically used in the survey to create an individual-specific experiment and ensure that drivers can relate to the study context. The Day of the Week is obtained from the respective question and is directly imported to the choice set, while the segmentation technique is applied to determine the levels of Time of Day.
Using this pivot design approach, a library of designs is constructed and respondents are assigned to one of which based on the designated reference point(s). To this end, Time of Day is divided into ten segments based on the driver’s shift starting time which can be one of the five time periods (i.e. morning, midday, afternoon, evening, and night) and working duration that can be either a full shift (8 hours) or a half shift (4 hours). shows the segmented designs for Time of Day. To illustrate, if a driver starts his/her shift at 10:00 and works for approximately 8 hours, the displayed levels of Time of Day will be 8:00, 12:00, and 16:00 for this driver.
Table 2. The levels of time of day pivoted around the driver’s working shift.
To design the SC experiment with a statistically efficient combination of the attribute levels, a Bayesian efficient design is applied. First, the asymptotic variance-covariance (AVC) matrix is estimated by calculating the negative inverse of the expected second derivative of the loglikelihood function of the choice model. Subsequentially, the standard error of the parameter estimates is obtained from the roots of the diagonal of the AVC matrix and then is minimized to find an efficient design measured by an efficiency measure. The most widely used efficiency measure is the so-called D-error which is the determinant of the AVC matrix (Bliemer and Rose Citation2010). Given that no prior knowledge about the parameter estimates is available, the design was initially constructed using assuming the priors are equal to zero (orthogonal):
Where denotes the AVC matrix,
is the choice set design, and
refers to the number of parameters. Then, a pilot of 50 responses was conducted to estimate the priors and construct the AVC matrix. To achieve a more reliable design that is less dependent on the exact priors, the Bayesian design is used. In this method, the priors are assumed to be random variables expressing uncertainty about the parameter value. To this end, the so-called
expressed in Eq. (2) is used:
Where is a random variable with a joint probability distribution function
given parameter
. In this study,
is assumed to be uniformly distributed:
where
and
are the mean and standard deviation, respectively, obtained from the pilot phase. The software package NGENE (ChoiceMetrics Citation2018) was used to construct 24 choice sets in 6 blocks that were randomly distributed between respondents.
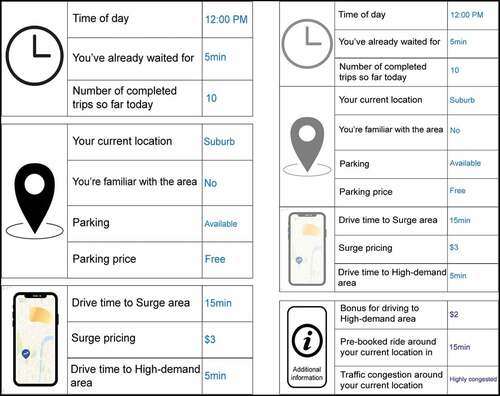
A survey software platform is used to program an online questionnaire that enables the data collection process. To make sure that respondents comply with the survey requirements (i.e. being an active ride-sourcing driver working at least once a week), a series of screening questions is deployed at the beginning of the questionnaire. Eligible drivers are asked to provide details of their working pattern which then, as explained above, feed the segmented design. Next, the introduction to the choice experiment coupled with an example is shown and then respondents are requested to indicate their relocation choices based on the information provided. provides an illustration of the choice set displayed in each scenario. The last section of the survey collects respondent-specific information such as the driver’s work as well as socio-demographic characteristics including work experience, employment status, job satisfaction level, gender, age, and education.
Figure 2. Choice set interface with the existing (left) and hypothetical (right) attributes.
Survey data
In this study, Uber and Lyft drivers working in the United States were selected to be part of the survey sample. A panel company was hired to recruit prospective respondents for this hard-to-reach target group. In total, 752 complete responses were collected between November 2020 and February 2021. A comprehensive data quality analysis was performed to filter out low-quality responses caused by short response time and the lack of sufficient attention. As a result, 576 responses were retained for the analysis.
The descriptive statistics of the data show that around 50% and 15% of the drivers solely drive for either Uber or Lyft, respectively; whereas the remaining drivers drives for both platforms (i.e. multihoming). Around 40% of the drivers are fully financially reliant on the ride-sourcing job, labelled as full-time drivers. These drivers also work, on average, more hours per week than part-time drivers – drivers who have other employment-related income. Regarding work experience, most of the drivers have been working as ride-sourcing drivers for the last 13–36 months. The most common workday is Monday. Furthermore, more than 70% of the drivers work in the morning shift for either 4 or 8 hours. About 70% of the sample consists of male drivers, and more than 80% of the drivers are younger than 40 years old.
Discrete choice modelling
A discrete choice modelling approach is applied to unravel the relocation strategies of drivers and identify the influential existing and potential factors. Assuming that both surge and high-demand areas are available, we define four choice alternatives: waiting around, driving to a surge area, heading to a high-demand area, and cruising freely based on their experience and intuition. Then, the identified attributes are used to formulate the utility function of alternative as follows:
Where the first term refers to the alternative-specific attributes ( presented in the choice experiment, the second component includes the individual-specific factors such as the driver’s socio-economic characteristics (
, and the last component is the error term (
that captures the unexplained variation under the assumption of being independently and identically distributed.
and
are the coefficients vectors representing the marginal effects of the exploratory attributes and individual-specific factors respectively. The Random Utility Maximation (RUM) approach is used to estimate the choice models by the software package PandasBiogeme (Bierlaire Citation2020).
To ensure a rigorous and reliable analysis, we use a variety of model specification techniques to identify the critical variables for inclusion in our models. We adopt a hybrid stepwise approach, a combination of forward selection and backward elimination, which allows iteratively including and excluding the attributes and their levels based on their statistical significance and model fit. In order to avoid the issues associated with the stepwise approach, as detailed by Thompson (Citation1995), we take steps to prevent overfitting the model by striking a balance between model fit and complexity. To achieve this, we employ widely recognised techniques, such as the Akaike Information Criterion (AIC) and Bayesian Information Criterion (BIC), to identify and eliminate variables with little predictive power resulting in a more parsimonious and robust model.
In order to ensure that our model specification is not solely based on statistical significance, we have taken a bottom-up approach firmly grounded in behaviour theory. To this end, we conduct a comprehensive review of relevant scientific and grey literature to inform the variable selection process and ensure that variables deemed meaningful and pertinent to our research question are included. We rely on the conceptual framework proposed by Ashkrof et al. (Citation2020), which characterises the primary components of drivers’ behaviour, including relocation strategies. To further enrich our understanding, we incorporate empirical evidence from first-hand information shared by ride-sourcing drivers on online forums (e.g. uberpeople.net). Ultimately, we select the final model specification based on a balance between statistical fit and theoretical underpinning of expected behaviour.
Model estimation results
Based on the incorporated variables, four models divided into two groups are reported. At the upper level, two scenarios are defined based on the information shown to drivers (existing and hypothetical). For each scenario, two models are estimated distinguished by the variables incorporated into the choice models:
Primary: This model contains solely the variables displayed in the choice experiments.
Full: The working and socio-demographic characteristics of the drivers are added to this model.
This incremental inclusion of categories of variables enables understanding the impacts of different types of attributes on the repositioning decision of ride-sourcing drivers depending on the application of interest and the available information. For example, in a future application of the choice model in case no information about the characteristics of individual drivers is available, the primary model can still be used.
shows the results of the models built upon the existing and hypothetical attributes. ASC represents the alternative specific constant, the suffixes W (Waiting/staying around), S (driving to the Surge area), H (driving to the High-demand area), and C (Cruising freely) indicate the utility function for which the attribute is relevant.
Table 3. The results of the choice models built upon the existing and the hypothetical attributes.
We first review the results of the models estimated for the current information display setting and then proceed with reporting the results of the hypothetical scenario. The negative value of Waiting Time_W suggests that drivers tend to move to a different area in case the waiting time around the drop-off location increases. On the other hand, drivers working on weekends as well as Fridays are inclined to wait around their location. This might stem from the relatively higher demand on these days of the week (Rangel et al. Citation2021). Therefore, drivers can receive more requests with less driving effort (operational costs). Based on the current system setting, at the beginning of the shift, there is a strong aversion to cruise freely. This might be because the risks of self-determining movements are typically higher, therefore, drivers are willing to first try out waiting or following the platform’s suggestions. Interestingly, drivers who have had the experience of being conventional taxi drivers prior to joining the platform dislike cruising on their own and have a tendency to chase the platform repositioning recommendations (i.e. high-demand/surge area) or stay at a particular location to receive a ride request. This could be attributed to their past experience in cruising as taxi drivers, leading them to opt for a system that offers more guidance.
The number of completed trips since the beginning of the shift has a positive effect on driving to the surge and high-demand areas. A satisfactory working experience can develop trust between drivers and the platform which leads to a higher willingness to follow the app recommendation. This is in line with the positive significant value of Fully Satisfied Drivers_H that suggests that highly satisfied drivers (i.e. the drivers who gave 4.5/5 out of 5 stars to the system performance) are more likely to drive to a high-demand area indicated by the platform. Moreover, the results of the first scenario suggest that beginning drivers with a working experience of less than one year (most of whom have high trust in system operations) prefer not to wait or cruise freely but drive to the surge and high-demand areas.
The chance of staying close to the current location is higher in the city centre, where the probability of receiving a ride while standing still or driving around is higher compared to a suburban area. Parking availability is also a crucial factor that motivates drivers to wait at a particular location to receive a new ride request. Another influential determinant is the employment status of drivers. Part-time drivers tend to stay around. They need to minimize their operational costs during their working time which is limited by other working activities. That is why they might be more reluctant to move into new areas. Drivers who have a college degree or higher are also more inclined to wait, everything else being the same. We also examine the relation between ride acceptance behaviour and repositioning strategy. We find that drivers with an acceptance rate of more than 70% tend to move as opposed to waiting. These drivers are less selective in assessing ride requests and their intention is to find a ride as quickly as possible, paying less attention to its attractiveness.
As expected, surge pricing stimulates drivers to head to the surge area as they can expect to earn more money in the case of reaching the designated area, receiving and accepting a ride request within the surge pricing period. On the other hand, a higher distance to a surge or a high-demand area discourages drivers from following the platform repositioning suggestions. This is because the demand-supply intensity dynamically changes and the risk of missing the opportunity is higher when the distance increases. The value of drive to the surge area which is the amount of surge pricing for every minute added to the travel time to the surge area is estimated to be roughly 0.11 $/min based on the results of the Primary model.
When drivers are provided with more information and incentives, some new alternative-specific factors start playing an essential role while the impact of some existing variables changes. Moreover, even several attributes such as the driver’s location, experience level, and education are no longer statistically significant at the 95% level. A strong unobserved preference for staying around is identified in the second scenario. Moreover, being familiar with the neighbourhood area increases the probability of waiting or driving to the surge or high-demand area. Presumably, this familiarity helps drivers to find suitable spots to wait or choose the best route to promptly reach the surge or high-demand area.
The existence of pre-booked rides around the drop-off location can influence the choice of drivers to stay around. This hypothetical attribute gives drivers information about the next potential client who can be picked up within their current zone. If drivers declare their interest in waiting for the incoming request, the ride will be secured for them. Nevertheless, drivers may prefer not to stay if the waiting time is relatively high. Moreover, drivers are more likely not to wait at the beginning of the shift arguably because alternative promotions including surge pricing and high-demand bonus can be expected.
Another variable included in the second scenario is the bonus for driving to a high-demand area. The positive significant value of the estimated parameter suggests that drivers are highly inclined to reach the high-demand area if a promotion is offered. Drivers are about 60% more sensitive to the high-demand bonus than toward surge pricing. This is because unlike surge pricing, which is paid only if a rider is picked up, this bonus is guaranteed if the driver is driving toward the high-demand area. This has a potential implication when the platform intends to redistribute the available fleet, especially when drivers do not deliberately follow the surge area.
Traffic congestion around the current location turns out to be a significant determinant. A highly congested area discourages drivers to cruise freely given that they probably get stuck in the traffic congestion without picking up passengers – increasing the operational costs. Due to the more restricted time, part-time drivers are less inclined to cruise freely and are more responsive to financial promotions and extra information offered by the platform than full-time drivers, everything else being equal.
Discussion and conclusions
We empirically study the relocation behaviour of ride-sourcing drivers. To this end, we designed a stated choice experiment to allow investigating the behaviour of drivers under the existing system settings as well as under a hypothetical scenario exploring their potential responses in the event of new circumstances. In total, 576 qualified responses from Uber and Lyft drivers working in the United States were collected, and a series of discrete choice models were estimated. Four choice alternatives were considered: staying around the drop-off location, driving to a surge area, driving to a high-demand area, and cruising freely. Indicating surge and high-demand areas are the most well-known examples of platforms’ repositioning guidance. Moreover, various existing and hypothetical incentives and information about driving conditions and demand characteristics were shared with drivers to identify the influential determinants and their potential effects. We also investigated the impacts of other aspects of driver’s behaviour at the tactical level (working shift) and the operational level (ride acceptance behaviour) as well as other individual attributes.
Surge pricing – also known as dynamic pricing – is an incentive offered by platforms to redistribute the available fleet and address local imbalances in supply-demand ratios. Platforms also indicate high-demand areas where demand is relatively high but without changes to the normal rate (for both riders and drivers). In general, platform repositioning guidance is a controversial policy that provokes serious disputes. On the one hand, Jiang, Kong, and Zhang (Citation2018) and Jiao (Citation2018) argue that the unpredictability and ambiguity of surge pricing harbour serious doubts among drivers. On the other hand, surge pricing is considered to be a near-optimal solution that can increase the match rate as well as drivers’ income (Cachon, Daniels, and Lobel Citation2017; Lu, Frazier, and Kislev Citation2018; Nourinejad and Ramezani Citation2019; Ashkrof et al. Citation2022). Conducting a focus group study with Uber drivers, Ashkrof et al. (Citation2020) reported that some drivers, in particular experienced ones, distrust surge pricing as well as high-demand areas and do not follow them. Those drivers believed that the platform misled them by not reporting surge and high-demand areas in real-time in order to relocate them to a particular location. These are in line with our findings that suggest that following the surge and high-demand area appears to be more attractive for some groups of drivers depending on their working experience, operational performances, and satisfaction level. Namely, relatively inexperienced drivers, as well as highly satisfied drivers, and drivers with a higher number of completed trips since the beginning of their shift are more likely to follow the recommended areas. The level of surge pricing and the expected travel time between the driver’s location and the surge/high-demand area are recognized as the other significant determinants.
Additional repositioning guidance options which are not yet available were studied in the hypothetical scenario. Drivers were given some additional information, including the existence of any pre-booked rides in the waiting area (associated with the waiting alternative), bonus for driving to the high-demand area, and the level of congestion around their location (which may impact propensity for cruising freely). We found all these variables can play a role in the relocation choice of drivers. Pre-booked rides can be shown to drivers in advance to enable them to assess whether to stay or not depending on the expected waiting time. In order to motivate drivers to relocate to a particular area such as a high-demand area, a guaranteed bonus may be offered. This guaranteed bonus is valued 60% more highly than surge pricing, which is not necessarily secured. Obviously, the platform will need to determine how to set such a bonus in a way that is beneficial for its operations. Providing traffic information related to the surrounding area of the current location of drivers may help reduce idle cruising as drivers are more likely not to cruise freely when the area is highly congested. Such platform guidance policies (e.g. information on pre-booked rides as well as traffic congestion and a guaranteed bonus to follow high-demand areas) can be applied to indirectly control/steer drivers and assist them in making more informed decisions and thus possibly improve the level of service, reduce deadhead movements, which have been identified as one of the main drawbacks of ride-sourcing systems (Henao and Marshall Citation2019; Tengilimoglu and Wadud Citation2021), and improve the wider acceptability of ride-sourcing services.
Our findings can be used to consider the underlying determinants of drivers’ behaviour in predicting their relocation choices and designing tailored drivers’ incentives. For instance, educated part-time drivers with low acceptance rate who are more likely to stay around can be provided with more information about available parking spots and pre-booked rides in the vicinity, especially when working in the city centre on weekends and Fridays. In contrast, beginning drivers are more willing to respond to detailed information about surge and high-demand areas. This is in line with the findings of Tengilimoglu and Wadud (Citation2021) that acknowledge the behavioural heterogeneity among drivers and conclude that more effective management is needed to reduce the empty mileage of ride-sourcing services. Given that trust between individual suppliers and the platform is key to the success of such an interactive business model (Özer, Subramanian, and Wang Citation2018), the information shared by the platform needs to be accurate and unbiased and communicated in real-time to build the basic trust and develop it over time.
The results of this study can also be used as input to ride-sourcing simulation models to include the relocation behaviour of drivers, explore various policy designs, and investigate their impacts on system operations. Future research may validate the results of this study using revealed preference data.
Acknowledgments
This research was supported by the CriticalMaaS project (grant number 804469), which is financed by the European Research Council and the Amsterdam Institute for Advanced Metropolitan Solutions.
Disclosure statement
No potential conflict of interest was reported by the author(s).
Additional information
Funding
References
- Ashkrof, P., G. H. de Almeida Correia, O. Cats, and B. van Arem. 2020. “Understanding Ride-Sourcing drivers’ Behaviour and Preferences: Insights from Focus Groups Analysis.” Research in Transportation Business & Management 37 (March): 100516. doi:10.1016/j.rtbm.2020.100516.
- Ashkrof, P., G. H. de Almeida Correia, O. Cats, and B. van Arem. 2022. “Ride Acceptance Behaviour of Ride-Sourcing Drivers.” Transportation Research Part C: Emerging Technologies, 142. doi:10.1016/j.trc.2022.103783.
- Besbes, O., F. Castro, and I. Lobel. 2021. “Surge Pricing and Its Spatial Supply Response.” Management Science 67 (3): 1350–1367. doi:10.1287/mnsc.2020.3622.
- Bierlaire, M. 2020. “A Short Introduction to PandasBiogeme.” Ecole Polytechnique Federale de Lausanne 2018: 13–43.
- Bliemer, M. C. J., and J. M. Rose. 2010. “Construction of Experimental Designs for Mixed Logit Models Allowing for Correlation Across Choice Observations.” Transportation Research Part B: Methodological 44 (6): 720–734. doi:10.1016/j.trb.2009.12.004.
- Braverman, A., J. G. Dai, X. Liu, and L. Ying. 2019. “Empty-Car Routing in Ridesharing Systems.” Operations Research 67 (5): 1437–1452. doi:10.1287/opre.2018.1822.
- Bryan, K. A., and J. S. Gans. 2019. “A Theory of Multihoming in Rideshare Competition.” Journal of Economics & Management Strategy 28 (1): 89–96. doi:10.1111/jems.12306.
- Cachon, G. P., K. M. Daniels, and R. Lobel. 2017. “The Role of Surge Pricing on a Service Platform with Self-Scheduling Capacity.” Manufacturing & Service Operations Management 19 (3): 368–384. doi:10.1287/msom.2017.0618.
- Chen, X. M., H. Zheng, J. Ke, and H. Yang. 2020. “Dynamic Optimization Strategies for On-Demand Ride Services Platform: Surge Pricing, Commission Rate, and Incentives.” Transportation Research Part B: Methodological 138: 23–45. doi:10.1016/j.trb.2020.05.005.
- ChoiceMetrics. 2018. “Ngene 1.2 USER MANUAL & REFERENCE GUIDE the Cutting Edge in Experimental Design End-User License Agreement.” 241. http://www.choice-metrics.com/NgeneManual120.pdf
- Conway, M., D. Salon, and D. King. 2018. “Trends in Taxi Use and the Advent of Ridehailing, 1995–2017: Evidence from the US National Household Travel Survey.” Urban Science 2 (3): 79. doi:10.3390/urbansci2030079.
- Fielbaum, A., and A. Tirachini. 2020. “The Sharing Economy and the Job Market: The Case of Ride-Hailing Drivers in Chile.” Transportation 48 (5): 0123456789. doi:10.1007/s11116-020-10127-7.
- Gao, Y., D. Jiang, and Y. Xu. 2018. “Optimize Taxi Driving Strategies Based on Reinforcement Learning.” International Journal of Geographical Information Science 32 (8): 1677–1696. doi:10.1080/13658816.2018.1458984.
- Godfrey, G. A., and W. B. Powell. 2002. “An Adaptive Dynamic Programming Algorithm for Dynamic Fleet Management, I: Single Period Travel Times.” Transportation Science 36 (1): 21–39. doi:10.1287/trsc.36.1.21.570.
- He, Z. 2021. “Portraying Ride-Hailing Mobility Using Multi-Day Trip Order Data: A Case Study of Beijing, China.” Transportation Research Part A: Policy and Practice 146: 152–169. (June). 2020. 10.1016/j.tra.2021.01.017.
- Henao, A., and W. E. Marshall. 2019. “An Analysis of the Individual Economics of Ride-Hailing Drivers.” Transportation Research Part A: Policy and Practice 130 (January): 440–451. doi:10.1016/j.tra.2019.09.056.
- Iglesias, R., F. Rossi, R. Zhang, and M. Pavone. 2019. “A BCMP Network Approach to Modeling and Controlling Autonomous Mobility-On-Demand Systems.” The International Journal of Robotics Research 38 (2–3): 357–374. doi:10.1177/0278364918780335.
- Jiang, Z. -Z., G. Kong, and Y. Zhang. 2018. “Making the Most of Your Regret: A Behavioral Investigation of Workers’ Relocation in On-Demand Platforms by Zhong-Zhong Jiang, Guangwen Kong, Yinghao Zhang: SSRN.” SSRN Electronic Journal.
- Jiao, J. 2018. “Investigating Uber Price Surges During a Special Event in Austin, TX.” Research in Transportation Business & Management 29 (February): 101–107. doi:10.1016/j.rtbm.2018.02.008.
- Leng, B., H. Du, J. Wang, L. Li, and Z. Xiong. 2016. “Analysis of Taxi drivers’ Behaviors Within a Battle Between Two Taxi Apps.” IEEE Transactions on Intelligent Transportation Systems 17 (1): 296–300. doi:10.1109/TITS.2015.2461000.
- Lu, A., P. Frazier, and O. Kislev. 2018. “Surge Pricing Moves Uber’s Driver Partners.” SSRN Electronic Journal i. doi:10.2139/ssrn.3180246.
- Narayan, J., O. Cats, N. van Oort, and S. P. Hoogendoorn. 2021. “Fleet Size Determination for a Mixed Private and Pooled On-Demand System with Elastic Demand.” Transportmetrica A: Transport Science 17 (4): 897–920. doi:10.1080/23249935.2020.1819910.
- Nourinejad, M., and M. Ramezani. 2019. “Ride-Sourcing Modeling and Pricing in Non-Equilibrium Two-Sided Markets.” Transportation Research Part B 38 (July): 24–26. doi:10.1016/j.trpro.2019.05.043.
- Özer, Ö., U. Subramanian, and Y. Wang. 2018. “Information Sharing, Advice Provision, or Delegation: What Leads to Higher Trust and Trustworthiness?” Management Science 64 (1): 474–493. doi:10.1287/mnsc.2016.2617.
- Rangel, T., J. N. Gonzalez, J. Gomez, F. Romero, and J. M. Vassallo. 2021. “Exploring Ride-Hailing Fares: An Empirical Analysis of the Case of Madrid.” Transportation 49 (2): 0123456789. doi:10.1007/s11116-021-10180-w.
- Tengilimoglu, O., and Z. Wadud. 2021. “Evaluating the Mileage and Time Efficiency of Ridesourcing Services: Austin, Texas Case.” Transportation Letters 14 (5): 1–14. doi:10.1080/19427867.2021.1892936.
- Thompson, B. 1995. “Stepwise Regression and Stepwise Discriminant Analysis Need Not Apply Here: A Guidelines Editorial.” Educational and Psychological Measurement 55 (4): 525–534. doi:10.1177/0013164495055004001.
- Tirachini, A. 2020. “Ride-Hailing, Travel Behaviour and Sustainable Mobility: An International Review.” Transportation 47 (4): 2011–2047. doi:10.1007/s11116-019-10070-2.
- Vazifeh, M. M., P. Santi, G. Resta, S. H. Strogatz, and C. Ratti. 2018. “Addressing the Minimum Fleet Problem in On-Demand Urban Mobility.” Nature 557 (7706): 534–538. doi:10.1038/s41586-018-0095-1.
- Wen, J., J. Zhao, and P. Jaillet, 2018. “Rebalancing Shared Mobility-On-Demand Systems: A Reinforcement Learning Approach.” IEEE Conference on Intelligent Transportation Systems, Proceedings, ITSC, 2018-March, 220–225.
- Xu, Z. 2020. “On the Empty Miles of Ride-Sourcing Services: Theory, Observation and Countermeasures [Online].” University of Michigan. Accessed 5 Feb 2022. Available from. https://deepblue.lib.umich.edu/handle/2027.42/163209
- Xu, Z., A. M. C. Vignon, D. Yin, and J. Ye. 2020. “An Empirical Study of the Labor Supply of Ride-Sourcing Drivers.” Transportation Letters 14 (4): 1–4. doi:10.1080/19427867.2020.1788761.
- Zhang, R., and M. Pavone. 2016. “Control of Robotic Mobility-On-Demand Systems: A Queueing-Theoretical Perspective.” The International Journal of Robotics Research 35 (1–3): 186–203. doi:10.1177/0278364915581863.
- Zuniga-Garcia, N., M. Tec, J. G. Scott, N. Ruiz-Juri, and R. B. Machemehl. 2020. “Evaluation of Ride-Sourcing Search Frictions and Driver Productivity: A Spatial Denoising Approach.” Transportation Research Part C: Emerging Technologies 110: 346–367. (December). 2019. 10.1016/j.trc.2019.11.021.