
 ?Mathematical formulae have been encoded as MathML and are displayed in this HTML version using MathJax in order to improve their display. Uncheck the box to turn MathJax off. This feature requires Javascript. Click on a formula to zoom.
ABSTRACT
Road crashes continue to be a leading cause of death globally, with most of these crashes reportedly occurring due to human factors. Traditional road safety assessment utilises geometric and traffic parameters that consider road design inadequacies and identify traffic conflicts. However, previous studies do not represent risky driving behavior and its influence on crash occurrence. Incorporating human factors into safety evaluation is crucial to enhance the prediction and subsequent prevention of unsafe events. This research establishes a methodology to identify risky driving behavior using driving performance measures. These measures are computed based on continuous driving profiles collected using instrumented vehicles from a sample set of drivers on an expressway and are compared with historical crash data. The results indicate the significance of driving performance measures in evaluating road safety. The performance measures find application in collision avoidance systems, assessing the road design quality, testing safety countermeasures and guide for policymakers..
Introduction
Road crashes occur for several reasons; some are deterministic, while others are stochastic. Analysis of factors leading to crashes shows that most of these are due to human factors followed by vehicle factors, roadway factors, and a combination of these factors (National Research Council (US) Citation2010; Abd Rahman, Md Dawal, and Yusoff Citation2020; Chin and Quek Citation1997).
Traditional safety evaluation methods rely on crash prediction models and safety performance functions, which primarily relate the safety of roads to geometric characteristics and annual average daily traffic (Kononov, Bailey, and Allery Citation2008; Tarko et al. Citation2009). However, these methods require historical crash data, which has several limitations, including a reactive approach, small sample size, and recording errors (Chauhan, Dhamaniya, and Arkatkar Citation2022; Kuang, Qu, and Wang Citation2015; Vedagiri and Killi Citation2015).
The proactive safety assessment approach using surrogate measures of safety (SMoS) addresses some of these limitations by identifying conflicts from the traffic stream based on inter-vehicular characteristics instead of depending on crash data (Lu et al. Citation2021; Shekhar Babu and Vedagiri Citation2016). Existing SMoS are based on the proximity of vehicles and are generally measured between two conflicting vehicles (Charly and Mathew Citation2019a; Lu, Grembek, and Hansen Citation2022; Mullakkal-Babu et al. Citation2017). Although these measures consider driver-related factors such as risk perception and exposure to critical conflict events, these measures do not explicitly consider the contribution of an individual driver’s risky driving on crash occurrence (Behbahani, Nadimi, and Naseralavi Citation2015; Guo et al. Citation2022).
Risky driving behavior is a significant contributor to road crashes (Albert et al. Citation2018; Gupta, Choudhary, and Parida Citation2021; Luk et al. Citation2017; Wang et al. Citation2022). Moreover, risky driving behavior can further influence the probability of crashes caused by traffic flow parameters (Guo et al. Citation2022). This suggests that incorporating risky driving behavior can improve road safety evaluation leading to better prediction and prevention of unsafe events (Arbabzadeh and Jafari Citation2018).
Driving performance measures have been used to examine the effect of drivers behavioral characteristics on driving quality based on the assumption that a variation from typical driving behavior indicates unsafe situations (Caponecchia and Williamson Citation2018; Choudhary and Velaga Citation2019; Yadav and Velaga Citation2019; Zhang et al. Citation2016a). Risky driving behavior is often characterized by abnormal driving performance, such as a high frequency of critical braking events or a hard acceleration rate (Alrassy, Smyth, and Jang Citation2023; Bagdadi Citation2013).
This research attempts to improve the detection of risky driving behavior by using driving performance measures computed based on the continuous driving profile obtained from field data. The main contribution of this work is to identify risky driving by examining the continuous driving profile obtained from an in-vehicle data collection device. These driving performance measures are computed over time to accurately represent risky driving behavior compared to instantaneous measurements typically used in such studies (Lu, Grembek, and Hansen Citation2022; Moreno and García Citation2013; Polus and Mattar-Habib Citation2004). The measures are then validated against actual historical crash data.
Literature review
The traditional safety evaluation method mainly focuses on Safety Performance Functions (SPFs) and accident prediction models that relate the number of crashes to traffic exposure and risk factors (Kononov, Bailey, and Allery Citation2008). The exposure variables considered in most SPFs include road segment length, Annual Average Daily Traffic (AADT), vehicle miles traveled, weather conditions, and road geometry (Ahmed et al. Citation2011). This method provides an overall understanding of the influence of road geometry and weather on crash frequencies and helps rank study sites based on crash risk. However, this approach is highly aggregated and depends on the quality and availability of crash data (Venkataraman, Ulfarsson, and Shankar Citation2014). Also, crash data are not always sufficient due to limited sample size, lack of details of crash cause and reactive approach (Cafiso et al. Citation2010; Tarko et al. Citation2009). In this context, identifying appropriate driving performance measures can help detect risky driving in real time and help prevent crashes.
A review of existing driving performance measures is classified into three subsections based on the various aspects of driving performance measures. First, the existing driving performance measures are explored. Second, the data collection methods used to compute these driving performance measures are discussed. Further, the applications of the existing driving performance measures are described. Finally, inferences from this review and the objectives of the current study are presented.
Existing driving performance measures
Existing studies use parameters including acceleration (Cafiso and Cava Citation2009; Papadakaki et al. Citation2016), reaction time (Chang et al. Citation2009; Zhang et al. Citation2020) and standard deviation of lane position (Bartrim et al. Citation2020; Choudhary and Velaga Citation2017a) as driving performance measures. However, most of these driving performance measures are based on instantaneous measurements, calculated for a specific location rather than along a road section (Polus and Mattar-Habib Citation2004). Studies have also used speed derivatives such as the standard deviation of speed (Bartrim et al. Citation2020; Knapper, Hagenzieker, and Brookhuis Citation2015), and the coefficient of variation in speed to represent driver's speed volatility while making instantaneous driving decisions and its impact on the likelihood of crashes (Choudhary et al. Citation2018; Pawar and Velaga Citation2021). Further, considering the continuous driving profile over a road section is expected to represent safety more accurately.
Two accumulated driving performance measures, namely, speed uniformity and speeding, consider the speed profile over a road section to evaluate its safety (Moreno and García Citation2013). Speed uniformity is used as a surrogate to design consistency and is defined as the normalized relative area per unit length bounded between speed profile and average speed line (Polus and Mattar-Habib Citation2004). Accumulated speeding is the normalized relative area bounded between the speed profile values higher than the speed limit and the speed limit. These driving performance measures assess driving quality and correlate it with design consistency. The relationship between driver instability and crash intensity has also been investigated in literature (Arvin, Kamrani, and Khattak Citation2019). Driver instability is measured using parameters representing speed and deceleration volatilities, which captures the variation in instantaneous driving behavior. Driving volatility of speed and acceleration is expressed using standard deviation, time-varying stochastic volatility, coefficient of variation, and quartile coefficient of variation. The study concludes that volatility is one of the leading factors increasing the probability of a severe crash. Speed control is often considered necessary to prevent vehicle collisions, and the failure to do so has been correlated with driver distraction (Abd Rahman, Md Dawal, and Yusoff Citation2020).
Acceleration and its variants have been widely used to evaluate driving quality. Longitudinal acceleration, lateral acceleration (Cafiso and Cava Citation2009; Charly and Mathew Citation2019b), and jerk (Bagdadi and Várhelyi Citation2011; Pande et al. Citation2017) are used to identify critical situations which are further correlated to the safety of the road segment. Longitudinal jerk is defined as the change in acceleration between successive observations (Bagdadi and Várhelyi Citation2011; Pande et al. Citation2017). Pande et al. (Citation2017) identified the instances where the drivers experienced jerks while conducting a field driving experiment and computed the percentage of jerk events. The study further compared jerk percentages with historical crash data based on the hypothesis that road segments, where drivers have to brake more often, might be ‘unsafe with more crashes in the long-term’ (Pande et al. Citation2017).
These studies show that analyzing the driving profile over time and space could better represent the variation in human driving behavior and its relationship to road safety compared to instantaneous measurements.
Data collection methods to compute driving performance measures
The data required for driver behavior studies are typically collected using driving simulators, instrumented test vehicles, and naturalistic driving studies. summarizes the details of data collection adopted in some studies to compute driving performance measures. Driving simulators are highly preferred in behavioral studies as it provides a safe environment for a wide range of experimental studies (Bartrim et al. Citation2020; Casutt et al. Citation2014; Pawar et al. Citation2020). The sample size of driving participants in simulator studies varies from 14 to 140, as seen in (Matthews et al. Citation2012; Pavlou et al. Citation2016). These studies explore the effect of mobile phone use, drowsiness, fatigue, aggressiveness, sleep patterns, and alcohol impairment on driving behavior (Choudhary and Velaga Citation2017a; Li et al. Citation2016; Matthews et al. Citation2012). In-vehicle collision warning systems and communication devices are also evaluated using driving performance measures (Knapper, Hagenzieker, and Brookhuis Citation2015).
Table 1. Details of data collection adopted to compute driving performance in few studies.
Field data collection with instrumented test vehicles has been used to evaluate advanced driver assistance systems, automated driving systems, geometric consistency of roads, and identify near-crash events (Af Wahlberg Citation2000; Wu and Jovanis Citation2012). The sample size for field data collection varies from 15 to 47 drivers (Abd Rahman, Md Dawal, and Yusoff Citation2020; Af Wahlberg Citation2000; Cafiso and Cava Citation2009; Pande et al. Citation2017). Of the studies conducted in the field, only a few have compared the results with historical crash data (Cafiso and Cava Citation2009; Pande et al. Citation2017).
Naturalistic driving studies (NDS), which collect rich kinematic data including GPS, and video for a large sample size over a considerably long period, have been used to gain a deeper understanding of driving behavior (Campbell Citation2012; Paredes et al. Citation2022; Ziakopoulos, Kontaxi, and Yannis Citation2023). Such data provide detailed information on driving behavior and real crash and near-crash occurrences and assists in understanding the relationship between driver, roadway, and environmental characteristics (Hallmark et al. Citation2015). The relation between driver behavior and pre-crash kinematics for actual crashes has been examined using naturalistic driving data (Arbabzadeh and Jafari Citation2018; Arvin, Kamrani, and Khattak Citation2019).
To summarize, previous studies show that driving performance measures computed based on field data can lead to a deeper understanding of driving behavior even with a limited sample. However, out of the existing studies conducted in the field, only a few have compared the results with actual crash data.
Applications of Driving Performance Measures in Traffic Safety
Driving performance measures have been used in several domains of traffic safety research. These measures have been used widely to study driving behavior, such as the effect of mobile phone use (Choudhari and Maji Citation2019; Choudhary and Velaga Citation2017a; Papadakaki et al. Citation2016; Reimer et al. Citation2011), drowsiness (Caponecchia and Williamson Citation2018), aggressiveness (Precht, Keinath, and Krems Citation2017; Zhang et al. Citation2016b), sleep pattern (Bartrim et al. Citation2020), alcohol intake (Zhang et al. Citation2014), caffeine intake (Bartrim et al. Citation2020), and aging (Abd Rahman, Md Dawal, and Yusoff Citation2020). This shows the reliability of these measures in representing driving behavior precisely. In most cases, these performance measures assist in identifying situations with variability in driving or sudden unexpected driving characteristics. These studies show that a variation from typical driving behavior indicates risky situations.
Driving performance measures are used to evaluate in-vehicle systems such as collision warning systems (Chang et al. Citation2009), advanced driver assistance systems (Knapper, Hagenzieker, and Brookhuis Citation2015; Lyu et al. Citation2019; Merat, Lai, and Jamson Citation2011), communication and entertainment devices (Crisler et al. Citation2008), and automated driving systems (Calvi et al. Citation2020; Dogan et al. Citation2019; Voß, Keck, and Schwalm Citation2018). Few studies have attempted to develop real-time traffic safety risk measures to support the Advanced Driver Assistance System, drivers safety risk profiling, and roadway segments safety risk scoring (Arbabzadeh and Jafari Citation2018). Existing studies have shown that driver characteristics are associated with crash events. However, the relationship between driver behavioral characteristics and crash risk has not been explored because of its complex nature and unavailability of data. Field driving data allow such studies to gain insights into the relationship between driver behavior and crashes (Wu, Aguero-Valverde, and Jovanis Citation2014).
In short, driving performance measures have been used to study driver characteristics and their effect on driving, thus proving the reliability of these measures. However, the relationship between driving performance and crash risk has not been thoroughly investigated because of limited data.
Inferences
Summarizing the inferences from the above literature review, one can say that investigating driving performance is crucial to understanding risky driving behavior and reducing crashes caused by human factors. The best way to explore driving performance is by using field data and analyzing the same over time and space to gain a deeper understanding of driving behavior. Comparing the field findings from driving studies with historical crash data spatially and temporally could provide further insight into the effect of road geometry and time of the day on crash occurrence.
The present study aims to establish a methodology for identifying risky driving behavior using driving performance measures computed based on continuous driving profiles from field driving data. The study considers three driving performance measures: speed variability, speeding, and percentage of jerk events. These three measures are expected to represent the significant human factors influencing crashes. These driving performance measures are computed from field driving data collected along an expressway. The results are then compared with historical crash data from the study section.
Methodology
Driving performance measures are estimated based on variation in the local driving profile over a certain period, and hence, it is expected to represent risky driving behavior more precisely. The proposed methodology aims to identify risky driving behavior using performance measures computed from field driving data by comparing them with historical crash data. This approach is based on the hypothesis that road stretches where drivers exhibit risky driving behavior could lead to several crashes. Three performance measures, namely, speed variability, speeding, and percentage of jerk events, are computed for every driver along each road segment, using vehicle trajectory obtained from field driving data. These are then compared with historical crash data to identify the measures representing the safety of road sections. The major steps of the methodology are shown in , and each step is explained in detail below.
Figure 1. Flowchart of the methodology to identifying risky driving behaviour using driving performance measures.
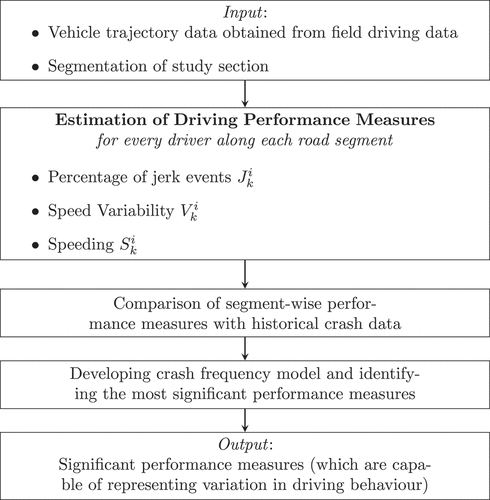
A study section is selected, and a data collection procedure is followed to record vehicle trajectory data from the field. The performance measures are estimated from field driving data. The results are compared with historical crash data. A crash frequency model is developed with historical crash data and performance measures averaged over each segment. The most significant performance measures are identified from this analysis. Driving performance measures considered in the present study include speed variability, speeding, and percentage of jerk events. Each of these measures is described in detail below.
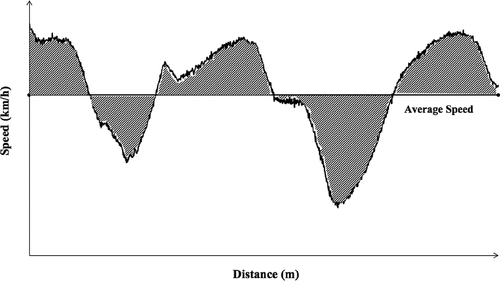
Speed variability
Speed variability is the normalized relative area per unit length bounded between speed profile and average speed line, as illustrated in (Moreno and García Citation2013). Speed variability (
) of driver
along the road segment
can be computed as:
Figure 2. Illustration of the speed variability (shaded area corresponds to ).
where is the total area (
) (shaded portion in ) bounded between speed profile
and average speed
of driver
along segment
, and
is the length of the road (m).
Speed variability indicates an individual driver’s speed variation over a road stretch. Lower speed variability means comfortable driving and good segment quality. Higher speed variability values indicate high fluctuations in speed, which corresponds to unsafe driving and indicates poor design consistency. Hence, the speed variability can represent risky driving behavior.
Speeding
Speeding is defined as the normalized relative area bounded between the speed profile values higher than the speed limit and the speed limit (Moreno and García Citation2013) and is illustrated in . Speeding, denoted as
(
), of driver
along the road segment
, can be computed as:
Figure 3. Illustration of the speeding (shaded area corresponds to ).
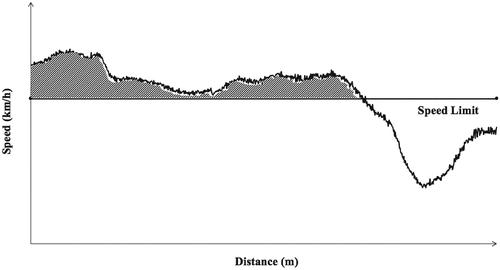
where (
) is the area (the shaded portion in ) bounded between speed profile
and speed limit
where speed is higher than the speed limit and
is the length of the road (m).
Speeding measures the variation of speed value above the speed limit. Lower speeding values indicate safe driving, while higher speeding indicates risky driving.
Percentage of jerk events
We refer to longitudinal jerk here, which could be braking or sudden acceleration. However, the present study considers only hard-braking events. Road segments where drivers have to often hard-brake may result in more crashes and, hence, can be considered unsafe. Accordingly, the longitudinal negative jerk is defined as the rate of deceleration change computed from successive trajectory observations (Bagdadi and Várhelyi Citation2011; Pande et al. Citation2017). A higher negative jerk value indicates a sudden application of brakes, which could be an evasive maneuver because of poor geometric consistency or possible conflict. This jerk value is further compared with the threshold value
to estimate negative jerk events. The percentage of observations in the driving data of driver
along segment
with
value higher than the threshold value is the percentage of jerk events for driver
along segment
, represented as
. Percentage of jerk events
for driver
along segment
can be computed as:
where is the number of jerk events,
is the total number of observations,
is the change in acceleration between successive observations, and
is the change in the time between successive observations. A threshold value indicates whether the change in acceleration between successive observations is severe enough to be qualified as a jerk event. The threshold value is estimated generally through sensitivity analysis by comparing it with crash data. Literature suggests that jerk values below −0.6
indicate jerk events (Pande et al. Citation2017). It may be noted that the present study considers only braking behavior for the identification of jerk events.
Data collection and extraction
Field driving data is used for the study as it provides accurate and detailed information regarding driver behavior leading to a precise estimation of driving performance measures. The details of the selected study section, participants, and experimental procedure followed for data collection are described below.
Study section
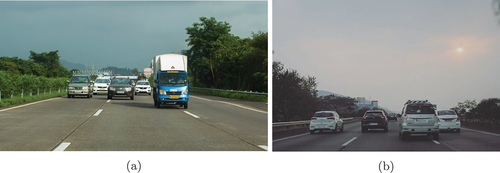
A 94-km-long Mumbai-Pune Expressway connecting two cities in India (Mumbai and Pune) was chosen as the study section because of its diverse geometric elements (with curves, up and down-gradients, and plane sections) and long undisturbed length of 188 km in both directions. The study section comprises two toll plazas, six tunnels, and a few exits. The layout of the study section with the position of tunnels and tolls is shown in .
Figure 4. The 94 km long study section from Mumbai (A) to Pune (B) (Charly and Mathew Citation2019b).
The traffic along the section is composed of passenger cars (83%), trucks (14%), and buses (3%), which exhibit considerable lateral swerving behavior and frequent lane changes (Charly and Mathew Citation2019b). The speed limit along the study section is 80 kmph, except at a few locations where it is 30 kmph due to sharp curves with a steep gradient.
Crash data on study section
Historic crash data from the study section were available for three and a half years and consisted of detailed information on the time and location of the crash, the type of vehicles involved, and a brief note on the cause of the crash (JP Research Citation2014). This data was obtained from JP Research Pvt Ltd, a research organization that collects detailed crash data along Mumbai–Pune Expressway. The crash data was segregated into daytime (06:00 h to 22:00 h) and nighttime (22:00 h to 06:00 h) to see if there was a considerable difference in the factors that caused the crash based on the time of the day. The basis for this segregation is from a study conducted by Bella, Calvi, and D’Amico (Citation2014). Based on the crash information, the percentage of crashes and cause of the crash were plotted, as shown in .
Figure 5. Crash influencing factors during daytime and nighttime.
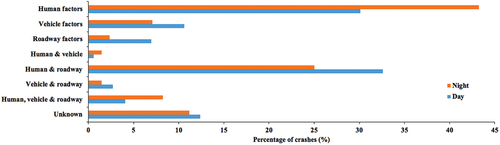
The cause of the crash was categorized into human factors, vehicle factors, roadway or environmental factors, and a combination of these. It was observed that most of the crashes on the expressway occurred due to human factors followed by human & roadway factors. Vehicle factors and human, vehicle & roadway factors were the next leading cause of crashes. It was also observed that the influence of human factors on crash occurrence is greater during nighttime. During the daytime, the major influencing factor seemed to be human and roadway factors.
A detailed investigation into crash causes revealed that the major human factors responsible for the crash were driver falling asleep, overspeeding, lane encroachment, errors in judgment while overtaking and abrupt braking or slowing down on the expressway. Tyre-burst and brake-failure were the primary vehicle-related factors that led to crashes. It was also observed that vehicles tend to lose control while navigating curves compared to straight road sections. Existing literature shows that the effect of these crash influential factors on driving quality can be successfully measured by driving performance measures.
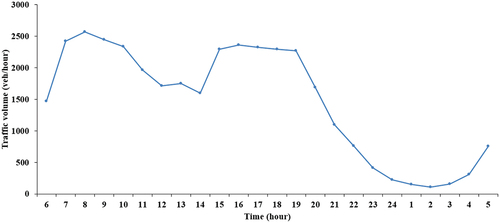
Further, the hourly traffic volume along the study section was examined (). This data was obtained from the Rail India Technical and Economic Service (RITES) Limited. It can be seen that the traffic volume along the study section was less during nighttime than during daytime. However, several crashes occurred during the night. This shows that factors including driving performance and time of day influence crash occurrence in addition to the commonly considered exposure variables, such as traffic volume.
Figure 6. Hourly traffic volume along the study section.
Segmentation of study section
Further, it was necessary to divide the study section into segments for spatial analysis. A segment length of 1 km was chosen to match the existing segmentation, thus leading to 188 segments. Historic crash data were available corresponding to these segments (JP Research Citation2014). The road segments were then classified based on their gradient and the radius of turn (Ahmed et al. Citation2011; Charly and Mathew Citation2019b; IRC Citation2013; Jacob and Anjaneyulu Citation2013; Misaghi and Hassan Citation2005). A reasonable assumption has been made regarding the homogeneity of segments in each category. If the radius of turn is less than 400 m, the segment is considered to be Curved. Otherwise, it is considered to be Gentle-Curve. The gradient is divided into three categories, namely Downgrade (if the gradient is less than −2%), Flat (if the gradient is greater than −2% and less than +2%), and Upgrade (if the gradient is greater than +2%). Thus, six road categories have been defined considering the radius of turn and gradient. These are as follows: Curved-Downgrade (CD), Curved-Flat (CF), Curved-Upgrade (CU), Gentle-Curve-Downgrade (GCD), Gentle-Curve-Flat (GCF), and Gentle-Curve-Upgrade (GCU) (Charly and Mathew Citation2019b).
Participants and experimental driving environment
The details of participants involved in data collection and the experimental driving environment are described in this section. Participants were randomly selected while ensuring a mix of professional and nonprofessional drivers. Professional drivers considered in the study belonged to two major car-rental companies near the study location and were sent randomly from the company. Nonprofessional drivers were research scholars and staff from the university.
Twenty-two male drivers aged 25–57 years (Mean = 39.5, Standard deviation = 8.6) participated in the study. Drivers are divided into three categories based on their age: young (age 30), mid-age (30
age
50) and seniors (age
50) (Choudhary and Velaga Citation2017b). The majority of the participants were mid-age drivers (73%), followed by an equal share of young (14%) and senior drivers (14%). Of the participants, 68% were professional drivers, and 32% were nonprofessional drivers. The study was conducted using passenger cars. About 68% of data was collected on Sedans, 14% on hatchbacks, and 18% on SUVs. Data were collected during daytime and nighttime to understand the effect of time of day on driving performance. Of the total data, 55% was collected during daytime and 45% during nighttime. The experimental setup and data extraction are described in the following section.
Experimental setup and data collection
Field driving data, collected using instrumented vehicles, is utilized for identifying risky driving behavior. Video VBox, which records kinematic data at an accuracy of 20 Hz, was used for collecting field driving data (Racelogic Ltd., Citation2018). The device was set up in the vehicle, and the drivers were asked to drive usually. The device was installed 38 km before the start of the study section to alleviate any bias that may have happened due to the instruments presence. show the movement of surrounding vehicles during data collection.
Figure 7. View of study section from the (a) rear and (b) front of the subject vehicle during data collection.
Data extraction and preparation
Details of data collected are shown in .
Figure 8. Details of the data collected using Video VBox.
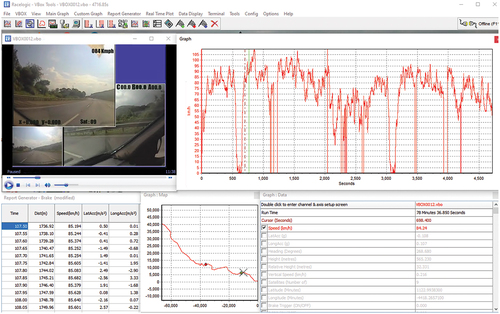
Clockwise from the top-left, shows the view of cameras installed, speed profile, list of data collected, location of the subject vehicle on the map, and detailed data collected at 20 Hz frequency. Driving data was collected on 22 drivers for 188 km leading to 4136 vehicle-km of data. The driving data was further extracted, and a few attributes were added to the driving data, including a driver identification number, time of data collection and corresponding segment information. Driving data closer to the tolls and tunnels was omitted from the analysis. The data extracted from the field driving profile is further processed according to the methodology discussed in the previous section to derive the driving performance measures. This was done with the help of an algorithm coded in C++ programming language. The driving data collected from the field, information on the drivers’ personal characteristics and road segmentation were used as input files to the algorithm. The processed driving performance measures were then aggregated for each segment or each driver as required for further analysis.
Analysis and results
The computed driving performance measures are compared with the driver characteristics, historical crash data, road geometry, and time of day to understand the influence of each of these factors on driving performance and, subsequently, road safety. A crash frequency model is developed to identify the driving performance measures which best represent risky driving behavior.
Comparison of driving performance measures with driver characteristics
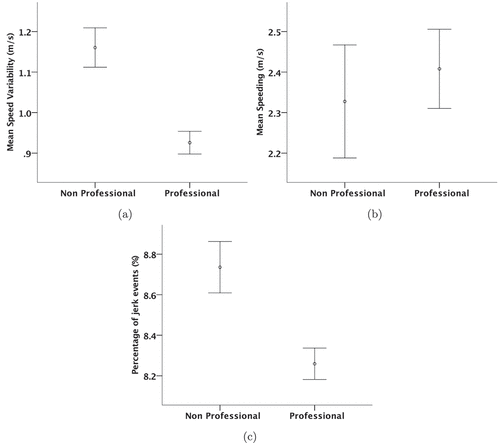
To understand the influence of driver characteristics on driving performance, the estimated driving performance measures, averaged for each driver on each segment, are compared with the drivers’ age and profession ().
Figure 9. Comparison of driving performance measures for drivers of different age groups (error bars denote standard error).
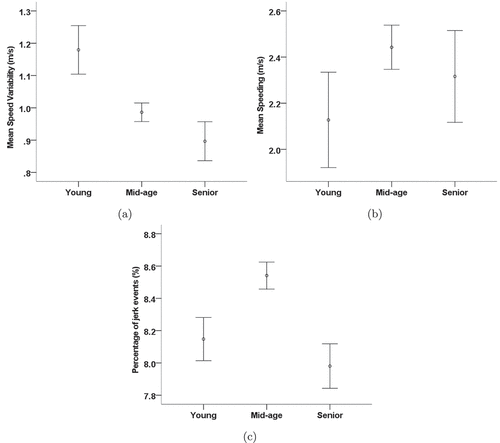
Figure 10. Comparison of driving performance measures for professional and nonprofessional drivers (error bars denote standard error).
It can be observed that high speed variability is exhibited among young drivers, followed by mid-age and senior drivers (). However, mid-age drivers showed high speeding as compared to other driver categories (). The percentage of jerk events is also observed to be higher for drivers in the mid-age group (). Thus, it can be seen that, though the young drivers show high variation in speed, they do not overstep the speed limit and do not experience jerk events as frequently as the mid-aged drivers. This could be because the younger drivers changed their speed gradually and hence do not experience as many jerk events.
Further, the driving performance measures for both professional and nonprofessional drivers are plotted (). It is observed that nonprofessional drivers exhibit high speed variability and high percentage of jerk events compared to professional drivers . However, speeding values are found to be higher for professional drivers (). Hence, one may infer that professional drivers are in better control of their vehicles than nonprofessional drivers as they experience less variation in speed and less frequent jerk events.
It may be noted that a large share of mid-age and senior drivers were also professional drivers who are experienced, confident, and often drive long distances. Hence, they could be comfortable navigating the vehicles at higher speeds with lower speed variability. However, this does not indicate they are safer drivers. Their familiarity with the study section could be another reason for this difference in behavior. This also conforms with previous studies, which revealed that mid-experienced drivers were likelier to take risks than the less experienced drivers, and professional drivers had a higher probability of rule violation (Choudhari and Maji Citation2019; Wu, Yan, and Radwan Citation2016).
These results indicate that the driver characteristics influence the driving performance measures. Hence, these factors could be incorporated into collision avoidance systems for improved safety.
Comparison of driving performance measures with crash data
A comparison between each driving performance measure and historical crashes is made to understand the relation between these measures and crashes. First, speed variability and historical crashes are compared with each other for every segment ().
Figure 11. Scatterplots of driving performance measures and crashes for each road segment.
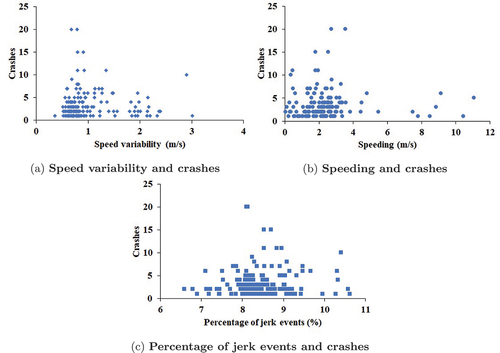
It can be seen that speed variability between around 0.5 m/s and 1.5 m/s corresponds to more crashes than higher values of speed variability. Speeding for every segment is compared with crash data in . Segments with values of speeding between 2 m/s and 4 m/s correspond to high crashes. The percentage of jerk events in every segment is compared with crash data as shown in . The percentage of jerk events is increasing with the increasing number of crashes. These results show that all three driving performance measures can potentially represent unsafe driving behavior.
Comparison of driving performance measures with geometry
Driving performance measures were further aggregated for each road category to assess the impact of road geometry on driving performance measures. Six road categories have been defined; namely, Curved-Downgrade (CD), Curved-Flat (CF), Curved-Upgrade (CU), Gentle-Curve-Downgrade (GCD), Gentle-Curve-Flat (GCF), and Gentle-Curve-Upgrade (GCU) as discussed previously. The driving performance measures, aggregated for each road category, and the corresponding number of crashes per segment are shown in . It can be seen that a high value of crashes per segment also corresponds to a high percentage of jerk events and high speeding. It is also observed that road categories, including Curved-Upgrade (CU), Curved-Flat (CF), and Curved-Downgrade (CD), correspond to a high percentage of jerk events, high speeding, and high speed variability. All these road categories have high curvature.
Table 2. Driving performance measures and crashes per segment for different road categories.
Higher values of speed variability occur in curved road segments with maximum on Curved-Upgrade (CU) road category. Higher speeding values are observed in curved road segments with the highest value on Curved-Flat (CF) road category. A higher percentage of jerk events also occurs in curved road segments with a maximum along Curved Upgrade (CU) road category. Higher values of these performance measures correspond to unsafe road segments, and hence, one may deduce that the driving behavior followed in these curved sections is highly unsafe. These results indicate that geometric characteristics influence the driving performance measures. Hence, these factors must be incorporated into collision avoidance systems to identify risky driving. Further, the next section compares the driving performance measures with the time of day.
Comparison of driving performance measures during daytime and nighttime
The driving performance measures for each road category are further segregated based on the time of data collection to study the influence of time of the day on driving performance, as shown graphically in . It can be seen that the percentage of jerk events is generally higher during nighttime for all road categories. However, for all road categories, speeding is more heightened during the daytime.
Figure 12. Average driving performance measures for different road categories during the day and night.
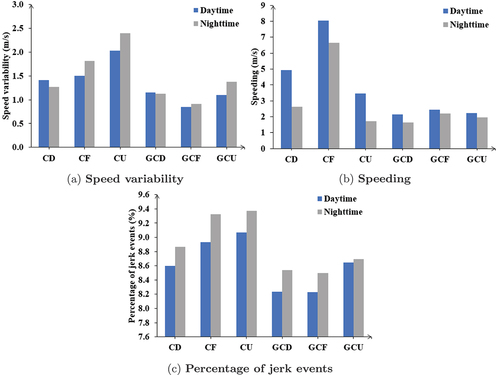
Speed variability during nighttime is higher than during daytime for road categories with a flat gradient or up-gradient, as seen in . In road categories with down-gradient, speed variability during the daytime is marginally higher than at night. Furthermore, it is observed that speeding values are much higher during the day than at nighttime (). This implies that drivers travel at higher speeds during the daytime, especially along road categories with a high degree of curvature. There is not much difference between speeding values during daytime and nighttime on roads with gentle curves. The percentage of jerk events is consistently high in all road categories during the night (). This could be because nighttime driving requires more cautious effort on the drivers part, causing them to apply brakes more often out of the usual driving style.
To further understand the influence of driving performance measures on crash occurrence, a statistical model needs to be developed to estimate crash frequencies based on these measures. This has been discussed in the following section.
Crash frequency model
The three driving performance measures, namely, speed variability, speeding, and percentage of jerk events, were considered independent variables in the study, along with geometric characteristics of the road. The time of the day is a categorical independent variable. The dependent variable in the study is the number of crashes. Since crashes occur for a combination of reasons, it is essential to scrutinize roadway, environmental, and human factors. There are 376 data points, each corresponding to a road segment during daytime or nighttime. The descriptive statistics of the independent variables, such as minimum value, maximum value, mean, and standard deviation, are shown in . It can be observed that speed variability values have peaked at 3.57 at a particular instance, which indicates a highly unsafe situation. Similarly, a speeding of 11.61
means a highly critical event. The variables were further checked for collinearity, and only non-collinear variables were included in the study.
Table 3. Variables considered in crash frequency modeling.
A negative binomial model is proposed between crashes and the identified performance measures as it is used for modeling count data, and it takes care of over-dispersion (Pande et al. Citation2017). Those variables, which were significant at a 90% confidence level, were retained in the model. The parameter estimates of the final model are shown in . The Akaike Information Criterion (AIC) value, which measures the model fit, has been reported. Also, the dispersion parameter, which indicates the suitability of the chosen model, has been reported. Of the several independent variables, only speeding, percentage of jerk events, mean gradient, and the categorical variable time of the day are significant in estimating crashes. The results show that the higher the speeding, the more crashes. Results indicate that road stretches where drivers tend to speed beyond the speed limit lead to increased crashes.
Table 4. Crash frequency model results.
Crashes also seem to increase with the percentage of jerk events. The percentage of jerk events indicates all instances when the vehicle had to apply sudden brakes forcefully. Using sudden brakes shows an evasive maneuver either because the driver encountered a conflict or because the road alignment is unsafe and requires the driver to apply sudden braking. The model results also show that a decrease in gradient corresponds to increased crashes. Thus, one may infer that road segments with down-gradient are more prone to crashes than other road segments. The results from the study indicate that the driving performance measures, namely, speeding and percentage of jerk events, significantly influence the occurrence of a crash. Hence, these measures could represent variation in driving behavior which could further lead to the successful prediction of crashes caused due to human factors.
Discussion
The results show that younger and nonprofessional drivers exhibit high-speed variability compared to other driver categories. However, professional drivers were found to travel at speeds higher than the speed limits. These results indicate that the difference in driver characteristics, including age and experience, influences driving performance. One may infer that experienced drivers are in better control of their vehicles, even at higher speeds, since their speed variability is less. This finding aligns with past research suggesting that professional drivers with high driving experience had lower crash rates (Choudhari and Maji Citation2019; Wu, Yan, and Radwan Citation2016). However, subsequent crash frequency modeling results indicate that speed variability was not statistically significant in estimating crashes.
Speeding was consistently higher during the daytime than at nighttime, whereas the percentage of jerk events was consistently higher during the night. This reiterates the difference in driving behavior depending on the time of the day. Results from the crash frequency model showed that both speeding and the percentage of jerk events significantly represented safety. This finding is consistent with previous research showing that speeding and hard braking, or sharp decelerations, are critical in representing safety (Alrassy, Smyth, and Jang Citation2023; Guo et al. Citation2022).
Previous studies have mainly used phone interviews and questionnaire methods to understand risky driving behavior and its relationship to historic crash or near-crash data (Love et al. Citation2022, Citation2022; Yu, Qu, and Ge Citation2022; Lazuras et al. Citation2022). However, identifying risky driving behavior using driving performance measures provides an opportunity to utilize this knowledge to alert drivers and avoid crashes. Existing studies using driving performance measures have mostly been done in simulated driving conditions. Only a few studies have used actual field-collected data, especially in developing countries such as India.
This work uses some of the existing driving performance measures and computes them over an accumulated period from an in-vehicle data collection device to more accurately evaluate the variation in driving behavior. The significant contribution of this study is to identify risky driving by examining the continuous driving profile obtained from an in-vehicle data collection device. These driving performance measures are computed over an accumulated time to accurately represent risky driving behavior compared to instantaneous measurements typically used in such studies. These measures are then validated against actual historical crash data, which is not done in many studies.
The driving performance measures discussed in this paper find application in collision avoidance systems where the driving data is collected continuously in real-time to assess a driver’s performance and prevent crashes in real-time (Cai et al. Citation2020; Guo et al. Citation2022, 23; Toledo and Lotan Citation2006). Such factors also find application in identifying road segments highly prone to unsafe driving behavior, testing the effectiveness of implemented safety countermeasures used before and after studies, and guiding policymakers and enforcement personnel.
Conclusions
This study presents a methodology for identifying risky driving behavior using performance measures. This approach aims to incorporate human factors into road safety evaluation. The proposed method is based on the hypothesis that risky driving behavior can be estimated by analyzing the variation in driving profile. Field driving data is used in the study to calculate the performance measures precisely. Driving performance measures, including speed variability, speeding, and percentage of jerk events, are computed using driving data collected from a sample set of drivers along an expressway using instrumented vehicles. These measures are calculated by analyzing the driving profile for a certain period and thus represent the variation in driving behavior. These driving performance measures were further compared with historical crash data to assess the relationship between variation in driving behavior and historical crashes on a road segment.
Results indicate that driver characteristics and road geometry influence the driving performance measures. Results show that speeding and the percentage of jerk events positively correlate with crash data. Speed variability does not seem to correlate with crashes directly, but it is observed that the variation in speed is low at high speeding. Hence, instances where both speeding and speed variability are high are unsafe and could lead to a crash. The results of the crash frequency modeling show that speeding, percentage of jerk events, and mean gradient are highly significant in estimating crashes along a road segment. Thus, the study establishes driving performance measures, namely, speeding and percentage of jerk events in identifying risky driving behavior.
The driving performance measures considered in this study could be used in collision avoidance systems to warn drivers of an upcoming event. In a connected vehicle environment, these performance measures can identify risky behavior and alert the other road users and the infrastructure to avoid crashes. These warning systems could also consider the driver characteristics and road geometry since these influence the driving performance measures. The methodology used in the study could be adopted to assess the design quality of existing roads and identify the sections which need improvement. The effectiveness of any safety measure may be tested by following a similar approach of traversing the road stretch with an instrumented vehicle before and after adopting the countermeasures and analyzing the driving performance measures. This methodology could also guide policymakers to adjust the speed limits along any particular road stretch. These measures indicate the safety of an individual vehicle-driver unit and can represent single-vehicle crashes due to abnormal driving behavior. It can also represent possible two-vehicle crashes where the crash might be triggered by risky driving behavior exhibited by the subject vehicle.
This study uses field driving data from passenger cars alone. It does not include the difference in vehicle characteristics based on the passenger car type, which is a study limitation. Field study can be extended to other vehicle types with different dynamic characteristics, likely influencing the driving performance measures. Also, historical crash data for 3 years is used for comparison under the assumption that the traffic conditions remain the same throughout. Further, the study uses three selected measures based on speed and acceleration to represent driving performance. This was done based on the consideration that these can be computed by economical devices offering a more straightforward field implementation. However, considering advanced performance measures could lead to further improvement in the safety assessment.
Acknowledgments
The authors thank JP Research India Pvt. Ltd. for providing the necessary crash data for the study. The authors also thank Mr Sam Santhosh for assisting in field data collection. The authors thank the Department of Civil Engineering at the Indian Institute of Technology Bombay for providing the funding necessary for field data collection.
Disclosure statement
No potential conflict of interest was reported by the author(s).
References
- National Research Council (US). 2010. Highway Safety Manual. 1 ed. Washington D.C, USA: American Association of State Highway and Transportation Officials (AASHTO).
- Abd Rahman, N. I., S. Z. Md Dawal, and N. Yusoff. 2020. “Driving Mental Workload and Performance of Ageing Drivers.” Transportation Research Part F, Traffic Psychology and Behaviour 69:265–285. https://doi.org/10.1016/j.trf.2020.01.019.
- Af Wahlberg, A. 2000. “The Relation of Acceleration Force to Traffic Accident Frequency: A Pilot Study.” Transportation Research Part F 3 (1): 29–38. https://doi.org/10.1016/S1369-8478(00)00012-7.
- Ahmed, M., H. Huang, M. Abdel-Aty, and B. Guevara. 2011. “Exploring a Bayesian Hierarchical Approach for Developing Safety Performance Functions for a Mountainous Freeway.” Accident Analysis & Prevention 43:1581–1589. https://doi.org/10.1016/j.aap.2011.03.021.
- Albert, D. A., M. C. Ouimet, J. Jarret, M. S. Cloutier, M. Paquette, N. Badeau, and T. G. Brown. 2018. “Linking Mind Wandering Tendency to Risky Driving in Young Male Drivers.” Accident Analysis & Prevention 111:125–132. https://doi.org/10.1016/j.aap.2017.11.019.
- Alrassy, P., A. W. Smyth, and J. Jang. 2023. “Driver Behavior Indices from Large-Scale Fleet Telematics Data as Surrogate Safety Measures.” Accident Analysis & Prevention 179:106879. https://doi.org/10.1016/j.aap.2022.106879.
- Arbabzadeh, N., and M. Jafari. 2018. “A Data-Driven Approach for Driving Safety Risk Prediction Using Driver Behavior and Roadway Information Data.” IEEE Transactions on Intelligent Transportation Systems 19:446–460. https://doi.org/10.1109/TITS.2017.2700869.
- Arvin, R., M. Kamrani, and A. J. Khattak. 2019. “The Role of Pre-Crash Driving Instability in Contributing to Crash Intensity Using Naturalistic Driving Data.” Accident Analysis & Prevention 132:105226. https://doi.org/10.1016/j.aap.2019.07.002.
- Bagdadi, O. 2013. “Assessing Safety Critical Braking Events in Naturalistic Driving Studies.” Transportation Research Part F, Traffic Psychology and Behaviour 16:117–126. https://doi.org/10.1016/j.trf.2012.08.006.
- Bagdadi, O., and A. Várhelyi. 2011. “Jerky Driving—An Indicator of Accident Proneness?” Accident Analysis & Prevention 43 (4): 1359–1363. https://doi.org/10.1016/j.aap.2011.02.009.
- Bartrim, K., B. McCarthy, D. McCartney, G. Grant, B. Desbrow, and C. Irwin. 2020. “Three Consecutive Nights of Sleep Loss: Effects of Morning Caffeine Consumption on Subjective Sleepiness/Alertness, Reaction Time and Simulated Driving Performance.” Transportation Research Part F, Traffic Psychology and Behaviour 70:124–134. https://doi.org/10.1016/j.trf.2020.02.017.
- Behbahani, H., N. Nadimi, and S. S. Naseralavi. 2015. “New Time-Based Surrogate Safety Measure to Assess Crash Risk in Car-Following Scenarios.” Transportation Letters: The International Journal of Transportation Research 7:229–238. https://doi.org/10.1179/1942787514Y.0000000051.
- Bella, F., A. Calvi, and F. D’Amico. 2014. “Analysis of Driver Speeds Under Night Driving Conditions Using a Driving Simulator.” Journal of Safety Research 49:45–52. https://doi.org/10.1016/j.jsr.2014.02.007.
- Cafiso, S., and G. Cava. 2009. “Driving Performance, Alignment Consistency, and Road Safety.” Transportation Research Record: Journal of the Transportation Research Board 2102:1–8. https://doi.org/10.3141/2102-01.
- Cafiso, S., A. Di Graziano, G. Di Silvestro, G. La Cava, and B. Persaud. 2010. “Development of Comprehensive Accident Models for Two-Lane Rural Highways Using Exposure, Geometry, Consistency and Context Variables.” Accident Analysis & Prevention 42:1072–1079. https://doi.org/10.1016/j.aap.2009.12.015.
- Cai, Q., M. Abdel-Aty, J. Yuan, J. Lee, and Y. Wu. 2020. “Real-Time Crash Prediction on Expressways Using Deep Generative Models.” Transportation Research Part C: Emerging Technologies 117:102697. https://doi.org/10.1016/j.trc.2020.102697.
- Calvi, A., F. D’Amico, C. Ferrante, and L. Bianchini Ciampoli. 2020. “A Driving Simulator Study to Assess Driver Performance During a Car-Following Maneuver After Switching from Automated Control to Manual Control.” Transportation Research Part F, Traffic Psychology and Behaviour 70:58–67. https://doi.org/10.1016/j.trf.2020.02.014.
- Campbell, K. L. 2012. “The SHRP 2 Naturalistic Driving Study.” TR News 282: Blueprints to Improve Highway Safety, Transportation Research Board of the National Academies. Accessed July 10 2022. https://onlinepubs.trb.org/onlinepubs/trnews/trnews282shrp2nds.pdf.
- Caponecchia, C., and A. Williamson. 2018. “Drowsiness and Driving Performance on Commuter Trips.” Journal of Safety Research 66:179–186. https://doi.org/10.1016/j.jsr.2018.07.003.
- Casutt, G., M. Martin, M. Keller, and L. Jäncke. 2014. “The Relation Between Performance in On-Road Driving, Cognitive Screening and Driving Simulator in Older Healthy Drivers.” Transportation Research Part F, Traffic Psychology and Behaviour 22:232–244. https://doi.org/10.1016/j.trf.2013.12.007.
- Chang, S. H., C. Y. Lin, C. C. Hsu, C. P. Fung, and J. R. Hwang. 2009. “The Effect of a Collision Warning System on the Driving Performance of Young Drivers at Intersections.” Transportation Research Part F, Traffic Psychology and Behaviour 12:371–380. https://doi.org/10.1016/j.trf.2009.05.001.
- Charly, A., and T. V. Mathew. 2019a. “Estimation of Traffic Conflicts Using Precise Lateral Position and Width of Vehicles for Safety Assessment.” Accident Analysis & Prevention 132:105264. https://doi.org/10.1016/j.aap.2019.105264.
- Charly, A., and T. V. Mathew. 2019b. “Evaluation of Driving Performance in Relation to Safety on an Expressway Using Field Driving Data.” Transportation Letters 12 (5): 340–348. https://doi.org/10.1080/19427867.2019.1591075.
- Chauhan, R., A. Dhamaniya, and S. Arkatkar. 2022. “Challenges in Rear-End Conflict-Based Safety Assessment of Highly Disordered Traffic Conditions.” Transportation Research Record: Journal of the Transportation Research Board 2677 (2): 624–634. https://doi.org/10.1177/03611981221108156.
- Chin, H. C., and S. T. Quek. 1997. “Measurement of Traffic Conflicts.” Safety Science 26:169–185. https://doi.org/10.1016/S0925-7535(97)00041-6.
- Choudhari, T., and A. Maji. 2019. “Socio-Demographic and Experience Factors Affecting drivers’ Runoff Risk Along Horizontal Curves of Two-Lane Rural Highway.” Journal of Safety Research 71:1–11. https://doi.org/10.1016/j.jsr.2019.09.013.
- Choudhary, P., M. Imprialou, N. R. Velaga, and A. Choudhary. 2018. “Impacts of Speed Variations on Freeway Crashes by Severity and Vehicle Type.” Accident Analysis & Prevention 121:213–222. https://doi.org/10.1016/j.aap.2018.09.015.
- Choudhary, P., and N. R. Velaga. 2017a. “Analysis of Vehicle-Based Lateral Performance Measures During Distracted Driving Due to Phone Use.” Transportation Research Part F: Psychology and Behaviour 44:120–133. https://doi.org/10.1016/j.trf.2016.11.002.
- Choudhary, P., and N. R. Velaga. 2017b. “Mobile Phone Use During Driving: Effects on Speed and Effectiveness of Driver Compensatory Behaviour.” Accident Analysis & Prevention 106:370–378. https://doi.org/10.1016/j.aap.2017.06.021.
- Choudhary, P., and N. R. Velaga. 2019. “Effects of Phone Use on Driving Performance: A Comparative Analysis of Young and Professional Drivers.” Safety Science 111:179–187. https://doi.org/10.1016/j.ssci.2018.07.009.
- Crisler, M., J. Brooks, J. Ogle, C. Guirl, P. Alluri, and K. Dixon. 2008. “Effect of Wireless Communication and Entertainment Devices on Simulated Driving Performance.” Transportation Research Record: Journal of the Transportation Research Board 2069:48–54. https://doi.org/10.3141/2069-07.
- Dogan, E., V. Honnêt, S. Masfrand, and A. Guillaume. 2019. “Effects of Non-Driving-Related Tasks on Takeover Performance in Different Takeover Situations in Conditionally Automated Driving.” Transportation Research Part F, Traffic Psychology and Behaviour 62:494–504. https://doi.org/10.1016/j.trf.2019.02.010.
- Guo, M., X. Zhao, Y. Yao, C. Bi, and Y. Su. 2022. “Application of Risky Driving Behavior in Crash Detection and Analysis.” Physica A Statistical Mechanics & Its Applications 591:126808. https://doi.org/10.1016/j.physa.2021.126808.
- Gupta, A., P. Choudhary, and M. Parida. 2021. “Understanding and Modelling Risky Driving Behaviour on High-Speed Corridors.” Transportation Research Part F, Traffic Psychology and Behaviour 82:359–377. https://doi.org/10.1016/j.trf.2021.09.009.
- Hallmark, S. L., S. Tyner, N. Oneyear, C. Carney, and D. McGehee. 2015. “Evaluation of Driving Behavior on Rural 2-Lane Curves Using the SHRP 2 Naturalistic Driving Study Data.” Journal of Safety Research 54:17.e1–27. https://doi.org/10.1016/j.jsr.2015.06.017.
- IRC 2013. “IRC: SP: 99-2013: Manual of Specifications and Standards for Expressways.”
- Jacob, A., and M. V. L. R. Anjaneyulu. 2013. “Operating Speed of Different Classes of Vehicles at Horizontal Curves on Two-Lane Rural Highways.” Journal of Transportation Engineering 139:287–294. https://doi.org/10.1061/(ASCE)TE.1943-5436.0000503.
- JP Research 2014. Mumbai Pune Expressway Road Accident Study. Technical Report JP Research India Pvt. Ltd, Pune, India.
- Knapper, A. S., M. P. Hagenzieker, and K. A. Brookhuis. 2015. “Do In-Car Devices Affect Experienced Users’ Driving Performance?” IATSS Research 39 (1): 72–78. https://doi.org/10.1016/j.iatssr.2014.10.002.
- Kononov, J., B. Bailey, and B. K. Allery. 2008. “Exploratory Examination of the Functional Form of Safety Performance Functions of Urban Freeways.“ Transportation Research Board Annual Meeting, January 2008, Transportation Research Board, Washington DC, 1–19. https://citeseerx.ist.psu.edu/document?repid=rep1&type=pdf&doi=4bd119782d3581c721259a77d9c426c134fc22be.
- Kuang, Y., X. Qu, and S. Wang. 2015. “A Tree-Structured Crash Surrogate Measure for Freeways.” Accident Analysis & Prevention 77:137–148. https://doi.org/10.1016/j.aap.2015.02.007.
- Lazuras, L., R. Rowe, A. Ypsilanti, I. Smythe, D. Poulter, and J. Reidy. 2022. “Driving Self-Regulation and Risky Driving Outcomes.” Transportation Research Part F, Traffic Psychology and Behaviour 91:461–471. https://doi.org/10.1016/j.trf.2022.10.027.
- Li, Y. C., N. N. Sze, S. C. Wong, W. Yan, K. L. Tsui, and F. L. So. 2016. “A Simulation Study of the Effects of Alcohol on Driving Performance in a Chinese Population.” Accident Analysis & Prevention 95:334–342. https://doi.org/10.1016/j.aap.2016.01.010.
- Love, S., L. Kannis-Dymand, J. Davey, and J. Freeman. 2022. “Risky Driving and Lapses on the Road: An Exploration on Self-Regulatory Dysfunction in Australian Drivers.” Transportation Research Part F, Traffic Psychology and Behaviour 88:25–36. https://doi.org/10.1016/j.trf.2022.05.006.
- Love, S., V. Truelove, B. Rowland, L. Kannis-Dymand, and J. Davey. 2022. “Is All High-Risk Behaviour Premeditated? A Qualitative Exploratory Approach to the Self-Regulation of Habitual and Risky Driving Behaviours.” Transportation Research Part F, Traffic Psychology and Behaviour 90:312–325. https://doi.org/10.1016/j.trf.2022.09.002.
- Lu, J., O. Grembek, and M. Hansen. 2022. “Learning the Representation of Surrogate Safety Measures to Identify Traffic Conflict.” Accident Analysis & Prevention 174:106755. https://doi.org/10.1016/j.aap.2022.106755.
- Lu, C., X. He, H. van Lint, H. Tu, R. Happee, and M. Wang. 2021. “Performance Evaluation of Surrogate Measures of Safety with Naturalistic Driving Data.” Accident Analysis & Prevention 162:106403. https://doi.org/10.1016/j.aap.2021.106403.
- Luk, J. W., R. S. Trim, K. A. Karyadi, I. Curry, C. J. Hopfer, J. K. Hewitt, M. C. Stallings, S. A. Brown, and T. L. Wall. 2017. “Unique and Interactive Effects of Impulsivity Facets on Reckless Driving and Driving Under the Influence in a High-Risk Young Adult Sample.” Personality & Individual Differences 114:42–47. https://doi.org/10.1016/j.paid.2017.03.048.
- Lyu, N., C. Deng, L. Xie, C. Wu, and Z. Duan. 2019. “A Field Operational Test in China: Exploring the Effect of an Advanced Driver Assistance System on Driving Performance and Braking Behavior.” Transportation Research Part F, Traffic Psychology and Behaviour 65:730–747. https://doi.org/10.1016/j.trf.2018.01.003.
- Matthews, R. W., S. A. Ferguson, X. Zhou, A. Kosmadopoulos, D. J. Kennaway, and G. D. Roach. 2012. “Simulated Driving Under the Influence of Extended Wake, Time of Day and Sleep Restriction.” Accident Analysis & Prevention 45:55–61. https://doi.org/10.1016/j.aap.2011.09.027.
- Merat, N., F. Lai, and S. L. Jamson. 2011. “The Comparative Merits of Expert Observation, Subjective and Objective Data in Determining the Effects of In-Vehicle Information Systems on Driving Performance.” Safety Science 49:172–177. https://doi.org/10.1016/j.ssci.2010.07.005.
- Misaghi, P., and Y. Hassan. 2005. “Modeling Operating Speed and Speed Differential on Two-Lane Rural Roads.” Journal of Transportation Engineering 131:408–418. https://doi.org/10.1061/(ASCE)0733-947X(2005)131:6(408).
- Moreno, A. T., and A. García. 2013. “Use of Speed Profile as Surrogate Measure: Effect of Traffic Calming Devices on Crosstown Road Safety Performance.” Accident Analysis & Prevention 61:23–32. https://doi.org/10.1016/j.aap.2012.10.013.
- Mullakkal-Babu, F. A., M. Wang, H. Farah, B. van Arem, and R. Happee. 2017. “Comparative Assessment of Safety Indicators for Vehicle Trajectories on Highways.” Transportation Research Record 2659 (1): 127–136. https://doi.org/10.3141/2659-14.
- Pande, A., S. Chand, N. Saxena, V. Dixit, J. Loy, B. Wolshon, and J. D. Kent. 2017. “A Preliminary Investigation of the Relationships Between Historical Crash and Naturalistic Driving.” Accident Analysis & Prevention 101:107–116. https://doi.org/10.1016/j.aap.2017.01.023.
- Papadakaki, M., G. Tzamalouka, C. Gnardellis, T. J. Lajunen, and J. Chliaoutakis. 2016. “Driving Performance While Using a Mobile Phone: A Simulation Study of Greek Professional Drivers.” Transportation Research Part F, Traffic Psychology and Behaviour 38:164–170. https://doi.org/10.1016/j.trf.2016.02.006.
- Paredes, J. J., S. F. Yepes, R. Salazar-Cabrera, Á. Pachón de la Cruz, and J. M. Madrid Molina. 2022. “Intelligent Collision Risk Detection in Medium-Sized Cities of Developing Countries, Using Naturalistic Driving: A Review.” Journal of Traffic & Transportation Engineering 9 (6): 912–929. https://doi.org/10.1016/j.jtte.2022.07.003.
- Pavlou, D., I. Beratis, E. Papadimitriou, C. Antoniou, G. Yannis, and S. Papageorgiou. 2016. “Which are the Critical Measures to Assess the Driving Performance of Drivers with Brain Pathologies?” Transportation Research Procedia 14:4393–4402. https://doi.org/10.1016/j.trpro.2016.05.361.
- Pawar, N. M., R. K. Khanuja, P. Choudhary, and N. R. Velaga. 2020. “Modelling Braking Behaviour and Accident Probability of Drivers Under Increasing Time Pressure Conditions.” Accident Analysis & Prevention 136:105401. https://doi.org/10.1016/j.aap.2019.105401.
- Pawar, N. M., and N. R. Velaga. 2021. “Investigating the Influence of Time Pressure on Overtaking Maneuvers and Crash Risk.” Transportation Research Part F, Traffic Psychology and Behaviour 82:268–284. https://doi.org/10.1016/j.trf.2021.08.017.
- Polus, A., and C. Mattar-Habib. 2004. “New Consistency Model for Rural Highways and Its Relationship to Safety.” Journal of Transportation Engineering 130:286–293. https://doi.org/10.1061/(ASCE)0733-947X(2004)130:3(286).
- Precht, L., A. Keinath, and J. F. Krems. 2017. “Effects of Driving Anger on Driver Behavior: Results from Naturalistic Driving Data.” Transportation Research Part F, Traffic Psychology and Behaviour 45:75–92. https://doi.org/10.1016/j.trf.2016.10.019.
- Racelogic Ltd. 2018. Video VBOX User Manual. Technical Report Racelogic Buckingham, England.
- Reimer, B., B. Mehler, J. F. Coughlin, N. Roy, and J. A. Dusek. 2011. “The Impact of a Naturalistic Hands-Free Cellular Phone Task on Heart Rate and Simulated Driving Performance in Two Age Groups.” Transportation Research Part F, Traffic Psychology and Behaviour 14:13–25. https://doi.org/10.1016/j.trf.2010.09.002.
- Shekhar Babu, S., and P. Vedagiri. 2016. “Proactive Safety Evaluation of a Multilane Unsignalized Intersection Using Surrogate Measures.” Transportation Letters 7867 (2): 104–112. https://doi.org/10.1080/19427867.2016.1230172.
- Tarko, A., G. Davis, N. Saunier, T. Sayed, and S. Washington 2009. “White Paper: Surrogate Measures of Safety.” Committee on Safety Data Evaluation and Analysis (ANB 20), Transportation Research Board, (pp. 1–13).
- Toledo, T., and T. Lotan. 2006. “In-Vehicle Data Recorder for Evaluation of Driving Behavior and Safety.” Transportation Research Record 1953 (1): 112–119. https://doi.org/10.3141/1953-13.
- Vedagiri, P., and D. V. Killi. 2015. “Traffic Safety Evaluation of Uncontrolled Intersections Using Surrogate Safety Measures Under Mixed Traffic Conditions.” Transportation Research Record: Journal of the Transportation Research Board 2512:81–89. https://doi.org/10.3141/2512-10.
- Venkataraman, N. S., G. F. Ulfarsson, and V. N. Shankar. 2014. “Extending the Highway Safety Manual (HSM) Framework for Traffic Safety Performance Evaluation.” Safety Science 64:146–154. https://doi.org/10.1016/j.ssci.2013.12.001.
- Voß, G. M., C. M. Keck, and M. Schwalm. 2018. “Investigation of Drivers’ Thresholds of a Subjectively Accepted Driving Performance with a Focus on Automated Driving.” Transportation Research Part F, Traffic Psychology and Behaviour 56:280–292. https://doi.org/10.1016/j.trf.2018.04.024.
- Wang, L., Y. Wang, L. Shi, and H. Xu. 2022. “Analysis of Risky Driving Behaviors Among Bus Drivers in China: The Role of Enterprise Management, External Environment and Attitudes Towards Traffic Safety.” Accident Analysis & Prevention 168:106589. https://doi.org/10.1016/j.aap.2022.106589.
- Wu, K. F., J. Aguero-Valverde, and P. P. Jovanis. 2014. “Using Naturalistic Driving Data to Explore the Association Between Traffic Safety-Related Events and Crash Risk at Driver Level.” Accident Analysis & Prevention 72:210–218. https://doi.org/10.1016/j.aap.2014.07.005.
- Wu, K. F., and P. P. Jovanis. 2012. “Crashes and Crash-Surrogate Events: Exploratory Modeling with Naturalistic Driving Data.” Accident Analysis & Prevention 45:507–516. https://doi.org/10.1016/j.aap.2011.09.002.
- Wu, J., X. Yan, and E. Radwan. 2016. “Discrepancy Analysis of Driving Performance of Taxi Drivers and Non-Professional Drivers for Red-Light Running Violation and Crash Avoidance at Intersections.” Accident Analysis & Prevention 91:1–9. https://doi.org/10.1016/j.aap.2016.02.028.
- Yadav, A. K., and N. R. Velaga. 2019. “Effect of Alcohol Use on Accelerating and Braking Behaviors of Drivers.” Traffic Injury Prevention 20:353–358. https://doi.org/10.1080/15389588.2019.1587167.
- Yu, Z., W. Qu, and Y. Ge. 2022. “Trait Anger Causes Risky Driving Behavior by Influencing Executive Function and Hazard Cognition.” Accident Analysis & Prevention 177:106824. https://doi.org/10.1016/j.aap.2022.106824.
- Zhang, T., A. H. Chan, Y. Ba, and W. Zhang. 2016a. “Situational Driving Anger, Driving Performance and Allocation of Visual Attention.” Transportation Research Part F, Traffic Psychology and Behaviour 42:376–388. https://doi.org/10.1016/j.trf.2015.05.008.
- Zhang, T., A. H. Chan, Y. Ba, and W. Zhang. 2016b. “Situational Driving Anger, Driving Performance and Allocation of Visual Attention.” Transportation Research Part F, Traffic Psychology and Behaviour 42:376–388. https://doi.org/10.1016/j.trf.2015.05.008/.
- Zhang, Q., W. Qu, Y. Ge, X. Sun, and K. Zhang. 2020. “The Effect of the Emotional State on Driving Performance in a Simulated Car-Following Task.” Transportation Research Part F, Traffic Psychology and Behaviour 69:349–361. https://doi.org/10.1016/j.trf.2020.02.004.
- Zhang, H., X. Yan, C. Wu, and T. Qiu. 2014. “Effect of Circadian Rhythms and Driving Duration on Fatigue Level and Driving Performance of Professional Drivers.” Transportation Research Record: Journal of the Transportation Research Board 2402:19–27. https://doi.org/10.3141/2402-03.
- Ziakopoulos, A., A. Kontaxi, and G. Yannis. 2023. “Analysis of Mobile Phone Use Engagement During Naturalistic Driving Through Explainable Imbalanced Machine Learning.” Accident Analysis & Prevention 181 (106936). https://doi.org/10.1016/j.aap.2022.106936.