Abstract
Various model approaches have been developed for assessing emissions of different forms of reactive nitrogen in various parts of Europe at various geographic resolutions and for various time periods. The modeling approaches include emission factor approaches, empirical models, simple process-based models, and detailed ecosystem models. In this study, we compared three relatively simple process-based models, developed for the national scale (Integrated NITrogen Impact AssessmenT model On a Regional Scale (INITIATOR2)), European scale (MITERRA) and global scale (integrated model to assess the global environment (IMAGE)), with respect to their response to structural and technological changes in the agricultural systems based on the IPCC B2 baseline scenario for the period 2000–2030. Changes are predicted by the IMAGE model and relate to crop yield, crop area, animal numbers, and N fertilizer inputs. The predicted relative changes by IMAGE are used in INITIATOR2 and MITERRA while relating the animal categories and crop categories in IMAGE to those in the latter models. A comparison was made of NH3, N2O and NO x emissions and N leaching to ground water. We compared predictions for the years 2000 and 2030 for: (i) the Netherlands between INITIATOR2 and MITERRA and (ii) Europe (EU-27 countries) between MITERRA and IMAGE. The results of the comparison are presented and evaluated in view of differences in model structure and the effect of aggregating input data at larger spatial scales.
1. Introduction
Various model approaches have been developed for assessing emissions of different forms of reactive nitrogen such as ammonia (NH3), nitrous oxide (N2O), and nitrogen oxide (NO x ) emissions and nitrogen (N) leaching and runoff in various parts of Europe at various geographic resolutions and for various time periods. The modeling approaches vary from: (i) emission factor approaches at various spatial resolutions, such as United Nations Framework Convention on Climate Change/Intergovernmental Panel on Climate Change (IPCC 2006), Emissions Database for Global Atmospheric Research (Van Aardenne Citation2002), Greenhouse gas, Air pollution Interactions and Synergies (GAINS) (Winiwarter Citation2005), and European Monitoring and Evaluation Programme (Simpson et al. Citation2003) to (ii) models combining more detailed emission factor approaches with simple process-based and empirical models, such as Integrated Model to Assess the Global Environment (IMAGE) (MNP Citation2006), MITERRA (Velthof et al. Citation2009) and Integrated NITrogen Impact AssessmenT model On a Regional Scale (INITIATOR2) (De Vries et al. 2005a,b) and (iii) detailed ecosystem models, such as DeNitrification-DeComposition (DNDC) (Li Citation2000; Li et al. Citation2000) and the combination Common Agricultural Policy Regionalized Impact (CAPRI)-DNDC (Leip et al. Citation2008).
A crucial question regarding the use of integrated assessment models is whether the most appropriate scale is used in addressing air quality and water quality impact issues, when moving from global to continental to national and regional scales. With respect to green house gases, such as N2O, it is crucial to know whether the total emissions for the areas considered (e.g. country or continent) are reliable. Information on the spatial distribution of the N2O emissions is less relevant, because N2O is a long-lived gas with strong atmospheric dispersion, leading to an averaging of its concentration and no local impact close to its source. Accurate information on the spatial distribution of the emissions is, however, crucial when assessing the risk of elevated NH3 emissions, and related N deposition, and of N leaching and N runoff in view of eutrophication impacts on terrestrial and aquatic ecosystems. Here, aggregation of input data for large areas may cause accurate average N deposition and N leaching levels, but a strong deviation in the area exceeding critical N deposition loads or critical N concentrations in ground water and surface water. This effect holds for all spatial levels. For this reason, many countries in Europe have developed modeling tools, at national and sub-national scale.
In this study, three relatively simple process-based models, developed for the national scale (INITIATOR2), European scale (MITERRA), and global scale (IMAGE), were compared to gain insight in the effects of aggregating input data and modeling approach on the model outcomes at sub-national and national scale. Since both model approach and data aggregation varied simultaneously, the model comparison only gives an indication about how data aggregation on one hand and differences in model approach and input data on the other hand affect the model results. Model results included N budgets, focusing specifically on NH3, N2O, and NO x emissions to the atmosphere, N leaching to groundwater and N runoff to surface water, in response to livestock, land use, and management changes in agriculture, based on the IPCC B2 baseline scenario for the period 2000–2030. Changes in inputs, related to animal numbers and N fertilizer inputs are predicted by the IMAGE model. The predicted relative changes by IMAGE are used in INITIATOR2 and MITERRA while relating the animal categories and crop categories to those in IMAGE. We compared predictions for the years 2000 and 2030 for: (i) the Netherlands using INITIATOR2 and MITERRA and (ii) Europe (the current 27 EU countries) using MITERRA and IMAGE.
2 Methodological approaches
2.1 Models involved
2.1.1 IMAGE
The IMAGE is a dynamic integrated assessment modeling framework for global change (MNP Citation2006). IMAGE 2.4 simulations cover the 1970–2100 period (end year dependent of scenario choice). Data for 1970–2000 are used to calibrate the model. Simulations up to the year 2100 are made on the basis of scenario assumptions on, for example, demography, food and energy consumption, and technology and trade. IMAGE 2.4 is global in application and makes standard predictions for 24 world regions (energy, trade, and emissions), using equilibrium economy from different economic models. In Europe, a distinction is made in Organisation for Economic Co-operation and Development Europe and Eastern Europe. However, IMAGE performs many of its calculations also on a high-resolution terrestrial 0.5 by 0.5° grid (land use and land cover) and for Europe it includes country-based calculations of N fluxes, including NH3 and N2O emissions, N uptake and N leaching/runoff. The NH3 and N2O emission fractions are based on factors related to (i) agricultural management, such as crop type, fertilizer type, and fertilizer application technique and (ii) environmental conditions, such as climate and soil properties (see section 2.4). N uptake is the product of crop removal and N content in crops. N leaching follows from the difference of all inputs and outputs.
2.1.2 MITERRA
MITERRA (often denoted as MITERRA-Europe) is a deterministic and static N cycling model which calculates N emissions on an annual basis, using N emission factors and N leaching fractions based on literature and expert knowledge (Velthof et al. Citation2009). The model is used to assess the effects of measures and policies on the emissions of NH3, N2O, NO x , and CH4 to the atmosphere and leaching of N to groundwater and surface waters at EU-27 level, country level, and regional (NUTS-2) level. MITERRA focuses on agriculture only. MITERRA-Europe is based on the models RAINS/GAINS (regional air pollution information and simulation; http://www.iiasa.ac.at/rains) and CAPRI (www.capri-model.org), supplemented with an N cycle and N leaching module. The total N excretion is calculated as the number of animals × the excretion per animal, for the different types of animals. N excreted during grazing is calculated using information about the number of grazing days (grazing). The other part of excreted N is from housed animals and is stored in a manure storage and subject to emissions. The gaseous N losses (NH3, N2O, NO x ) from animal manure during housing and storage are calculated using emission factors. The emission factors are obtained from the RAINS/GAINS model (Klimont and Brink Citation2004) and are country specific. N uptake is the product of crop removal and N content in crops. N leaching is derived by multiplication of the N surplus (N input minus gaseous N losses minus N uptake) with an N leaching factor.
2.1.3 INITIATOR2
INITIATOR2 was developed to gain insight in all environmental impacts of excessive manure application in the Netherlands simultaneously (De Vries et al. 2005a,b). It is an extension of the model INITIATOR that was developed to gain insight in the fate of all major nitrogen flows (De Vries et al. Citation2003) and also includes the emissions of carbon dioxide, methane, fine particles, and odor and the accumulation, runoff and leaching of phosphate, base cations, and heavy metals. A so-called CBS/GIAB database contains animal numbers and the location for each farm in the Netherlands. The NH3, NO x , and N2O emissions from housing and manure storage systems are described by a multiplication of an N excretion factor and an emission factor related to N excretion for different animal categories, depending on the type of emission (up to 65 categories in case of N excretion and NH3 emission). Results of the N excretion are input for a simple manure transport model, predicting manure export from intensive animal husbandry areas and manure import in less intensive areas and assessing the related fertilizer use. NH3, N2O, and NO x emissions and N leaching due to N input by fertilizer and manure application, grazing N deposition and N fixation are calculated in the soil model (the core) of INITIATOR2. The fate of N in soils is calculated as a sequence of occurrences in the order NH3 emission, followed by N uptake, N mineralization/immobilization, nitrification, and denitrification in the soil. All N transformation processes are a linear function of the inflow of N, namely: (i) the N input for the soil NH3 emission, (ii) the N input minus the NH3 emission for N removal from the field, (iii) the net N input (N input minus NH3 emission minus N uptake) for N mineralization/ immobilization, (iv) the net N input minus N mineralization/immobilization for nitrification and the nitrification flux for denitrification. The NH3 emissions from soils are calculated by a multiplication of the N inputs by manure and fertilizer application and grazing cattle with specific N emission fractions for these inputs. The N2O and NO x emissions from soils are calculated as the multiplication of specific N2O and NO x emissions fractions with the nitrification flux and denitrification flux. N leaching is assessed as the sum of all N inputs minus N uptake, N accumulation and all N emissions. NH3 emissions from housing systems and soils form the input of a transfer matrix, based on the results of the atmospheric transport model that calculates the NH3 deposition on agricultural and non-agricultural systems.
2.2 Assessment of trends in livestock, land use, and management
The predicted changes in the agricultural systems are changes in animal numbers, crop area, crop yield, and N fertilizer inputs. These changes are calculated in response to the IPCC-Special Report on Emissions Scenarios Regional Communities (B2) scenario, which was made more specific on agricultural policies. Trends in animal numbers and crop areas are based on the demand, trade and production of crops and animal products as provided by the GTAP model (Hertel Citation1997). The modules of the animal production systems in IMAGE are used to calculate the number of animals and their feed requirements from feed crop, grass, fodder, etc. A detailed description of the animal production systems and future intensity increase is provided by Bouwman et al. (Citation2005a). Changes in crop area are a result of changes in agricultural production, which is also calculated by the GTAP model, and changes in crop yield. Allocation of the production on the 0.5° grid is done by the land cover change model (LCM) of IMAGE. The terrestrial vegetation sub model (TVM) in IMAGE calculates crop yield on the basis of the potential crop productivity, which is multiplied by the fraction of actual yield to potential crop productivity (the so-called “management factor” in IMAGE). This management factor is assumed to grow in time, based on Bruinsma (Citation2003). Additional to this external trend, yields also change because of the economically driven intensification as calculated by GTAP, through climate change and through change in agricultural area. In IMAGE fertilizer use depends on crop production expressed in dry matter. Hence, with changing crop production, the fertilizer requirement per hectare changes proportionally. However, at the same time the fertilizer use efficiency increases. This is expressed as the dry matter production in kg per kg of N fertilizer. For Western European countries, this efficiency is assumed to increase by 20% in the period 2000–2030, whereas no change in fertilizer efficiency is assumed for Eastern European countries. More details on this approach are given by Bouwman et al. (Citation2005b).
2.3 Geographic input data and linkage of scenario results from IMAGE to MITERRA and INITIATOR2
2.3.1 Geographic resolution and input data
The spatial resolution of input data used by the models IMAGE, MITERRA, and INITIATOR2 varies, according to the geographic extent of the model. IMAGE uses input data at sub-continental level, but for Europe an IMAGE version exists that uses agricultural data at country level. MITERRA uses statistical data at the NUTS2 administrative level (NUTS 2; Nomenclature of Territorial Units for Statistics in the EU; ca. 230 administrative areas of 160–440 km2). INITIATOR2 uses data at the level of the so-called Samen te Ontwikkelen Nutrienten Emissie (STONE) plots (4647 for agriculture in the Netherlands), that are plots consisting of a multiple of 250 m × 250 m grid cells with unique combinations of soil use, soil type, and related soil properties and ground water table class.
Major geographically explicit input data are N fertilizer rates, livestock numbers, and land cover. The national fertilizer consumption rates by IMAGE and MITERRA are derived from Food and Agriculture Organization Statistical Database, while the INITIATOR2 data for the Netherlands are based on Dutch statistics. With respect to animal livestock numbers, IMAGE uses the FAO database at country level (http://faostat.fao.org/) (FAO Citation2007), while making a division in dairy/nondairy according to a procedure described by Bouwman et al. (Citation2005a). IMAGE estimates the area of arable land as the production per country divided by crop yields and multiplied by the cropping intensity, which is defined as harvested area divided by arable area, to correct for fallow land. The data on agricultural production, crop yields and cropping intensity per country are based on the FAO database (FAO Citation2007) for the year 2000 and on predictions (Bruinsma Citation2003) for 2030. MITERRA uses RAINS data for animal livestock numbers at country level, whereas EUROSTAT on production statistics are used for distribution of animals over NUTS2 regions. The area of both grassland and arable land, and that of all crops are also based on EUROSTAT production statistics. Animal numbers and land cover used in INTITIATOR2 are based on the so-called CBS/GIAB database, containing agricultural statistics for each farm in the Netherlands. Differences in N inputs between the models are presented in the results, whereas differences in land area are shown in detail by De Vries et al. (Citation2009).
2.3.2 Linkage of scenario results
The principle of the linkage of the IMAGE results to MITERRA and INITIATOR2 is to superimpose the relative changes in animal numbers, crop area, crop yield and N fertilizer use at country level assessed by IMAGE for the period 2000–2030 to the more detailed data used by MITERRA and INITIATOR2 in the year 2000. To perform this action, tables are used that allocate the various animal and crop categories used in IMAGE to those used by MITERRA and INITIATOR2. An overview of these allocation tables and the data sources used by IMAGE, MITERRA, and INITIATOR2 for the year 2000 is given by De Vries et al. (Citation2009).
2.4 Emission factors and functions used by MITERRA and INITIATOR2
Apart from the agricultural area considered and the estimated N inputs by animal manure (determined by live stock) and mineral fertilizer, the IMAGE, MITERRA, and INITIATOR2 outputs are mainly determined by the emission factors or functions for the various compounds considered (NH3, N2O, NO x , NO3).
The NH3 emission fractions of IMAGE are based on Bouwman et al. (Citation1997) for NH3 volatilization from manure storage and manure excreted during grazing and on Bouwman et al. (Citation2002b) for NH3 volatilization from fertilizer and animal manure application. Bouwman et al. (Citation2002b) used a residual maximum likelihood (REML) model to assess NH3 emissions in kg N ha−1 based on factors related to (i) agricultural management, including crop type, fertilizer type, and fertilizer application technique (broadcasting, incorporation, injection, solution) and (ii) environmental conditions (climate, soil pH, and CEC), using a data set of about 1700 measurement series. A similar regression-based approach is used in IMAGE for N2O, in which N2O emissions in kg N ha−1 are also related to (i) management factors (N application rate per fertilizer type, type of crop) and (ii) environmental factors (climate, soil organic C content, soil texture, drainage, and soil pH) based on a large collection of N2O emission measurements from agricultural fields, reported by Bouwman et al. (Citation2002a). The NH3 and N2O emission factors thus derived are included on a 0.5 × 0.5° resolution. Results are aggregated to the country scale to derive N emission fractions. Unlike IMAGE, NH3, and N2O emission fractions for manure storage, fertilizer, and animal manure application and grazing in MITERRA are all based on country-specific data included in the RAINS/GAINS model.
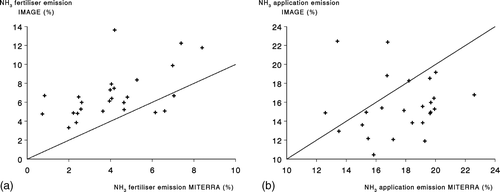
As an example, a comparison is given in of the variation in NH3 emission fractions related to manure and fertilizer application in 27 EU countries as used in IMAGE and in MITERRA. The results show a considerable scatter and in case of fertilizer application a consistently higher emission fraction by IMAGE as compared to MITERRA (). For N2O, the overall world average emission fraction in IMAGE is 1.0%, being the recent default IPCC value used, but for EU27 the overall world average emission fraction in IMAGE is 1.87%. The N2O emission fraction for fertilizer and animal manure application is fixed in MITERRA at 1.25%, the former being the default IPCC emission factor. A more detailed overview of the emission factors used for NH3, N2O, and NO x by all models is given by De Vries et al. (Citation2009). N2O and NO x emission factors in view of N application by manure and fertilizers are not given for INITIATOR2, since this model estimates N2O emission on the basis of nitrification and denitrification rates and N2O/N2 ratios during these processes.
Figure 1. Comparison of the NH3 emission fractions per country by IMAGE and MITERRA related to fertilizer application (a) and manure application (b).
3 Results on nitrogen budgets and nitrogen fluxes to atmosphere and water
3.1 Comparison at national scale
3.1.1 Aggregated national scale results
The estimated N budgets for agricultural land for the whole of the Netherlands for the years 2000 and 2030 are quite comparable for INITIATOR2 and MITERRA (). The largest differences occur for the N input by manure application in 2030, which is higher in MITERRA compared to INITIATOR2 due to a much lower reduction in N excretion. Unlike MITERRA, an efficiency increase is assumed in INITIATOR2. Furthermore, the N balance by INITIATOR2 includes more sources, i.e. organic products and N mineralization of drained peat soils. The latter flux is considerable. Nevertheless, the net surplus, which determines the fate of N in terms of emissions to atmosphere and water, derived by both models is quite comparable due to an estimated higher N uptake by INITIATOR2 as compared to MITERRA.
Table 1. N budgets for agricultural lands in the Netherlands, estimated by INITIATOR2 and MITERRA for the years 2000 and 2030.
Results for the year 2000 show that the estimated total NH3 emissions by INITIATOR2 are approximately 20% higher than the estimates by MITERRA, while the emissions for both N2O and NO x are 40% higher (). The difference between the net surplus and the various N fluxes to atmosphere and water is an estimate for the N2 emissions, which are quite comparable.
3.1.2 Results at a regional scale
A comparison of the predicted total NH3 emissions by INITIATOR2 and MITERRA per NUTS2 region for the year 2000 shows that results are in line with the comparison at national scale. The deviations are generally less than 20%. However, while the predicted total N leaching at the national scale by INITIATOR2 is approximately 20% less than that by MITERRA, the variation at NUTS2 level is much higher and can even be more than 100% (). Even though the total NH3 emissions at NUTS2 level are quite comparable, INITIATOR2 predicts a large spatial variation within the NUTS2 regions that can deviate largely from the NUTS2 average emissions as shown in . This variation affects the N deposition, which mainly results from NH3 emissions in agriculture and NO x emissions by traffic and industry. The N deposition was estimated by adding the available NO x deposition data to calculated NH3 depositions based on the NH3 emission results from both models. In INITIATOR2, we used an emission–deposition transfer matrix to assess the deposition induced by NH3 emissions from agriculture, while adding a background NH3 deposition due to emissions outside Dutch agriculture. For MITERRA, we assumed that NH3 deposition in each NUTS2 region is 55% of the NH3 emission (average value for the Netherlands). The resulting present N loads were compared with the available critical N loads for nature target types in the Netherlands (Van Dobben and van Hinsberg Citation2008). The exceedance of the critical N load thus derived is given in , in terms of (i) the area exceeding the critical N load, (ii) the accumulated N exceedance, being the product of area and exceedance for all areas where the N deposition in 2000 exceeds the critical N deposition, and (iii) the average exceedance, being equal to the accumulated exceedance divided by the area where N exceedance occurs. The exceedance of the critical N leaching is also given in , where the criterion is the NO3 concentration in the leachate of 50 mg NO3/l. The results imply that the area exceeding critical N loads and the average level of exceedance is affected by spatial aggregation of the input data, both for the effects on biodiversity (N deposition) and ground water quality (N leaching). The impact on exceedances is, however, much larger for N leaching than for N deposition and this is also caused by a much higher average N leaching rate predicted by MITERRA compared to INITIATOR2 and not by spatial aggregation only.
Figure 2. Comparison of total NH3 emissions (A) and N leaching (B) by INITIATOR2 and MITERRA per NUTS2 region in the Netherlands for the year 2000.
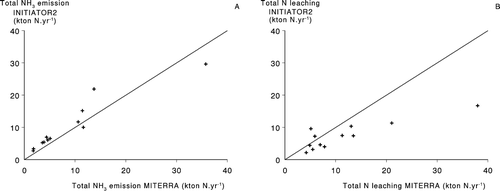
Figure 3. Geographic variation in total NH3 emissions as derived by INITIATOR2 per STONE plot (a) and by MITERRA per NUTS2 region (b) in the Netherlands for the year 2000.
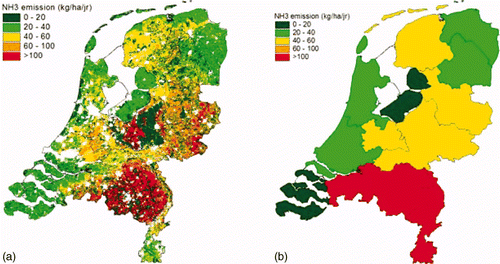
Table 2. Calculated exceedances of critical N loads for nature and critical NO3 leaching for agricultural lands in the Netherlands in view of impacts on biodiversity (deposition) and ground water quality (leaching) by INITIATOR2 and MITERRA in the year 2000.
3.2 Comparison at European scale
3.2.1 Aggregated European scale results
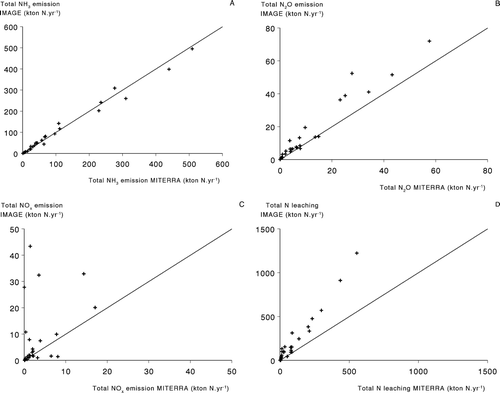
Estimated N budgets for agricultural land for Europe (limited to the 27 member states of the EU, EU27) for the years 2000 and 2030 are quite comparable for IMAGE and MITERRA (). The total N inputs compare within 10%, although individual sources such as grazing and deposition deviate up to 30%. The total N inputs are approximately 2750 kton N larger in IMAGE in the year 2000. The larger input in 2000 is compensated by a larger N uptake in IMAGE, leading to an even lower N surplus at the European scale. In 2030, the differences in total N inputs are less but the relative differences between the N emissions and N leaching and runoff remain the same. Results for the total emissions of NH3 for EU-27 are highly comparable for MITERRA and IMAGE, both in 2000 and 2030, whereas the calculated total emissions of N2O and NO x are 20–40% higher by IMAGE compared to MITERRA, both in 2000 and 2030. The estimated sum of N leaching and N runoff by IMAGE is even twice as high as the estimate by MITERRA ().
Table 3. Calculated N budgets for agricultural lands for EU 27 by IMAGE and MITERRA for the years 2000 and 2030.
3.2.2 Results at a national and regional scale
The predicted total NH3 emissions by IMAGE and MITERRA are not only comparable at EU level but also at country level, as shown in for the year 2000. Results for NH3 show a very high correlation. The correlation between the estimated N2O emissions and the sum of N leaching and runoff per country by IMAGE and MITERRA is also high but there is a systematic difference as mentioned before. For NO x emissions, there is a very limited correlation ().
Figure 4. Comparison of total NH3 emissions (A), N2O emissions (B) NO x emissions (C), and N leaching (D) by IMAGE and MITERRA per country for the year 2000.
A map of, e.g. NH3 emissions at NUTS2 level again gives considerable variation, as compared to the country level variation by IMAGE (see De Vries et al. Citation2009), that will again affect the exceedance of critical loads at the European scale. For policy purposes reasons, however, the exceedance of national emission ceilings is most relevant, and here the results of IMAGE and MITERRA hardly differ (see De Vries et al. Citation2009), since the predicted total NH3 emissions by both models are comparable at country level, as shown in .
4 Discussion and conclusions
The results show that the total estimates of N emissions and N leaching by INITIATOR2 and MITERRA at the national level and by MITERRA and IMAGE at continental level are quite comparable. However, at a higher spatial resolution (i.e. within a country when comparing INITIATOR2 and MITERRA and between countries when comparing MITERRA and IMAGE) there are considerable variations between the model results. This implies that exceedances of critical loads for nitrogen in view of impacts on biodiversity and ground water quality can differ considerably due to spatial aggregation of the data. The presented differences in this study are, however, not only caused by a scale effect but also by differences in model approach and input data used, such as livestock numbers, N fertilizer use, land cover and emission factors, which all affect the N input and N leaching.
The impact of model structure is, e.g. clear from the fact that the comparison of predictions is different for 2000 and 2030 related to differences in model assumptions. For example, an efficiency increase in N use in the period 2000–2030 is assumed in INITIATOR2 but not in MITERRA. Consequently, where the N input by animal manure for the whole of the Netherlands is quite comparable in 2000, it deviates by approximately 20% in 2030. Apart from this difference in time, caused by different model assumptions, the differences in model results are due to the use of differences in the basic data, such as animal numbers and crop yields, and in excretion, emission, uptake and leaching factors.
In summary, the results imply that spatial aggregation has a limited effect on the national and continental scale emission estimates but may have a large effect on the exceedance of critical N loads and critical NO3 concentrations, respectively. To evaluate the scale effect only, however, one has to make sure that no other effect is super-imposed, by harmonizing the methods. The best approach is then to use one model and apply it at (sub) national level, using available detailed (sub) national data and less detailed continental data, thus assessing the impact of aggregating information on land cover, soils, climate, N inputs, etc. Where this model comparison study shows differences due to both model structure and input data, including their spatial aggregation, an in-depth research using one model approach at various scales is thus needed to study the spatial aggregation effect alone.
Acknowledgments
The authors acknowledge funding for this research by the Dutch BSIK programme “Climate and Spatial Planning”, the European Commission (NitroEurope-IP, Contract Nr. 17841.00). The research is co-funded by the Dutch Ministry of Agriculture, Nature and Food Quality as part of the strategic research programmes “Sustainable spatial development of ecosystems, landscapes, seas and regions” and “Climate change”, carried out by Wageningen University and Research Centre.
Related Research Data
References
- Bouwman , A F , Boumans , L JM and Batjes , N H . 2002a . Modeling global annual N2O and NO emissions from fertilized fields . Glob Biogeochem Cycles , 16 ( 4 ) : 1080 – 1090 .
- Bouwman , A F , Boumans , L JM and Batjes , N H . 2002b . Estimation of global NH3 volatilization loss from synthetic fertilizers and animal manure applied to arable lands and grasslands . Glob Biogeochem Cycles , 16 ( 2 ) : 1024
- Bouwman , A F , Lee , D S , Asman , W AH , Dentener , F J , van der Hoek , K W and Olivier , J GJ . 1997 . A global high-resolution emission inventory for ammonia . Glob Biogeochem Cycles , 11 ( 4 ) : 561 – 587 .
- Bouwman , A F , van der Hoek , K W , Eickhout , B and Soenario , I . 2005a . Exploring changes in world ruminant production systems . Agric Syst , 84 ( 2 ) : 121 – 153 .
- Bouwman , A F , Van Drecht , G and Van der Hoek , K W. 2005b . Surface N balances and reactive N loss to the environment from intensive agricultural production systems for the period 1970–2030 . Sci China Ser C Life Sci , 48 ( Suppl ) : 1 – 13 .
- Bruinsma , J AM . 2003 . World agriculture: towards 2015/2030: an FAO perspective , London : Earthscan Publications Ltd .
- De Vries , W , Kros , J and Velthof , G . Integrated evaluation of agricultural management on environmental quality with a decision support system . Third International Nitrogen Conference . Oct 12–16 2004 , Nanjing, China. Edited by: Zhu , Z , Minami , K and Xing , G . pp. 859 – 870 . Nanging, China: Science Press .
- De Vries , W , Kros , J , Kuikman , P J , Velthof , G L , Voogd , J CH , Wieggers , H JJ , Butterbach-Bahl , K , Denier Van Der Gon , H AC and van Amstel , A R. 2005b . Use of measurements and models to improve the national IPCC based assessments of soil emissions of nitrous oxide . Environ Sci , 2 ( 2–3 ) : 217 – 233 .
- De Vries , W , Kros , J , Oenema , O and de Klein , J. 2003 . Uncertainties in the fate of nitrogen II: a quantitative assessment of the uncertainties in major nitrogen fluxes in the Netherlands . Nutr Cycl Agroecosyst , 66 ( 1 ) : 71 – 102 .
- De Vries , W , Kros , J , Voogd , J C , Lesschen , J P , Oudendag , D A , Stehfest , E and Bouwman , A F . 2009 . Comparing predictions of nitrogen and green house gas fluxes in response to changes in live stock, land cover and land management using models at a national, European and global scale , Wageningen, , the Netherlands : Alterra Wageningen UR . Report 1867
- FAO . 2007 . FAOSTAT database collections [Internet] Rome, Food and Agriculture Organization of the United Nations; [cited 2010 Jan 29]. Available from: http://apps.fao.org
- Hertel , T . 1997 . Global trade analysis: modeling and applications , Cambridge : Cambridge University Press .
- IPCC . 2006 . “ 2006 IPCC guidelines for national greenhouse gas inventories ” . In Prepared by the National Greenhouse Gas Inventories Programme , Edited by: Gytarsky , M , Hiraishi , T , Irving , W , Krug , T , Penman , J and coordinating lead authors . Japan : IGES .
- Klimont , Z and Brink , C. 2004 . Modelling of emissions of air pollutants and greenhouse gases from agricultural sources in Europe Interim Report IR-04-048. Laxenburg, Austria: International Institute for Applied Systems Analysis
- Li , C , Aber , J , Stange , F , Butterbach-Bahl , K and Papen , H . 2000 . A process oriented model of N2O and NO emissions from forest soils: I. Model development . J Geophys Res , 105 ( D4 ) : 4369 – 4384 .
- Leip , A , Marchi , G , Koeble , R , Kempen , M , Britz , W and Li , C . 2008 . Linking an economic model for European agriculture with a mechanistic model to estimate nitrogen and carbon losses from arable soils in Europe . Biogeosciences , 5 ( 1 ) : 73 – 94 .
- Li , C . 2000 . Modeling trace gas emissions from agricultural ecosystems . Nutr Cycling Agroecosyst , 58 : 259 – 276 .
- MNP . 2006 . Integrated modelling of global environmental change. An overview of IMAGE 2.4 , Bilthoven, , The Netherlands : Netherlands Environmental Assessment Agency (MNP) .
- Simpson , D , Fagerli , H , Jonson , J E , Tsyro , S , Wind , P and Tuovinen , J-P . 2003 . Transboundary acidification, eutrophication and ground level ozone in Europe, Part I Gothenburg, , Sweden Unified EMEP model description. EMEP Status Report 2003. Gothenburg, Sweden: Norwegian Meteorological Institute
- Van Aardenne , J A. 2002 . Uncertainties in emission inventories [PhD thesis]. Wageningen: Wageningen University
- Van Dobben , H F and van Hinsberg , A. 2008 . Overzicht van kritische depositiewaarden voor stikstof, toegepast op habitattypen en Natura 2000 gebieden. Alterra rapport 1654 , Wageningen : Alterra .
- Velthof , G L , Oudendag , D A , Witzke , H P , Asman , W AH , Klimont , Z and Oenema , O . 2009 . Integrated assessment of nitrogen emissions from agriculture in EU-27 using MITERRA-EUROPE . J Environ Qual , 38 : 1 – 16 .
- Winiwarter , W . 2005 . The GAINS model for greenhouse gases – Version 1.0: nitrous oxide (N2O) , Laxenburg, , Austria : International Institute for Applied Systems Analysis . IIASA Interim Report IR-05-55