Abstract
This article describes two different visualisation instruments that can be used for awareness raising and educational purposes: Nitrogenius and the N-visualisation tool. Both instruments aim to convey the complex interactions that occur in the nitrogen (N) cycle and the need for integrated measures when aiming to reduce N-related environmental problems such as eutrophication, acidification or global warming. Nitrogenius was developed in the year 2000. This four-player computer “game” focuses on the Dutch N problems caused by N2O, NH3 and NOx emissions as well as nitrate in surface and ground water. Underlying the glossy user interface is a set of comprehensive models and a database with potential measures that were considered to be feasible at the time. Since 2000, the model has been used for educational purposes annually at Wageningen University. About 150 MSc students played the game, with the aim to solve the N-related problems in the Netherlands. This article analyses these games, and presents the surprising correlation for the period 2000–2007 with the actual environmental trends in the Netherlands. The second tool is an N- visualisation tool that was developed in 2007. This tool provides both a historic overview of the nitrogen issue and demonstrates the effect of seven potential measures on the world wide N cycle. The effects of increased biomass use and intensification of agriculture are examples of included measures. The net effect on global warming, food availability and biodiversity are output parameters of this instrument. The calculations and assumptions underlying this tool are easily accessible through an open source spreadsheet. This tool was used in 2008 and 2009 at Wageningen University for educational purposes. The pros and cons of both games for awareness raising and educational purposes will be discussed.
1. Introduction
Communication about complex environmental issues can be done in various ways, using reports, brochures or lectures. New media, including animations and computer programmes have an added value to convey complex scientific processes. They can also help raise awareness among policy makers, stakeholders and the general public. The wide spectrum of environmental and socio economic issues that is related to reactive nitrogen makes this field of science a fertile place for development of new comprehensive communication tools. Reactive nitrogen (Nr) covers all biologically active, photochemically reactive, and radiatively active N compounds in the atmosphere and biosphere of the Earth. Thus, Nr includes inorganic reduced forms of N (e.g. NH3, NH4), inorganic oxidised forms (e.g. NOx, HNO3, N2O, NO3) and organic compounds (e.g. urea, amines, proteins).
Application of Nr in terms of fertiliser and manure is crucial for agriculture to sustain the food supply world wide (Erisman et al. Citation2008). However, a significant part of Nr in fertiliser use and animal husbandry is emitted into the environment (Bouwman et al. Citation2005). These losses include emissions of NH3 and N2O into the atmosphere or as NO3 into soil and water. (Kroeze et al. Citation1999; Bouwman et al. Citation2002; Seitzinger et al. Citation2005). Industry, traffic and domestic energy use and thus economy are major sources of Nr emissions (NOx and N2O) into the atmosphere (Olivier et al. Citation2005). Both humans and the natural environment are affected by Nr. High concentrations of NOx, and particulate matter in air cause respiratory diseases. Nitrate levels in ground and surface water can adversely affect drinking water quality (e.g. Cowling et al. Citation1998; Galloway and Cowling Citation2002; Smil Citation2002; Galloway et al. Citation2004, Citation2008). During the past decades, many different measures have been taken to control Nr emissions and limit their effects. These measures were mainly directed towards individual environmental problems such as acidification, eutrophication and climate change. It turns out that Nr is difficult to abate, because of the intimate linkages between its various forms: this applies equally to agriculture, where decreasing NH3 emissions may increase N2O and nitrate, and to transport emissions, where decreasing NOx emissions is leading to increased NH3 and N2O emissions (Galloway and Cowling Citation2002). Although some technical measures can be implemented relatively cheap, many are expensive. A proper selection of cost effective measures should therefore take all Nr forms into account. In this article, two visualisation tools are presented that aim to demonstrate the complex picture of reactive nitrogen in our environment. Nitrogenius (2001) focuses on the Netherlands, the N-visualisation tool (2007) has a global perspective. These two programmes were launched at the 2nd and the 4th International Nitrogen Conference, respectively, and used amongst others at Wageningen University as a part of a course on Pollution Management. The article describes the two instruments and discusses the lessons learned at these sessions.
2 Nitrogenius
2.1 Game description
In the year 2001, the four user computer game Nitrogenius was developed for a presentation at the 2nd Nitrogen Conference in Washington DC (Erisman et al. Citation2002a). This game deals with the N problems within the Netherlands. This country has a high population density (452 people · km−2) and is known for having one of the highest reactive nitrogen (Nr) emissions densities in the world. It has an important logistic role in Europe in the delta of the rivers Rhine and Meuse. Industrial and traffic sources both on land and water cause an emission of about 490 kton · NOx · y−1 (in the year 2000). Intensive agricultural activities with about 4 million cattle, 15 million pigs, 90 million chickens emit 180 kton · NOx · y−1 (in the year 2000). For N2O, the main sources are again agriculture and the production of artificial fertiliser and HNO3 for industry.
The model covers the period 2000–2016. Start data for the environmental situation were obtained in 2000. In that year a total budget of 8 Meuro (106 euro) was used for environmental measures in the Netherlands. In the game this budget is divided over the four roles, Government, industry, society and agriculture. Each role has a set of available measures. Every game turn (year) the players can select up to three measures out of a set of seven. For each measure the programme shows whether effects will be positive or negative with respect to the different environmental parameters. Also the implementation costs of the measure are shown. These costs are subtracted from the players budget, which imposes a limit on the number of measures that can be selected. All players have a few minutes available to select their measures and to discuss their respective options. After making the selection the total set is shown to all players. Society has the option to block one of the measures selected by other players which stimulates the interaction among the different roles. With the final selection of measures available the different sub models on economy, emissions, nitrogen flows in the agricultural system and atmospheric transport/deposition are run. Results are presented almost immediately in a special output screen. The main aim of the game is to trigger the discussion on an integrated approach of Nr among the players.
The economic model in Nitrogenius is simple. It includes about 50 different N-related industries and/or agricultural activities that are evaluated in terms of economic performance and emission levels. The main task of this model is to indicate the relative difference in costs for the different measures presented. An evaluation of the agricultural part of the model was done in 2004 (Hoogeveen and Oltmer Citation2004). This review was positive. A list of recommended changes is available but these are not yet implemented in the game. Emission reduction measures can either affect emission factors used per activity or the size of the activity itself. Emissions of NH3 and N2O and NO3 leaching and runoff for the agricultural activities are calculated using the Initiator model (De Vries et al. Citation2003). This model uses a database with about 2500 different soil/crop plots in the Netherlands. Modifications of the animal density and the NH3 emission factors or the process parameters for nitrification and denitrification affecting N2O emission affect the total NH3 and N2O emissions. The spatial distribution of the emissions is accounted for by using fixed emission distribution maps on a 5 × 5 km2 grid for the whole of the Netherlands and part of the surrounding countries. Initiator provides a per plot emission level that is aggregated to provide a 5 × 5 km2 emission map for NH3. Emission maps for NOx and NH3 are combined with emission deposition matrices to calculate the deposition effect on each 5 × 5 km2 in the Netherlands. Nitrate to groundwater and nitrate in surface water are obtained from Initiator directly. Emissions of N2O occur in different industrial activities as well as from the Initiator model. All emissions are added to provide a national total emission level.
Indicators for the environmental performance are the national NH3, NOx and N2O emission levels, critical load exceedance for N deposition, NO3 concentrations in ground water, N concentrations in surface water and accumulated hours with O3 exceedance over 40 ppb (AOT-40). All these indicators are shown for five regions in the Netherlands. Economic output parameters are the jobs in each sector (agriculture, industry, government) and the profits per sector. The happiness is a wrap-up indicator has weighed contributions of both economic and environmental parameters. A more elaborate overview of the Nitrogenius game can be found in Erisman et al. Citation2002a,Citationb.
2.2 Nitrogenius game results and strategies
Whenever Nitrogenius is played, a file is generated that can be used for post evaluation of the measures that were taken by the group of players. A comparison of the game results is shown in . An environmental performance index per game is obtained by comparing the emission reductions for all chemical components in the game (NH3, NOx, N2O, NO3 to ground water and surface water) versus a reference game played at the Washington conference. Similarly, an economic performance indicator is obtained based on the profits made and the number of jobs available. The curve in shows that a better environmental performance in general will cost more. On the other hand, a certain economical performance can be obtained with a wide range of emission reduction levels.
Figure 1. Environmental versus economic performance of games played at Wageningen University in 2005–2009. In this graph, the results of 36 games of 16 years are presented. Values show the percentage of change versus the reference game, so an environmental score of 102% indicates that the reduction of pollutants was 2% above the result of the reference game.
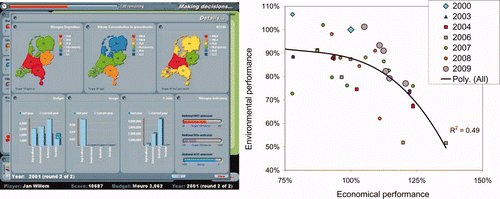
The difference in performance both in environmental and economical sense is likely to be related to the strategy used by the players over the 16-year episode. To evaluate this, time series for all important output parameters were reconstructed for each game covering the period 2000–2016. The games were subsequently grouped into different “game strategies” of which the results are shown in . In general three strategies were found:
Table 1. Distribution of the 31 games among different game strategies.
2.2.1 Strategy 1: consistent environmental strategy (Env.)
With 31 games analysed, it turns out in 20 (about 65%) games the participants mainly aim to solve environmental issues. All environmental impact parameters decrease continuously from the 2000 level. About half (eight) of these games also have a positive economic outcome in 2016 (Indicated in the table with All OK). The other 12 games, however, have problems with the economy in agriculture, government or society. When, for example, the government has overspent the budget allocated for environmental issues at the end of the game (negative budget for that role), this indicated in the table with “ruin gov”.
2.2.2 Strategy 2: Environmentally oriented after some time (Env. delayed)
Four games (13%) showed an initial increase of the environmental impact indicators, generally correlating with an increase in economic parameters. After 4–6 years, however, the teams start to work on the environmental parameters and the indicators decrease.
2.2.3 Strategy 3: economically oriented (Econ.)
Seven games (23%) show an increase in the environmental indicators or variations going up and down. In general, these teams get a higher economic growth rates.
Two teams made a mess of both the environment and the economy.
2.2.4 Time series versus real world data
Using all 31 games, the average time development for various output parameters was calculated. For the period 2000–2007 these data were confronted with actually reported official data in the Netherlands at www.Milieucompendium.nl. Results for NH3, NOx, N2O and runoff and leaching are shown in –. The error bars in all graphs show ± standard deviation of the dataset. For all parameters, results are presented in terms of a decrease in % versus the 2000 level.
Figure 2. (a–d) Comparison of the decrease in percentage versus the 2000 level for NO3 leaching, and emissions of NH3, NOx and N2O. The game results are averaged over 31 games. Error bars indicate the standard deviation of this set. The NER data were obtained from Milieucompendium. For NO3, the two indicators from nitrogenius related to nitrate were compared to reported N runoff and leaching in milieucompendium.
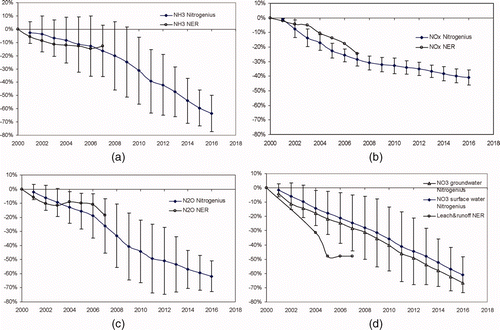
For NH3, the actual national emission reporting (NER) shows a reduction in the period 2000–2004 after which the decrease stops. The emission reduction measures for manure application in agriculture are the main cause of this decrease (Milieucompendium 2008). A further reduction of the national emission level was related to the decrease of livestock. (Milieucompendium 2008). The game shows a gradual change and ends at a similar reduction level in 2007. In that year, the game results fit well with the decrease in the NER data. Both measures using low emission manure application techniques and a reduction of intensive livestock are important and are also used frequently in the game.
For NOx, there is more emission reduction in the game as compared with the NER values until 2007. In the latter, National emissions of NOx are decreasing because of emission reduction measures in all contributing sectors. This also occurs in the game in which the players tend to use most of the technical emission reduction options that are provided. The discrepancy between the model and the real data might be related to the fact that in the Netherlands the effect of emission reduction in the transport sector is partially counteracted by the transport intensity increase. This intensity increase was not implemented in Nitrogenius. In contrast, the lower electricity production level within the Netherlands has decreased emissions. This was also not implemented in the game. (Milieucompendium 2008). The relatively narrow bandwidth of game solutions as indicated with the error bars shows that the players both in the industry role and consumer (transport) role are more restricted in what they can and cannot do as compared to, for example, NH3 (with the focus on the agriculture role).
For N2O, the game results again agree nicely with the 2007 NER levels but the trend is different. The agreement is mainly caused by the important reduction in 2007 of the N2O emission that was obtained in the fertiliser industry (production of HNO3).
The indicators in the game for N in surface (Nsw) and groundwater (Ng) were compared to the total estimate for runoff and leaching, assuming that a 10% reduction in the latter will also reduce the Nsw and Ng values. A story similar to NH3 applies for both N runoff and leaching. Initiated in order to reach the nitrate directive, measures related with manure management that were implemented have caused the NER levels to decrease significantly until 2004 after which stabilisation occurs. For the first 5 years, the game seems to be conservative in the emission reduction estimate for these parameters. On the other hand the question is, whether the continuation of the decrease after 2007 as shown in the model graphs will actually occur in reality. In general, the agreement between the ‘game’ and the real world from the environmental parameters is striking. The question arises if that was just good luck. It is clear that the major emission reductions that have led to the decrease in environmental pressure in the real world (NOx emission reduction at various sources, manure and livestock management in agriculture) are those available in the game and used by the players. In order to analyse this more quantitatively, we tried to analyse the sequence of selected measures and relate that to environmental performance. This did not provide clear results. One reason is that although all actions selected by the players are stored, the model does not store which actions are blocked by society.
The main aim of the model is to promote an integrated approach of the nitrogen issue and to demonstrate the interlinkage of different N fluxes in response to emission reduction measures. The unexpected agreement over the first 7 years indicates that the quantitative outcome is also realistic.
3 N-visualisation tool
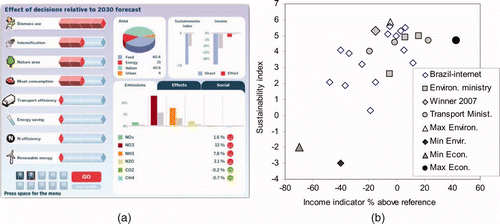
The second tool is the N-visualisation tool which consists of a set of animations that shows the history of the world wide N cycle and a “cockpit” that shows what 2030 will look like. In this cockpit, the user answers eight questions for different subjects to modify the 2030 lookout. (a) shows the main screen of the visualisation tool. The N-visualisation tool was developed for the 4th Nitrogen Conference held in Brazil 2007 and the aim of this tool is to show the multiple environmental effects that reactive N has once it is created. The eight questions for 2030 are:
How much do you want to change the amount biomass used for energy generation? | |||||
How much do you want to change the intensity agriculture (in crop yield per hectare)? | |||||
How much agricultural area do you want to convert back to nature area? | |||||
How much do you want to change the meat consumption for the average person? | |||||
By how much can we minimise transport, by bringing production and consumption closer together (geographically)? | |||||
By how much can we improve the environmental performance of energy generation sector? | |||||
By how much can we improve the N-use efficiency in agriculture? | |||||
How much more (%) renewable energy (non biomass) can we produce? | |||||
Figure 3. (a) N-visualisation main screen. (b) Distribution of the environmental and economical performance according to selected groups of N- visualisation tool users. The participants of the 4th Nitrogen Conference held in Brazil 2007 could join a contest, the best solution obtained there is shown as Winner 2007.
The user can change a slider for each question and after pressing a go button, the effects on emission, environmental quality and socio economic parameters are calculated in a simple Excel-based model. The calculations in the model are available in an Excel (Microsoft) file. For some interactions and parameters, references are available in literature. For a large number of interactions, these parameters are only known qualitatively. For this reason, the calculation scheme is provided as open source. A more elaborate overview of the calculations and assumptions in the visualisation tool are described in Hensen et al. (forthcoming). In 2008 and 2009, the visualisation tool was used at Wageningen University. The students worked for half a day to evaluate one parameter used in the calculation tool. The results of these sessions were used to upgrade the excel version of the visualisation tool. An important added feature is the option to run the model in a Monte Carlo mode. With a macro, 50 different realisations of the 2030 predictions for the output parameters are calculated using random variations of all input variables in the calculations. For all input parameters, an uncertainty level is set in the model. In general, all parameters were assigned uncertainty ranges of either 100, 50 or 25%.
There are two indicators included in the visualisation tool that aim to wrap up the total environmental and economical consequences of the decisions made. One index accounts for the net effect of implementation costs of a measure as well as increased or decreased costs for health issues or damage related to changed environmental conditions. The other index is a sustainability index that summarises the different social and environmental outputs in one weighted value. For both indicators, the default values in the model for 2030 are compared to the modified values obtained for 2030 that are the result of the changed slider settings. The difference between the two is used to calculate the environmental and economical indicator. The sustainability index is calculated as: SSI = –Σ i Change i × Weight i .
shows the chosen weighing factors for the different indicators in the visualisation tool and how they are used to obtain the sustainability index. Similar to the game evaluation in Nitrogenius, different games can be compared using the two indicators.
Table 2. Example of the sustainability index.
shows the scatter plot with 22 game solutions. The extreme values for both indicators can be found using the solver function in Excel (Microsoft). These are indicated as max and min. The anti-correlation that was shown in the Nitrogenius game between the environmental and economical indicator is absent here. The economic calculation used in this model is much simpler compared to the Nitrogenius. Another reason is that in the N-visualisation tool, an attempt was made to account for the costs of related to environmental degradation and health effects. This was not done in Nitrogenius.
4 Evaluation and conclusions
New media, computer simulations and animations can help raise awareness about complex issues among stakeholders, policy makers and the general public. These tools are becoming increasingly important for training and education. A key issue for these tools is to reach a proper balance between attractiveness and credibility. A computer programme with too many indicators and too much information will not be used by a wide audience. On the other hand, a good looking user interface does not necessarily indicate a good quality of underlying programme or the data presented. Both the N-visualisation and Nitrogenius were successful in getting participants involved in the discussion about the nitrogen issue during two international nitrogen conferences and for educational purposes. In the Netherlands, about 120 students have now played Nitrogenius in 31 games and 40 students have worked with the N-visualisation instrument. In the US, another 180 students played Nitrogenius at the University of Michigan in 2007–2009. Positive experience for Nitrogenius is the interaction between the different players that occurs during the 1 h session that is needed to play the whole game. The impact of this tool seems to be larger when the players also use the NDSS programme, the decision support system version of Nitrogenius that actually allows them to see more inside information and evaluate measures in more detail. Nitrogenius has relatively high logistic requirements using a set of four linked computers that have to be properly prepared. The comparison of the timelines of emissions in 31 games and the emissions in the NER is remarkable. The main explanation for this agreement is probably that the set of measures available in the first 7 years could be well foreseen and was indeed implemented in the game. Furthermore, the model results might have a bias towards a better environmental performance because the students who played the game were in general environmentally engaged. The temptation to win the game however asks for economic sound measures which has reduced this bias especially for some teams.
The N-visualisation tool is much easier to access. This game was now played during 7 group sessions with about 120 users in total. The animations that tell the story of the history of the N cycle are well appreciated as is the open source character of the N-visualisation tool with the Excel (Microsoft) sheet showing all calculations. This facilitates further development and improvement of the tool by students and other interested players. Although both instruments are freely available, they are used only a few times each year. The N-visualisation tool will be expanded to include more regionalisation of the outcomes. Also, a new tool that shows the interactions between climate change and air quality on a European scale is under development. Hopefully this article will trigger new user groups to play and learn with these games.
Acknowledgements
Both Nitrogenius and the Visualisation tool were developed for the Ministry of Housing, Spatial planning and the Environment. The authors acknowledge their Nitrogenius project team members, Wim de Winter, Mathijs Maat, Mark van Elswijk, Jan Erik Wien and Tamme van der Wal who were involved with the development of this game in 2000. They also acknowledge Jim Galloway and the crew at the Mediamonks for their part in the development of the N-visualisation tool.
References
- Bouwman , A F , Boumans , L JM and Batjes , N H . 2002 . Estimation of global NH3 volatilization loss from synthetic fertilizers and animal manure applied to arable lands and grasslands . Global Biogeochem Cycl. , 16 ( 2 ) : 8 – 1 .
- Bouwman , A F , Van Brecht , G and Van Der Hoek , K W . 2005 . Global and regional surface nitrogen balances in intensive agricultural production systems for the period 1970–2030 . Pedosphere. , 15 ( 2 ) : 137 – 155 .
- Cowling , E , Erisman , J W , Smeulders , S M , Holman , S C and Nicholson , B M . 1998 . Optimizing air quality management in Europe and North America: justification for integrated management of both oxidized and reduced forms of nitrogen . Environ Pollut. , 102 : 599 – 608 .
- De Vries , W , Kros , J , Oenema , O and de Klein , J . 2003 . Uncertainties in the fate of nitrogen II: a quantitative assessment of the uncertainties in major N fluxes in the Netherlands . Nutr Cy-cl Agroecosys. , 66 : 71 – 102 .
- Erisman , J W , Hensen , A , de Vries , W , Kros , J , van de Wal , T , de Winter , W , Wien , J E , van Elswijk , M , Maat , M and Sanders , K . 2002a . NitroGenius: a nitrogen decision support system. A game to develop the optimal policy to solve the Dutch nitrogen pollution problem . AMBIO. , 31 ( 2 ) : 190 – 196 .
- Erisman , J W , Hensen , A , de Vries , W , Kros , J , van de Wal , T , de Winter , W , Wien , J E , van Elswijk , M and Maat , M . 2002b . The nitrogen decision support system: NitroGenius ECN rapport-C-02-012, 56 p
- Erisman , J W , Sutton , M A , Galloway , J , Klimont , Z and Winiwarter , W . 2008 . How a century of ammonia synthesis changed the world . Nat Geosci. , 1 ( 10 ) : 636 – 369 . doi:10.1038/ngeo325
- Galloway , J N and Cowling , E B . 2002 . Reactive nitrogen and the world: 200 years of change . AMBIO: A Journal of the Human Environment , 31 ( 2 ) : 64 – 71 .
- Galloway , J N , Dentener , F J , Capone , D G , Boyer , E W , Howarth , R W , Seitzinger , S P , Asner , G P , Cleveland , C C , Green , P A Holland , E A . 2004 . Nitrogen cycles: past, present, and future . Biogeochemistry. , 70 ( 2 ) : 153 – 226 .
- Galloway , J N , Townsend , A R , Erisman , J W , Bekunda , M , Cai , Z , Freney , J R , Martinelli , L A , Seitzinger , S P and Sutton , M A . 2008 . Transformation of the nitrogen cycle: recent trends, questions, and potential solutions . Science. , 320 ( 5878 ) : 889 – 892 .
- Hensen , A , Bleeker , A and Erisman , J W . Forthcoming 2010 . Inside the visualisation tool . ECN report ECN-E-10-022 ,
- Hoogeveen , M W and Oltmer , K . 2004 . Evaluatie van de landbouwsector in het stikstofmodel Nitrogenius LEI Wageningen, project report nr 63660
- Kroeze , C , Mosier , A and Bouwman , L . 1999 . Closing the global N2O budget: a retrospective analysis 1500–1994 . Global Biogeochem Cycl. , 13 ( 1 ) : 1 – 8 .
- Milieucompendium [Internet] . 2008 . [cited 2010 Feb 24]. Available from: http://www.milieuennatuurcompendium.nl
- Olivier , J GJ , Van Aardenne , J A , Dentener , F , Pagliari , V , Ganzeveld , L N and Peters , J AHW . 2005 . Recent trends in global greenhouse gas emissions: regional trends 1970–2000 and spatial distribution of key sources in 2000 . Env Sci. , 2 ( 2–3 ) : 81 – 99 .
- Seitzinger , S P , Harrison , J A , Dumont , E , Beusen , A HW and Bouwman , A F . 2005 . Sources and delivery of carbon, nitrogen, and phosphorus to the coastal zone: an overview of global nutrient export from Watersheds (NEWS) models and their application . Global Biogeochem Cycl. , 19 GB4S01, doi:10.1029/2005GB002606
- Smil , V . 2002 . Nitrogen and food production: proteins for human diets . AMBIO. , 31 : 126 – 131 .