Abstract
Many of the most cost-effective options for reducing emissions of hydrofluorocarbons (HFCs) involve: reducing leaks; responsible handling practices; replacement with a substance with little or no global warming potential; or reducing the amount of the greenhouse gas (GHG) needed. Some of these options can be implemented immediately for quick emission reductions. However, because many of the types of equipment that rely on these gases have lifetimes ranging from 10 to 30 years, fully implementing these emission reductions can take decades. Reductions in HFC consumption, however, can generally be seen more immediately. Recent US proposals for climate legislation have considered limits on HFC consumption under a cap separate from other GHGs. Whether and how such a cap would be implemented, and the economic efficiencies of such a framework, are the subject of considerable debate. Marginal abatement cost curves developed by the US Environmental Protection Agency are used here to examine possible reductions in HFC consumption, and their associated costs, against targets as envisioned in four proposals for US climate legislation. It is seen that such comparisons depend integrally on how the future growth of HFC consumption is projected; that is, what assumptions underlie the baseline. Furthermore, while it is determined that known options may not be available today to meet the policy proposals examined, current developments in the HFC market, along with the history of those markets in the ozone-depleting substances phaseout, provide indications that deeper reductions are achievable.
1. Introduction
The use of hydrofluorocarbons (HFCs) has allowed the rapid phaseout of ozone-depleting substances (ODS) – including halons, chlorofluorocarbons (CFCs), and hydrochlorofluorocarbons (HCFCs) – in applications for which other alternatives are not readily available. HFCs are expected to replace a significant portion of past and current demand for ODS in refrigeration and air-conditioning, insulating foams, propellants used in metered dose inhalers, specialized fire protection equipment, and in other applications. An increasing reliance on HFC use in these processes has in turn increased concern over emissions of these gases, many of which have high global warming potentials (GWPs).
HFCs are unique from other greenhouse gases (GHGs). HFCs, like other fluorinated GHGs (e.g. PFCs, SF6, NF3), are manufactured for specific uses; they are not generally emitted as a byproduct of other processes. Footnote1 More importantly, for many applications, HFCs have been, currently are, and/or in the future are expected to be the principal alternative for ODS, the consumption of which is being phased out by 196 signatories to the Montreal Protocol on Substances that Deplete the Ozone Layer. Because of this uniqueness, and the rapid global ODS phaseout being accomplished under the Montreal Protocol, many stakeholders – chemical producers, equipment manufacturers, environmental organizations, and legislative and regulatory officials – have examined the possibility of controlling HFCs in a similar manner as ODS.
Many recent US legislative proposals for controlling GHGs have recognized these unique aspects of HFCs. While the proposals chosen for this analysis included mandatory reductions of a basket of at least five other GHGs – CO2, CH4, N2O, PFCs, and SF6 – they handled HFCs used as ODS substitutes in a manner separate than the other GHGs. Each proposal controlled HFC consumption rather than emissions. Footnote2 Each adopted parts of the US Clean Air Act Title VI, which currently controls ODS consumption and emissions. Each set specific consumption limits on HFCs starting at least as early as CO2 controls begin, and reduced these limits over time, reaching a non-zero amount that was then held until 2050. Each specified reductions that went further and/or more quickly than reductions required for other GHGs. And finally, each separated HFC consumption from other GHG emissions, with no trading between the two groups allowed.
Previous works have studied many options for reducing emissions of HFCs (Schaefer et al. Citation2005; de la Chesnaye and Weyant Citation2006; US EPA 2006). These options involve reducing leaks, implementing responsible handling practices, replacing HFCs with a lower GWP substance, or reducing the amount of the GHG needed for a particular application. Often, these changes can also improve energy efficiency, reducing associated CO2 emissions. Some of these options (reducing leaks and improving handling) can be implemented immediately for quick emission reductions. However, because many of the types of equipment that rely on these gases, in particular air conditioning and refrigeration equipment, have lifetimes ranging from 10 to 30 years, fully implementing some of these other options can take decades, assuming there is no premature retirement or retrofitting of the previous equipment. These options would, however, see an immediate reduction in HFC consumption (i.e. when the new equipment is introduced), although consumption for servicing the former HFC-based equipment could still be required.
This article examines many such options in terms of how they reduce consumption. By comparing these reductions to forecasts of future HFC consumption, we determine whether these options are sufficient to achieve proposed controls. We also examine issues of timing, costs, and forecasting.
2 Methodology
2.1 Baseline scenario
To estimate business-as-usual (BAU) consumption of HFCs in the US, we rely on the Vintaging Model (US EPA 2009b) developed by the US EPA. This model provides a bottom-up estimate of the use and emissions of HFCs in over 60 end-uses that are phasing out ODS; detailed assumptions used in the model are available in US EPA 2009b. This BAU baseline is estimated assuming no further actions, apart from normal and expected incremental technological improvements, are taken to reduce HFC consumption and emissions. By generating two alternative baselines that assume slower growth, we also look at how projections of mitigated HFC consumption are affected by changes in this modeled baseline, and review how the resulting mitigated consumption estimates compare to proposed reduction schedules.
2.2 Policy scenarios
Many officials elected to the US Senate or House of Representatives have proposed legislation with the intention to reduce the emissions of GHGs in the US. Many of these proposals approach this goal by creating an allowance system for GHG emissions, and reducing those allowances over time under a cap-and-trade program. The method of allocating allowances – whether granted freely, sold based on specific terms, or auctioned – varies, as do the complementary programs, regulations, and incentives created to foster GHG reductions. provides a brief review of four such proposals. These proposals are not additive; that is, any final legislation would take the shape of one of these bills or would mix different aspects of different bills.
Table 1. Summary of greenhouse gas emission reduction proposals.
For this article, we look at these four proposals, labelled A through D, noting that each contains specific requirements to reduce the consumption of HFCs, such requirements being separate from controls on other GHGs. provides a summary of all four policy options as they apply to HFCs. Only Proposal A (GovTrack 2009a) specified what the HFC consumption cap would be in each and every year. Proposal B (GovTrack 2009b), an amendment to Proposal A, specified essentially the same amounts for years 2012, 2020, 2030, and 2040, but allowed discretion in the intervening years (provided annual declines occurred through 2040). To analyze Proposal B, we have assumed a “step-down” approach, i.e. the caps are held level until the specified years. Neither Proposal A nor Proposal B was passed into law during the Congress under which they were introduced. Proposal C (Committee on Energy and Commerce 2008), which was never passed by Committee and therefore never introduced to Congress, required determination of a baseline, and provided reduction ranges to be achieved in specific years; for analytical purposes, we have chosen values in those ranges that provide for the highest caps and again assumed a step-down approach. Proposal D (GovTrack 2009c), which passed the House of Representatives on 26 June 2009, also required the determination of a baseline, against which annual caps were set, but provided that the baseline must fall between two specific amounts; for analytical purposes, we have assumed the baseline is the highest level allowed. While these proposals contain other provisions related to HFCs, such as banking, offsets, and essential use exemptions, only the basic caps shown in are analyzed here.
Table 2. Summary of HFC policy scenarios (Tg CO2 Eq., % of baseline cap).
2.3 Reduction scenario and reduction options
A reduction scenario is developed by applying, within each sector, several technologies or practices (“options”) that have the potential to reduce HFC consumption. We rely principally on reduction options identified previously by the US EPA (US EPA 2006), although these options have been recast to determine specifically how they reduce consumption rather than emissions. GWPs are updated to reflect the Fourth Assessment Report (IPCC 2007). Implementation schedules (i.e. market penetrations over time) have also been revised to reflect start-up times in 2010 or later. Some readily-available cost assumptions were updated (e.g. refrigerant, electricity and gasoline prices, labor rates), although time did not permit a full reinvestigation of the costs of all options. The same discounted cash flow analysis is again used to estimate the “break-even cost” of achieving the reductions associated with each option, this time in terms of US dollars Footnote3 per tonne of CO2 equivalent consumption reduced ($ /t CO2 Eq.). As described below, one can develop a reduction scenario applying all the options identified, or one could choose a specific break-even cost to determine which options to apply in the reduction scenario.
A total of 15 reductions options are explored for the refrigeration and air-conditioning sector, 10 for foams, six for aerosols, three for solvents, and three for fire protection. The nature of the consumption reductions achieved by these options varies. For instance, in the insulating foams sector, several options explore the use of carbon dioxide, water, or hydrocarbons in lieu of HFCs; given the fact that all consumption for foams occurs during the manufacturing process, these options have an immediate effect on consumption once introduced. Several additional options not described in the US EPA, 2006 report have also been analyzed. A full discussion of these options is beyond the scope of this article; however, a brief summary of each is provided here:
HFO-1234yf in Motor Vehicle Air Conditioners (MVAC). HFO-1234yf, a hydrofluoro-olefin (i.e. an HFC with a carbon double bond), with a GWP of 4, is used in lieu of HFC-134a (GWP of 1,430) in new light-duty vehicles (passenger cars, pick-up trucks, sport utility vehicles). | |||||
HC-600a in Refrigerator/Freezers and Small Retail Food Equipment. In the US, most home refrigerator/freezers use HFC-134a as the refrigerant. Similarly, small retail food refrigerators (e.g. bottle coolers) use an HFC as the refrigerant. Based on technology available elsewhere, it is assumed that equipment running on isobutane (HC-600a) is introduced to the US. | |||||
HC-290 in Window Units and Residential Dehumidifiers. Propane (HC-290) is assumed to be used in lieu of HFCs for single-room applications, specifically for some window-mounted air conditioners and portable dehumidifiers. | |||||
Microchannel Heat Exchangers. New technology for producing smaller-sized heat exchangers is used for both unitary air conditioners and positive displacement chillers, reducing refrigerant charge sizes by approximately 35–40%. | |||||
Ammonia/CO2 in Industrial Process and Cold Storage Systems. Both ammonia (R-717) and carbon dioxide (R-744) have been used as refrigerants. Here, it is assumed these refrigerants achieve wider application, replacing some HFC-based equipment. | |||||
New Chemical in Unitary Air Conditioners. This option assumes a new chemical is developed to replace R-410A (a blend of HFC-32 and HFC-125) in many of the air-conditioning applications it is expected to dominate. The new chemical is assumed to have a GWP of approximately 1,000, about half that of R-410A (GWP of 2,087.5). | |||||
2.4 Marginal abatement cost curves
The marginal abatement cost (MAC) curve is derived by rank ordering individual reduction opportunities by $/t CO2 Eq. and plotting the corresponding consumption reductions cumulatively, for any given year. Each point along the MAC curve shows the cost of abating an additional ton of carbon-equivalent gas at the margin. The break-even price of each option determines its placement with respect to the y-axis. Moving away from the origin, each point on the curve represents a cumulative sum of reductions with respect to the x-axis. Points corresponding to a zero or negative $/t CO2 Eq. value along the y-axis demonstrate a market in which the benefits of reducing HFC consumption pay for the effort alone at the assumed 10% discount rate. Positive break-even values imply financial costs that are outweighed only if there exists some external value of consumption reductions (i.e. under a trading market, tax, other incentives), which make an investment cost-effective.
3 Results
3.1 Policy scenarios compared to the baseline
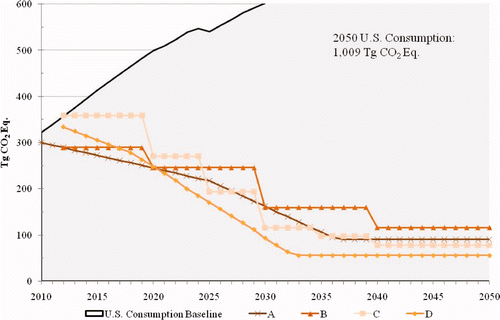
graphs the consumption baseline Footnote4 and the four proposals for HFC consumption limits summarized above. It is clear that all four proposals call for significant reductions compared to the baseline. Integrating over the 2012–2050 timeframe, reductions from the baseline required are approximately 18,000 Tg CO2 Eq. (Proposals B and C), 19,000 Tg CO2 Eq. (Proposal A), or 20,000 Tg CO2 Eq. (Proposal D).
Figure 1. US HFC consumption baseline and policy scenarios.
3.2 Reduction scenarios compared to the baseline
graphs the consumption baseline and four possible reduction scenarios: (1) with all options applied (all); (2) with all options estimated to cost below $50/t CO2 Eq. (all <$50); (3) with all options applied except the New Chemical in Unitary Air Conditioners option (available); and (4) all options estimated to cost below $50/t CO2 Eq. excluding the New Chemical in Unitary Air Conditioners option (available <$50). Integrating over the 2012–2050 timeframe, reductions achieved range from approximately 11,000 Tg CO2 Eq. (available <$50) to 19,000 Tg CO2 Eq. (all).
Figure 2. US HFC consumption baseline and reduction scenarios.
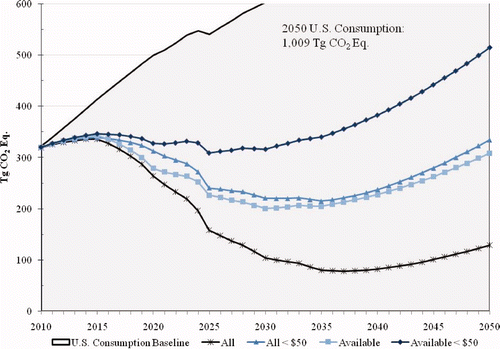
The cost exclusion at $50/t CO2 Eq. is a random choice of a cost that is seen to be possible in the 2015–2035 timeframe in many analyses of various climate bills (Murray and Ross Citation2007; Paltsev et al. Citation2007; US EPA 2008, 2009a). The decision to exclude the New Chemical in Unitary Air Conditioners option is made because this is the only option that appears completely theoretical at this time. All other options are either available today, are under significant research and development, or have been claimed to be available in the relative near term. That said, the extent and rapidity to which any option can penetrate the market would be the subject of great debate; a full analysis of such assumptions is beyond the scope of this article.
3.3 Marginal abatement cost curves
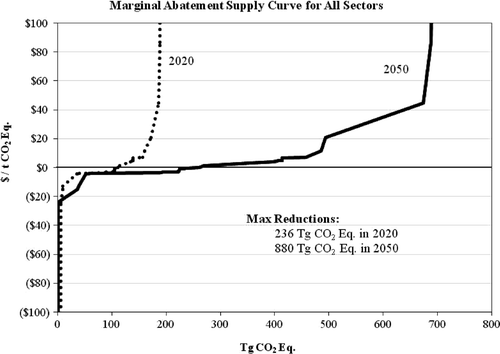
and show the HFC consumption baseline rising from about 500 Tg CO2 Eq. in 2020 to over 1,000 Tg CO2 Eq. in 2050. Consumption for refrigeration and air conditioning uses dominates total consumption in any year. Not surprisingly, reduction opportunities also dominate in this sector. Reductions approaching 200 Tg CO2 Eq. in 2020, and over 700 Tg CO2 Eq. in 2050, are available for the refrigeration and air conditioning sector. shows the MAC curve for all sectors, for years 2020 and 2050. Footnote5
Figure 3. Marginal abatement cost curves for US consumption, 2020 and 2050.
4 Discussion
4.1 Can policy options be met with the options analyzed?
below plots the range of caps for the policy proposals from and two of the reduction scenarios from (“all” and “available”). To compare the reduction scenarios to the policy proposals, we divide the discussion in terms of time frame, roughly 2010–2020, 2020–2035, and 2035–2050.
Figure 4. US HFC consumption baseline, reduction scenarios, and policy scenarios.
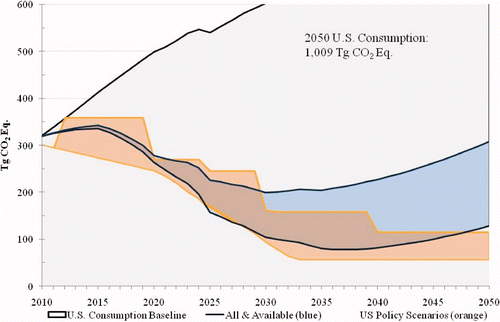
In the early time frame, placing the cap at the proper amount is important. Previous work details the time-lag required to achieve reductions (Schaefer et al. Citation2005), so one might not expect much reduction from the baseline in 2012. Placing a cap too high would leave little incentive to reduce HFC consumption. Placing a cap too low could lead to HFC shortages and continued reliance on ozone-depleting (and global-warming) gases such as HCFCs. However, even the near-term baseline can be difficult to determine and current predictions vary considerably.
In the middle time frame, it is seen that concerted effort to reduce HFC consumption and introduce alternatives can bring dramatic decreases. For example, in this time frame, it is possible that most new light duty vehicle air conditioners could be made with an HFC alternative, and the bank of such HFC-134a equipment, and hence the HFC-134a needed to service that equipment, could be nearly eliminated. For most of this time frame, it appears possible to meet the various policy proposals analyzed, if all reduction options are implemented. In the lower (all) reduction scenario in , it is assumed that a new chemical with lower GWP has been fully implemented in new unitary air conditioners by 2025; in the higher (available) reduction scenario, this option is not applied. Comparing the two reduction scenarios emphasizes the importance of realizing this option.
In the latter time frame, HFC consumption rises above the targets set by the proposals. Because there is still some HFC use, and this use is assumed to grow with (but not necessarily at the same rate as) economic and population growth, eventually caps are exceeded. This stresses the importance of growth assumptions, and the need for efforts to reduce use and implement alternatives.
4.2 How important is the baseline?
and are similar to except that here two alternative baselines are plotted with the policy proposals. Alternative Baseline 1 is derived using the same model as the original baseline, but three major changes are made. First, annual growth rates for light-duty MVACs, previously only updated through 2006, are updated with 2007 and 2008 data and projections of future sales through 2030 (EIA 2009). Second, new information that shows recent reductions in MVAC charge size is incorporated; hence, average charge sizes of 0.55 kg begin in 2007 for light-duty passenger cars, and 0.79 kg in 2006 for light-duty passenger trucks, vans and sport utility vehicles. Footnote6 Third, starting in 2030 the assumed growth rate for all end-uses is set to 0.8%, approximating the predicted population growth in the US. For most end-uses, this is a reduction in the assumed demand for new products and hence a lowering of the consumption baseline beginning in 2030. Alternative Baseline 2 is similar to the above, except the 0.8% growth rate assumption is applied to all end-uses (including MVACs) beginning in 2010. Because the reduction scenarios depend on the baseline, such scenarios corresponding to the alternative baselines are also plotted in and .
Figure 5. US HFC consumption baseline, alternative baseline, reduction scenarios, and policy scenarios.
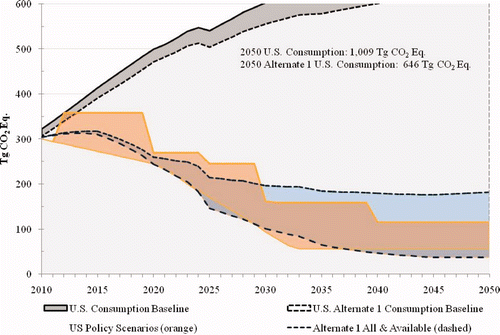
Figure 6. US HFC consumption baseline, alternative baseline 2, reduction scenarios, and policy scenarios.
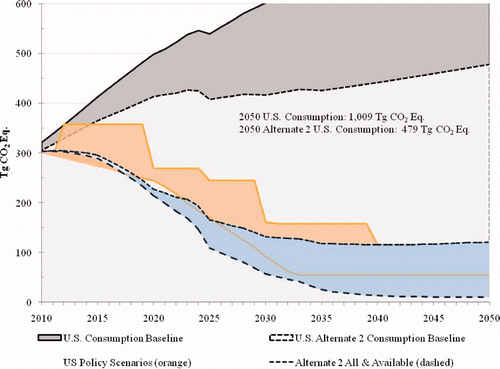
The lower charge size and sales in mobile AC has a noticeable effect during the earlier years. In Alternate Baseline 1, the various policy caps in 2020 can either be mostly or entirely met by the available and all reduction scenarios, respectively. The policy caps in 2020 are met by both reduction scenarios in Alternate Baseline 2. While consumption still increases in the latter years, for Alternate Baseline 1, the reduction scenario with available options applied eventually exceeds the caps, whereas the caps are met by the all options reduction scenario. For Alternate Baseline 2, the most strict caps are met with all options applied, beginning in 2018. The higher cap can generally be met without an alternative refrigerant used in unitary air conditioning as well; however, the lower cap cannot be met without this alternative.
4.3 Are high cost options realistic?
Theoretically, one would expect to see the lowest cost options implemented first, while higher cost options would not be implemented until later. However, a view of the industry might suggest otherwise. For instance, for many years now the MVAC industry has been developing CO2 and HFO-1234yf as alternative refrigerants. One if not both of these are likely to enter the market soon. Some industry representatives expect such a change in the US regardless of whether there is a mandate for HFC consumption reductions, noting that the use of a lower-GWP MVAC refrigerant would provide credit in meeting vehicle GHG emission reductions proposed in California (CARB 2010) and nationally (FARA 2009). Also, at least one major home refrigerator maker has announced plans to bring hydrocarbon-based equipment to the US. Yet despite these trends, all these options are estimated to be in the upper cost range, well above $100/t CO2 Eq.
Furthermore, it should be noted that, for this analysis, the costs developed do not change over time. However, as is seen in many instances, while costs for a new technology may be high when it is introduced, higher production volumes and expanding competition often help reduce typical costs. There is no evidence to suggest that such lowering of costs, as was seen in many instances during the transition out of ODS, would not be seen under an HFC consumption reduction policy. Accounting for such changes is beyond the scope of this article.
These issues imply the need to further study the costs of each option, and how those costs might change over time. Further, these issues point to the need to develop a fuller understanding of what factors, besides theoretically following costs, are likely to bring about the implementation of a GWP-reduction option.
4.4 Are further reductions available?
The situation with replacements for HFCs now is similar to that faced when the Montreal Protocol was signed. For instance, in 1990, when US Clean Air Act Amendments were signed requiring a phaseout of CFCs, some alternatives were known but many gaps existed. Similarly, although an international industry consortium had begun in 1991 to find HCFC-22 alternatives, final answers were not clear in 1992, when the Copenhagen Amendment to the Montreal Protocol, calling for a phaseout of HCFCs, was developed. With a policy framework established, however, the industries reacted and have now found alternatives for nearly all former ODS uses. Likewise, with the options identified and available today or in the near future, HFC consumption can be significantly decreased, in many years meeting the policy proposals examined. However, other alternatives, or further reductions from the identified options, may be needed to meet the policy proposals in all years.
The ODS phaseout regulations helped spawn a philosophy of conservation amongst users of the chemicals, the discovery of effective alternatives by those producing the chemicals, and the testing and deployment of innovative technologies from those manufacturing products that use those chemicals. This history, of the same industries now facing a possible phase down in HFC consumption, provides confidence that the reduction options discussed in this article can be achieved, and that reductions beyond those foreseen here will be realized.
Acknowledgements
The authors would like to acknowledge Pamela Mathis, Mollie Averyt, and Jean Kim of ICF International for developing the reduction options presented in this paper, and Tristan Kessler and Veronica Kennedy for their contribution to the underlying analyses.
Additional information
Notes on contributors
David S. Godwin
Any opinions expressed in this paper are those of the authors and not necessarily those of the U.S. Environmental Protection Agency.Notes
1. HFC-23 is an exception. Although HFC-23 does have some specific uses for fire protection, semiconductor manufacturing and cryogenic refrigeration, the majority of HFC-23 emissions occur as a by-product in the manufacture of HCFC-22.
2. Consumption is defined as production plus import minus export. Because HFCs are intentionally produced, the legislative approaches focus on upstream controls on consumption – mirroring the approach taken under the Montreal Protocol – rather than downstream controls on emissions.
3. All costs in this article are reported in 2008 US dollars.
4. For clarity, the consumption from 2030 to 2049 is not shown. The consumption baseline rises approximately linearly to reach the amount stated on the graph.
5. For clarity, only costs within $100/t CO2 Eq. of zero are shown.
6. Similar types of information for deriving the original baseline are found in US EPA 2009b.
References
- California Air Resources Board [Internet] . 2010 . Clean car standards – Pavley, Assembly Bill 1493; [cited 2010 Jan 28] Available from: http://www.arb.ca.gov/cc/ccms/ccms.htm
- Committee on Energy and Commerce [Internet] . 2008 . Climate change legislation Available from: http://energycommerce.house.gov/index.php?option=com_content&view=article& id=953&catid=152:110th-legislation&Itemid=58 [cited 2010 Jan 14]
- de la Chesnaye F Weyant J [Internet] Multi-greenhouse gas mitigation and climate policy 2006 Energ J. Special Issue. Avaiable from: http://www.stanford.edu/group/EMF/projects/projectemf21.htm [cited 2009 May 27]
- EIA [Internet] . 2009 . Updated annual energy outlook 2009 Reference case service report, April 2009 Available from: http://www.eia.doe.gov/oiaf/aeo/ [cited 2009 May 15]
- Federal Archives and Records Administration . 2009 . Proposed rulemaking to establish light-duty vehicle greenhouse gas emission standards and corporate average fuel economy standards . 74 Federal Register , 186 ( 2009 Sept 28 ) : 49510 – 49512 .
- GovTrack [Internet] . 2009a . S. 2191: Lieberman–Warner Climate Security Act of 2007 Available from: http://www.govtrack.us/congress/bill.xpd?bill=s110-2191 [cited 2010 Jan 14]
- GovTrack [Internet] . 2009b . S. 3036: Lieberman–Warner Climate Security Act of 2008 Available from: http://www.govtrack.us/congress/bill.xpd?bill=s110-3036 [cited 2010 Jan 14]
- GovTrack [Internet] . 2009c . H.R. 2454: American Clean Energy and Security Act of 2009 Available from: http://www.govtrack.us/congress/bill.xpd?bill=h111-2454 [cited 2010 Jan 14]
- IPCC [Internet] . Climate change 2007 – the physical science basis . Contribution of Working Group I to the Fourth Assessment Report of the IPCC . Available from: http://www.ipcc.ch/ipccreports/ar4-wg1.htm [cited 2009 May 15]
- Murray , B C and Ross , M T [Internet] . 2007 . The Lieberman–Warner America's Climate Security Act: a preliminary assessment of potential economic impacts Available from: http://www.nicholas.duke.edu/institute/econsummary.pdf [cited 2009 May 27]
- Paltsev , S , Reilly , J , Jacoby , H , Gurgel , A , Metcalf , G , Sokolov , A and Holak , J. [Internet] . 2007 . Analysis of the cap and trade features of the Lieberman–Warner climate security act (S. 2191) in assessment of US cap-and-trade proposals Available from: http://globalchange. mit.edu/pubs/abstract.php?publication_id=718 [cited 2009 May 27]
- Schaefer , D O , Godwin , D and Delhotal , C . The sensitivity of emission reductions to lead times in sectors with long-lived infrastructure: a case study focusing on air conditioning and refrigeration . Proceedings of the Fourth International Symposium on Non-CO2 Greenhouse Gases, NCGG4 . July 4–6 2005 , Utrecht, The Netherlands. Edited by: Van Amstel , A. Amersterdam : Millpress .
- US EPA. [Internet] . 2006 . Global mitigation of non-CO2 greenhouse gases (EPA Report 430-R-06-005) Available from: http://www.epa.gov/climatechange/economics/downloads/GlobalMitigationFullReport.pdf [cited 2009 May 27]
- US EPA. [Internet] . 2008 . EPA analysis of the Lieberman–Warner climate security act of 2008: S. 2191 in 110th Congress Available from: http://www.epa.gov/climatechange/downloads/s2191_EPA_Analysis.pdf [cited 2009 May 27]
- US EPA. [Internet] . 2009a . EPA preliminary analysis of the Waxman-Markey Discussion Draft: The American Clean Energy and Security Act of 2009 Available from: http://www.epa.gov/climatechange/economics/pdfs/WM-Analysis.pdf [cited 2009 May 27]
- US EPA. [Internet] . 2009b . Inventory of US Greenhouse Gas Emissions and Sinks: 1990–2007 Available from: http://epa.gov/climatechange/emissions/usinventoryreport.html [cited 2009 May 15]