Abstract
Biogas and bio-methane that are based on energy crops are renewable energy carriers and therefore potentially contribute to climate protection. However, significant greenhouse gas (GHG) emissions resulting from agricultural production processes must be considered. Among those, the production and use of fertilizer, and the resulting leaching of nitrous oxide (N2O), are crucial factors. This article provides an integrated life cycle assessment (LCA) of biogas (i.e. bio-methane that has been upgraded and injected into the natural gas grid), taking into account the processes of fermentation, upgrading and injection to the grid for two different types of biogas plants. The analysis is based on different feedstocks from crop rotation systems for different locations in Germany. A special focus is on the sensitivity of assumptions of nitrous oxide emissions to overall GHG emissions. Much research exists on the measurement or modeling of the actual N2O emissions that result from farming processes. Since there is as yet no precise regional data, most analyses use tier-1 data from the IPCC national GHG inventories as a default. The present article coincides with recent research in indicating that this data varies at the regional level. However, it is not the scope of the article to evaluate the quality of existing data for N2O emissions, but to show the effects of different assumptions on the LCA of GHGs from bio-methane. Thus, a link between the provision of emission data and the practical implementation of biogas technology is provided. The main result is that the supply chain of substrates from agricultural processes appears to contribute the most to the GHG emissions of bio-methane. The “worst case” scenario where 5% of the nitrogen fertilizer used is emitted in form of N2O shows that the GHG mitigation potential of bio-methane versus natural gas is very small, so there is not much margin for error in the plant technology.
Introduction
Biogas is produced through fermentation of wet biomass. Unlike most European countries, most plants in Germany use energy crops from dedicated farming as a feedstock, rather than residues or sewage gas.
Since late 2006 several projects for injection of upgraded biogas into the natural gas grid have been set up. The aim is to use the existing infrastructure to distribute the bio-methane to a larger number of end users. Bio-methane – defined as raw biogas after upgrading – as a perfect substitute for natural gas can thus be used in combined heat and power (CHP) applications as well as for provision of domestic heat or as an alternative vehicle propellant.
Considering the process of upgrading, injection and distribution to different end users, the biogas industry has moved forward from the local, small-scale “on-site” energy supply model to new markets and possibilities. However, there is still debate as to what role bio-methane can play as a regional, agricultural energy carrier, and as to its climate impact.
The author provides an integrated life cycle assessment (LCA) of biogas (respectively bio-methane after upgrading and injection into the natural gas grid), taking into account two different types of biogas plants: (1) the current state-of-the-art as an industrialized but average efficiency biogas plant in the year 2008 (labeled “state-of-the-art”) and (2) a new, large-scale plant with optimized technology, representing already the next generation of biogas plants by widely exploiting the optimization potential of the near future (labeled “optimized technology”). The focus is thus on large biogas plants (≥1000 Nm3/h); the given results do not, therefore, hold in any case for small-scale, agricultural biogas plants. The two different types of plants and the specific technical features are outlined in section 2.
Already, several studies regarding the overall greenhouse gas (GHG) emissions and LCA of biogas or bio-methane based on energy crops exist (e.g. German Biomass Research Centre (Deutsches Biomasse Forschungszentrum, DBFZ) (2009), Institute for Energy and Environmental Research (Institut für Energie- und Umweltforschung, ifeu) (2008), Institute for Energetic and Environment (Institut für Energetik und Umwelt, IE) (2007), Wuppertal Institute, Institute for Energetic and Environment, Fraunhofer UMSICHT, Gas-Heating-Institute (2006)) have been published. As has been shown by Soukup (Citation2008), comparison of the results is rather difficult as the LCA depends strongly on the feedstock used, the technology applied, and the assumptions taken for the agricultural and technical aspects. In addition, the functional unit as well as the system boundaries vary. Thus, the relevant assumptions for the presented analysis are laid out in this article.
The analysis is not only based on system engineering but also on different feedstock provided in crop rotation systems for different locations in Germany. The focus of this article is, however, to analyze the effects from different assumptions regarding nitrous oxide emissions to the climate protection potential of bio-methane, produced in different configurations of plants. The results of the sensitivity analysis regarding the assumptions on nitrous oxide emissions and the effects to the LCA are presented in section 5.
Technological process chain: bio-methane
The technological process chain of bio-methane is explained in the following scheme. Simplified, the process chain can be divided into four steps: (1) provision of substrates, (2) fermentation to biogas through anaerobic digestion, (3) upgrading of the raw gas to the same quality as natural gas, (4) handling of digestates. The provision of the energy needed for the operation of the reactor and the upgrading unit can be seen as a fifth step. In all process steps GHG emissions can develop directly through leakage of methane, or indirectly through the use of fossil energy or agricultural processes.
The four process steps will be briefly described in the next paragraphs. The input data to the LCA for both plant configuration types as resulting from the description are listed in .
Table 1. Input data for the LCA for the plant configuration types: state of the art and optimized technology.
Step one: provision of substrates
This step includes the cultivation and harvest of the energy crops as well as the ensilage. Illustrative, maize will be taken as a reference crop, while the full LCA has been made for five different crop rotation systems. Most relevant are the data on N-P-K-fertilizers, lime, pesticide, and diesel used in machinery. This data has been provided by Vetter et al. (Citation2009) and represents the actual situation on five different locations in Germany.
Furthermore, emissions of nitrous oxide from microbial processes in the soil have been taken into account to the amount of 1% of the deployed nitrogen fertilizer (IPCC Citation2006). This assumption and the given effect will be examined closer in section 5 of this article.
During ensilage of substrates material losses between 5% and 15% occur, according to Association for Technology and Structures in Agriculture (Kuratorium für Technik und Bauwesen in der Landwirtschaft e.V., KTBL) (2007). Those numbers have been chosen as maximum and minimum value for the two plant configuration types.
Step two: fermentation
In the reactor itself there can be leakage of methane due to improperly sealed elements, diffusion from gas-bearing parts or process disturbances. The exact amount of leakage is not exactly scientifically assessed yet, so there is the need for further examination and the quality of data is lower than for the other figures. In accordance with previous studies (as in Bavarian federal office for agriculture (Bayerische Landesanstalt für Landwirtschaft) (Citation2007) and Institute for Energy and Environmental Research (Institut für Energie- und Umweltforschung, ifeu) (2008)) a value of 1% of the methane production has been applied. Since accurate measurements have not been done it is assumed that emissions will be halved for the optimum case presented in the optimized technology.
Another important parameter is the yield of crude biogas that can be achieved during the digestion. It depends a lot not only on the constitution and quality of substrate but also on the construction of the reactor itself. So far, for maize as reference crop, for the calculation a value of 200 m3 per ton of fresh mass (tFM) has been used (Agency for Renewable Resources (Fachagentur Nachwachsende Rohstoffe e.V.) 2006), but operating experience from plant operators shows that even today 10–20% more can be achieved.
Step three: handling of digestates
As mentioned before, the LCA is done for large-scale professional operated plants, so it is assumed that the storage of digestate is fully covered and no methane leakage will occur at this point. Nevertheless, in the sensitivity analysis the effects of a not completely covered storage will be explored to give a perspective of the importance of this section.
The digestate will be returned to the cultivation of the crops and deployed as fertilizer. The nutrients are not decomposed during the digestion and phosphate and potassium can be fully regained. Between 50% and 70% of nitrogen in the digestate is plant available and can substitute for mineral nitrogen fertilizer (Gutser Citation2008).
Step four: upgrading
The pressure swing adsorption (PSA) is chosen as an example for upgrading technologies to be depicted in this article. Highly relevant is the slip rate of methane, which is about 2% with most PSA procedures (Fraunhofer UMSICHT Citation2008/2009). As methane slips have been regulated since the beginning of 2009 in Germany (Federal Environmental Agency Brandenburg Citation2008), currently it is the common method to put a burner after the PSA to convert the methane catalytically or thermally to carbon dioxide. Again, for both plant configuration types a methane slip following treatment of 0.01% is assumed.
Energy supply
For the operation of the biogas plant and the upgrading facilities, energy is needed in form of heat for the reactor and electricity for the stirring unit and pumps. The PSA needs electrical and thermal energy, as well. The data are taken from Fraunhofer UMSICHT (Citation2008/2009) and from the plan operator.
Greenhouse gas emissions factors of bio-methane
Two different types of biogas plants have been the focus of the study: the current state of the art as well as a new, large-scale plant as an optimum case (“optimized technology”). The input parameters for both vary regarding the material loss in ensilage; the yield of raw gas achieved and the methane leakage from the reactor can be taken from . As the focus in this section is on the effects of plant technology and the differences between the two plant configurations only maize is taken as feedstock.
shows the results of the LCA for the GHG emission factors of both plants and the sensitivity analysis. Both plants are operated in a professional way; nevertheless the difference between both types is clearly visible (). Compared to the state of the art plant, GHG emissions can be decreased by about 30% with optimized technology mostly through a better yield of raw gas and less methane leakage. It is obvious that the provision of substrates is the main factor for GHG emissions once the plant operating technology is optimized. This should be examined further for optimization. Emissions occur mostly due to the use of energy for the production of farming utilities as fertilizer, pesticide, etc. and the use of fuel in machinery.
Figure 1. The bio-methane process chain.
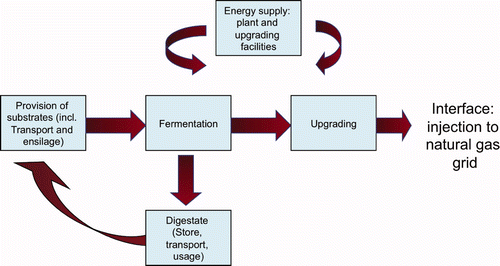
Figure 2. GHG factors of the process chain bio-methane: sensitivity analysis. Variant 1: increased methane leakage in reactor (1.5% instead of 1%); Variant 2: increased methane slip in PSA (no after treatment, slip of 2% instead of 0.01%); Variant 3: digestate storage not completely covered – moderate emissions of 2.5% of gas stored. Red line: GHG emissions of natural gas.
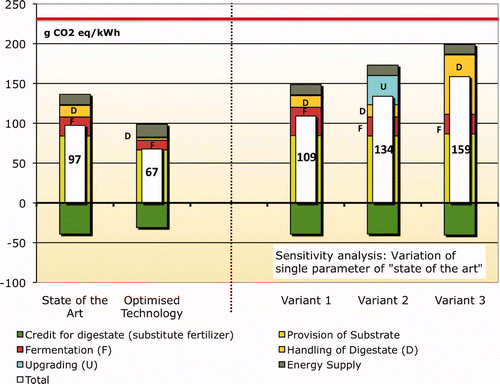
The results of the thus calculated LCA were opposed to the overall emissions of natural gas. Assuming that bio-methane as a perfect substitute can be used in any way that natural gas can, the climate protection potential of bio-methane can in one approach be seen as the difference between the GHG intensities of both energy carriers. The emissions for the exploration, transportation, and energetic use of natural gas, according to the Joint Research Centre (Citation2007) sum up to about 230 g CO2eq/kWh (illustrated through the red line in ).
Figure 3. GHG balance of bio-methane from different substrates in regionally adjusted crop rotation systems

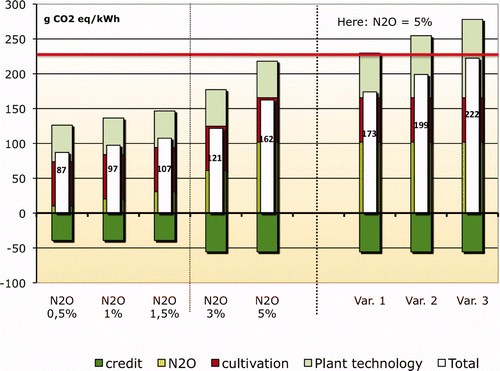
Figure 4. Sensitivity analysis: effects of different assumptions of N2O emissions to the overall GHG balance in the state-of-the-art biogas plant. Variant 1: increased methane leakage in reactor (1.5% instead of 1%); Variant 2: increased methane slip in PSA (no after treatment, slip of 2% instead of 0.01%); Variant 3: digestate storage not completely covered – moderate emissions of 2.5% of gas stored. Red line: GHG emissions of natural gas.
In order to categorize emissions from the process, it can be stated that about 25% of emissions from the provision of substrate are due to nitrous oxide from soil processes (as will be further explained in the next section). Thus, about one-fifth of the overall emissions are nitrous oxide, another 12–17% are methane from leakage. The biggest part therefore is still carbon dioxide emissions.
Provision of substrates – regional adjusted crop rotation systems
In cooperation with agricultural experts (Vetter et al. Citation2009), for five different locations throughout Germany (Dornburg, Gülzow, Güterfelde, Ascha, Soest) regionally adjusted crop rotation systems for the provision of biogas substrates were composed. They all contain maize as the most advantageous energy crop due to the high yield of raw gas as well as the high agricultural yield per acreage, but they all contain different crops as well, as they are typical and well known in the specific regions. For the LCA only, crops are considered that are used exclusively for biogas production. The substrates from a location are digested together as a mixture in the fermenter. shows the feedstock mix from each location.
Table 2. Composition of biogas substrates at the five locations.
The approach was not so much to not use maize, but to use not only maize, in order to contribute to a more diversified agriculture. So, a combined cultivation of rye and sorghum is applied in Güterfelde in a rather dry location and in Dornburg, while in the Soest and Gülzow two different kinds of whole-crop silage were calculated. In Ascha, a mixture of the grasses hairy vetch (vicia villosa), crimson clover (trifolium incarnátum), and Italian ryegrass (lolium multiflorum) was tested. The results of all substrate mixtures processed in a plant according to the “optimized technology” are shown in .
The columns for “cultivation” include the use of diesel for drilling, maintenance, and harvest as well as the application of pesticide and fertilizer (potassium, phosphate, nitrogen, magnesium, lime). As nitrous oxide emissions are in the focus of this article they are depicted separately. In “plant technology”, the emissions from the reactor itself, the upgrading unit, and from the energy supplied are summarized.
As can be seen from the results as shown in , the difference between the five locations varies only between 78 g CO2 eq/kWh (Dornburg) and 88 g CO2 eq/kWh (Güterfelde and Soest) if optimized technology is applied and the credit for use of digestate instead of mineral fertilizer is taken into account. Doing so is well in line with the current state-of-the-art, as both plant operator as crop cultivator benefit from the substitution of mineral fertilizer because it increases the ecological benefit and reduces the necessary expenses.
The given results for the five locations have to be compared to 67 g CO2 eq/kWh that result from the use of maize as the only feedstock in plants according to optimized technology, when average data for the supply of maize is used.
One aim of the examination was to prove that there are choices other than just maize as substrate that still can result in acceptable GHG balances. So there is no need to plant maize in large-scale monocropping farms, which is strongly not recommended from a biodiversity, ecological, and even agricultural point of view as monocropping may allow pests and rodents to spread and is not in line with good agricultural practice.
Another aim was to get away from average data for whole Germany and base the LCA on data collected from real situations and locations, which provide a good overview about the different regions in Germany. Thus, a bandwidth of locations was chosen regarding for different typical soil qualities and weather conditions.
Effects of nitrous oxide emissions to the climate PROTECTION potential of bio-methane
Nitrous oxide emissions are not the most important factor in the overall GHG balances but they still play a role. In the above described examinations and results, a value of 1% of deployed nitrogen fertilizer was assumed following the IPCC national GHG inventories (IPCC Citation2006). A lot of recent international research (NCGG-5 Citation2009) indicates, however, that this data might be much too low (Crutzen et al. Citation2008). As indicated, this factor of 1% should be multiplied by 3 or even 5, while on the other hand preliminary tests with nitrification inhibitors show that at least for some German locations the N2O emissions could be halved to 0.5% (Wulf Citation2002; Leick Citation2003). Aside from that there are critical voices (Robert Citation2008) claiming the percentaged approach is not useful as local soil and weather specification have an important impact.
Given this partly controversial discussion the question remains: What are realistic GHG emission factors for the production and use of biogas from agricultural feedstock and how large are the resulting GHG reduction potentials? Thus, the author cannot contribute to solving the discussion regarding whether it should be 1 or 5%; instead it is the aim of this article to show how much the different values for N2O emissions affect the overall climate protection potential of biogas.
Therefore in a sensitivity analysis values from 0.5 to 5% were calculated in the plant according to the current state-of-the-art. It has to be noted that different approaches are used: IPCC (Citation2006) does not follow a complete life cycle approach but the tier-1 factor in general has been derived to attribute emissions to a certain “polluter”. So the 1% quoted refers to direct plot emissions of the fertilizer deployed. They apply not only to any substitute fertilizer but also to the digestate. In a rough estimation “indirect” emissions were assumed to be an additional 0.5%, summing up to 1.5%. The results from these emission factors and the “best case” assumption according to Wulf (Citation2002) and Leick (Citation2003) as input to the LCA are depicted in the three columns on the left hand side of the diagram in .
On the other hand, the 3–5% N2O emissions according to Crutzen et al. (Citation2008) refer to freshly fixed reactive nitrogen only, assuming that the conversion from nitrogen to nitrous oxide has to be accounted for only once in the whole life cycle. Therefore no additional N2O is emitted from the digestate, leading to an increased credit for the usage as a substitute for mineral fertilizer.
The results are again compared to the overall emissions of natural gas as explained in section 3.
It is obvious, that the climate protection potential of bio-methane is higher the lower the assumed N2O emissions are. The first four columns are for the biogas plant of today's state-of-the-art, as described before. If the digestate is used as fertilizer, as it is customary in Germany, potential still remains for climate protection even if the nitrous oxide emissions rise to 5%. However, bio-methane is far from being an energy carrier with “no climate impact”.
If as a “worst case” taken from the current discussion, 5% of deployed nitrogen fertilizer is emitted as nitrous oxide, this means for the production of bio-methane, current state-of-the-art technology is just good enough to keep the advantage above natural gas. Technology of lesser standards and higher emissions will produce bio-methane with a higher GHG intensity, as the three columns on the right side of show. Depicted are the same variants as in , only assuming N2O emissions of 5% of the deployed nitrogen fertilizer.
The climate protection potential is alarmingly small. If there is methane leakage only to the amount of 2.5% from the digestate storage it is not possible to reduce GHG emissions by using bio-methane instead of natural gas. If the credit of digestate is not used for fertilizer – which is rather unlikely – the GHG balance is even higher that for the fossil energy carrier.
Conclusions
Two different types of biogas plant configurations have been closely examined and analyzed: a plant according to the state-of-the-art and one deploying the currently most optimized technology. The results of the LCA do not hold in any case for small-scale plants that might not be not equally professionally operated.
Once the technology is optimized to the point of only small methane leakage from the reactor, a considerable yield of raw gas from the substrates and most importantly a closed storage for digestate, the cultivation of substrates contributes to the largest amount of GHG emissions in the whole process chain.
Most GHG gases from the production of bio-methane are still carbon dioxide emissions, but methane from direct leakage and nitrous oxide from microbial processes play a role as well.
Bio-methane can be produced from energy crops from dedicated farming without harming or negatively affecting the environment if regionally adjusted crop rotation systems are deployed. Aside from maize, there are various crops that result in nearly the same GHG balances – so there is no need for monocropping of maize.
The current controversy discussed matter of nitrous oxide emissions from organic processes can be of high importance to the overall GHG balance of bio-methane. Analysis shows that if the “worst case” of 5% of deployed nitrogen fertilizer has to be assumed, there is not much margin of error for the plant technology. If the current state-of-the-art technology is deployed, for example, even minor leakage of methane from the digestate storage can diminish the GHG difference of bio-methane to natural gas to nearly zero, thus annihilating the climate protection potential of the energy carrier.
References
- Agency for Renewable Resources (Fachagentur Nachwachsende Rohstoffe e.V.) . 2006 . Assistance for biogas production and usage (available in German: Handreichung Biogasgewinnung und – nutzung) , Gülzow : FNR (Fachagentur Nachwachsende Rohstoffe e.V., (Agency for Renewable Resources)) .
- Association for Technology and Structures in Agriculture (Kuratorium für Technik und Bauwesen in der Landwirtschaft e.V., KTBL) . 2007 . Reference values for biogas (available in German: Faustzahlen Biogas) , Darmstadt: FNR (Fachagentur Nachwachsende Rohstoffe e.V., (Agency for Renewable Resources)) .
- Bavarian federal office for agriculture (Bayerische Landesanstalt für Landwirtschaft) . 2007 . Climate balance for electric power from biogas – balance of energetical use of biogas from manure and energy crops (available in German: Klimabilanz für Biogasstrom Klimabilanz der energetischen Nutzung von Biogas aus Wirtschaftsdüngern und nachwachsenden Rohstoffen). Freisingen
- Crutzen , P J , Mosier , A R , Smith , K A and Winiwarter , W . 2008 . N2O release from agro-biofuel production negates global warming reduction by replacing fossil fuels . Atmos Chem Phys. , 8 : 389 – 395 .
- Federal Environmental Agency Brandenburg . Monitoring of biogas plants . Presentation at expert conference Biogas . Brandenburg. (available in German: Überwachung von Biogasanlagen. Available from: http://eti-brandenburg.de/fileadmin/eti_upload/downloads2008/05_Tschiedel-Ueberwachung-Biogasanlagen.pdf, last accessed 23/05/2009)
- Fraunhofer UMSICHT . 2008 . Technologies and costs of conditioning biogas and feed-in into the natural gas network (available as well in German: Technologien und Kosten der Biogasaufbereitung und Einspeisung in das Erdgasnetz Ergebnisse der Markterhebung 2007–2008). Oberhausen. Available from: http://www.dena.de/en/topics/renewable-energies/publications/publikation/biomethane-report, last accessed 10/01/2010
- German Biomass Research Centre (Deutsches Biomasse Forschungszentrum, DBFZ) . 2009 . Economical and ecological assessment of substitutes for natural gas based on energy crops (available in German: Ökonomische und ökologische Bewertung von Erdgassubstituten aus nachwachsenden Rohstoffen) , Leipzig : FNR . Available from: http://www.fnr-server. de/ftp/pdf/literatur/pdf_387-3320002_dbfz_endbericht_biomethan_nawaro_2009.pdf, last accessed 02/04/2010
- Gutser , R . The effects of nutrients and humus determine the excellence of organic fertilizer (available in German: Nährstoff- und Humuswirkungen bestimmen die Vorzüglichkeit organischer Dünger) . Presentation at 5th Conference of Plant Cultivation . Jan 25 2008 , Munic. Technical University .
- Institute for Energetic and Environment (Institut für Energetik und Umwelt, IE) . 2007 . Key data greenhouse gas emissions (available in German: Schlüsseldaten Klimagasemissionen: Welchen Beitrag kann die Biomasse zum Klimaschutz leisten?) Leipzig. Available from: www.ufop.de/downloads/Bericht_Klimagas.pdf, last accessed 23/05/2009
- Institute for Energy and Environmental Research (Institut für Energie- und Umweltforschung, ifeu) . 2008 . Basis data for GHG balances of process chains of biogas and compilation of new balances (available in German: Basisdaten zu THG Bilanzen für Biogas-Prozessketten und Erstellung neuer THG-Bilanzen) On behalf of E.ON Ruhrgas AG. Heidelberg
- IPCC . 2006 . IPCC Guidelines for National Greenhouse Gas Inventories, Prepared by the National Greenhouse Gas Inventories Programme , Japan : Institute for Global Environmental Strategies .
- IPCC . 2007 . IPCC fourth assessment report: climate change 2007 , Cambridge University Press .
- Joint Research Centre . 2007 . Well-to-wheels analysis of future automotive fuels and power trains in the European context Available from: http://ies.jrc.cec.eu.int/Download/eh, last accessed 23/05/2009
- Leick , B CE . 2003 . Emission of ammonia (NH3) and nitrous oxide (N2O) from agricultural soils in dependency of production-related measurement. Dissertation at the faculty for agricultural science [dissertation] (Available in German: Emission von Ammoniak (NH3) und Lachgas (N2O) von landwirtschaftlich genutzten Böden in Abhängigkeit von produktionstechnischen Maßnahmen). University Hohenheim
- NCGG-5 . 2009 . Fifth International Symposium on Non-CO2 Greenhouse Gases Science, Reduction Policy and Implementation, 2009 June 30–July 3; Wageningen, The Netherlands. Available from: www.ncgg5.org, last accessed 10/01/2010
- Robert , E . 2008 . Joint Research Centre, European Commission, Institute for Energy –Renewable Energies Unit Personal communication
- Soukup , O . 2008 . Compilation of product life cycle assessment based on material flow networks for the production of biogas for injection into the natural gas grid (available in German: Erstellung von Produktökobilanzen auf Basis von Stoffstromnetzen für die Bereitstellung von Biogas zur Einspeisung in das Erdgasnetz Diplomarbeit). [master thesis]. Wuppertal
- Vetter , A , Grebe , S , Beck , J and Scheftelowitz , M . 2009 . Suitability and availability of various agricultural systems for the production of biogas substrates at model regions in Germany (available in German: Eignung und Verfügbarkeit verschiedener Anbausysteme für die Produktion von Biogassubstraten auf Modellstandorten in Deutschland) Thuringian federal office for agriculture (Thüringische Landesanstalt für Landwirtschaft) Jena
- Wulf , S . 2002 . Examination of NH3, N2O and CH4 emissions after turn out of digestates from co-fermentation , FNR (Fachagentur Nachwachsende Rohstoffe e.V., (Agency for Renewable Resources)) . Dissertation for Dr.rer.nat at faculty for biology, chemistry and geo science [dissertation]. (Available in German: Untersuchung der Emissionen von NH3, N2O und CH4 nach Ausbringung von Kofermentationsrückständen in der Landwirtschaft). University Bayreuth
- Wuppertal Institute, Institute for Energetic and Environment, Fraunhofer UMSICHT, Gas-Heating-Institute . 2006 . Analysis and assessment of utilization pathways of biomass (available in German: Analyse und Bewertung der Nutzungsmöglichkeiten von Biomasse) on behalf of the Federal Association of German Gas and Water Industries (BGW) and the German Technical and Scientific Association for Gas and Water (DVGW) Wuppertal, Leipzig, Oberhausen, Essen