
Abstract
Under the Greenhouse Gas Reporting Program (GHGRP), the US Environmental Protection Agency (EPA) receives reports of production, imports and exports of SF6 in bulk and inside of electrical equipment. EPA also receives reports of SF6 emissions, consumption and/or related parameters from users of SF6, including manufacturers and users of electrical transmission and distribution equipment, semiconductor manufacturers, and magnesium producers and processers. Based on these reports, EPA estimates the consumption of SF6 by each industry, including facilities that do not report to the GHGRP. In this paper, we compare the consumption estimated based on reports from SF6 suppliers (producers, importers and exporters) to the consumption estimated based on reports from SF6 users, discussing differences and possible reasons for them. We find that in the one year studied, 2012, consumption based on reports from users accounted for 59% of the consumption based on reports from suppliers. We conclude that the uncertainties associated with the consumption estimates are not likely to explain this difference, and that there may be significant uses of SF6 in the US other than manufacturing and use of electrical equipment, semiconductor manufacturing, and magnesium production and processing.
1. Introduction
Sulphur hexafluoride, or SF6, is the strongest known greenhouse gas, with a global warming potential (GWP) 22,800 times that of carbon dioxide (CO2).Footnote1 Although SF6 is emitted in smaller quantities than some other greenhouse gases (GHGs) (e.g. CO2 or CH4), its extremely long atmospheric lifetime of 3200 years causes it to accumulate in the earth’s atmosphere for centuries (Forster et al. Citation2007). SF6 serves an important role as an insulator and arc-quenching medium in electrical transmission and distribution equipment, as a cover gas in magnesium production and processing, and as an etchant in the electronics manufacturing industry (primarily semiconductor manufacturing in the United States). It is emitted from all three applications.
Under the US Greenhouse Gas Reporting Program (GHGRP), the large users of SF6 in these applications began annually reporting their emissions to the US Environmental Protection Agency (EPA) in 2012 (for emissions that occurred in 2011). In addition, producers and large importers and exporters of SF6 in bulk began annually reporting their production, destruction, imports and exports of SF6 in 2011 (for 2010 supplies), and large importers and exporters of SF6 inside of pre-charged electrical transmission and distribution equipment began reporting their imports and exports in 2012 (for 2011 supplies).
The collection of data from both users and suppliers of SF6 enables EPA and the public to compare the consumption of SF6 that is estimated based on reports from users with the consumption that is estimated based on production, destruction, imports and exports. This type of comparison ultimately supports and improves estimates of emissions, as noted in the 2006 IPCC Guidelines for National Greenhouse Gas Inventories (which refer to fluorinated greenhouse gas (F-GHG) consumption based on supplies as “potential emissions”):
[W]hen considered along with estimates of actual emissions, the potential emissions approach can assist in validation of completeness of sources covered and as a QC check by comparing total domestic consumption as calculated in this “potential emissions approach” per compound with the sum of all activity data of the various uses. (IPCC Citation2006)
For example, SF6 is known to have uses other than the three enumerated above, including medical and military applications. Historically, the prevailing belief has been that these applications account for a relatively small share of total US SF6 consumption and emissions. However, it is prudent to verify this belief through a comparison between US supply flows and the consumption accounted for by electrical transmission and distribution equipment, magnesium production and processing, and electronics manufacturing.
Additional motivation for this comparison is provided by recent studies of the growth rate of global atmospheric concentrations of SF6, which have found that the emissions implied by this growth rate significantly exceed the emissions accounted for by bottom-up estimates (e.g. the emissions reported by Annex 1 countries under the United Nations Framework Convention on Climate Change (UNFCCC) and/or estimated in the Emission Database for Global Atmospheric Research). At least two of these studies have indicated that total UNFCCC-reported emissions may be underestimated (Levin et al. Citation2010; Rigby et al. Citation2010). The United States reports emissions as an Annex 1 country under the UNFCCC, as do Canada, Japan, Australia, New Zealand, the Russian Federation, Turkey and the major industrial countries of Europe.
Figure presents the two methods by which EPA can estimate consumption of SF6 using data collected through the GHGRP.
Figure 1. Methods for determining the US consumption of SF6.
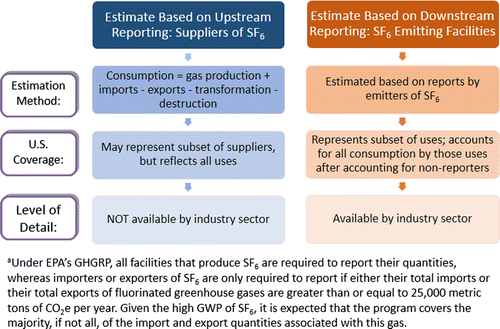
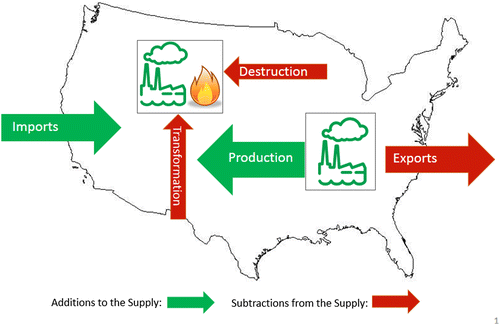
In the left column of Figure , which represents consumption of SF6 based on data from suppliers of SF6, the consumption total is defined as the sum of the quantities of chemical produced in or imported into the United States less the sum of the quantities of chemical transformed (used as a feedstock in the production of other chemicals), destroyed or exported from the United States.Footnote2 This calculation is depicted graphically in Figure .
Figure 2. Additions to and subtractions from the US supply of SF6 gas (i.e. net supply).
As represented by the right column of Figure , EPA can also estimate consumption of SF6 by relying on downstream reporting of SF6 emissions and/or purchases from users of SF6, including manufacturers and users of electrical transmission and distribution equipment, semiconductor manufacturers,Footnote3 and magnesium producers and processors. Because data from SF6 suppliers has only recently become available, this is the approach that EPA has historically used to estimate potential emissions for purposes of reporting them in the US Inventory of Greenhouse Gas Emissions and Sinks (U.S. EPA Citation2014). Historically, EPA based these consumption estimates on reporting from firms participating in EPA-Industry Emission Reduction Partnership programmes, but more recently, EPA began relying primarily on reporting from facilities reporting under the GHGRP. In both cases, the reporting facilities have represented a subset of their industries; thus, to ensure that the consumption reported in the inventory was complete, EPA has estimated consumption by non-reporting facilities and developed nationwide SF6 consumption estimates by industry.
This study compares the consumption estimated based on downstream reporting by emitters of SF6 to the consumption estimated based on upstream reporting by producers, importers and exporters of SF6.Footnote4 The study explores possible reasons for the differences and their implications for the SF6 emissions estimated in the US inventory. The remainder of this paper is organized into the following sections:
| • | Section 2 describes the methodology used to develop the consumption totals for the comparison. | ||||
| • | Section 3 provides a summary of the results of the comparison and the possible reasons for the difference between the two consumption estimates. The analysis considers the underlying data and the possibilities that some uses and emissions of SF6 are not accounted for, are underestimated, or are overestimated. | ||||
| • | Section 4 summarizes the conclusions drawn from the study. | ||||
2. Methodology
This section outlines the methodology used to develop the two estimates of US SF6 gas consumption.
2.1. Consumption based on upstream reporting by suppliers
SF6 production, import, export and destruction are reported to EPA by producers, importers and exporters of SF6. All SF6 producers are required to report; importers and exporters are required to report if either their combined imports or their combined exports of CO2, N2O and fluorinated GHGs (including SF6) exceed 25,000 metric tons of CO2 equivalent (mtCO2e). SF6 production, import, export and destruction totals were tallied for 2012. The calculation to determine consumption using supply data (Figure ) was subsequently performed.
2.2. Consumption based on downstream reporting by users
SF6 emissions are reported to EPA by magnesium processing and production facilities, semiconductor manufacturing facilities, users of electrical equipment (i.e. electric transmission and distribution facilities) and manufacturers of electrical equipment. In addition to reporting emissions, facilities covered by the GHGRP report data that are related to emissions, such as purchases of SF6 for users of electrical equipment. Due to the large number of relatively small downstream sources of SF6 emissions, reporting of emissions of SF6 is required only for SF6 emitting facilities with SF6 (or other F-GHG) emissions, banks or purchases above certain thresholds. Under the GHGRP, electronics manufacturers and magnesium producers and processors must report if their calculated GHG (including SF6) emissions exceed 25,000 mtCO2e. Users and producers of electrical equipment must report if their SF6 banks and purchases, respectively, exceed thresholds that correlate to emissions of 25,000 mtCO2e.
Emissions reported through the GHGRP, along with other data, are used to develop nationwide emission estimates that are published in the Inventory of US Greenhouse Gas Emissions and Sinks (U.S. EPA Citation2014). As noted above, EPA also uses this data to estimate nationwide consumption by industry sector. Table presents the implied consumption estimates for 2012 by each source category. The methodology for determining consumption for each sector is described below.
Table 1. US SF6 consumption determined by downstream reporting of emissions, 2012.
2.3. Magnesium production
The magnesium metal production and casting industry uses SF6 as a cover gas to prevent the rapid oxidation of molten magnesium in the presence of air. To develop nationwide emission estimates, emissions data for 2012 were obtained through EPA’s GHGRP, and emissions were estimated for the share of magnesium produced or processed by producers and processors that did not meet the requirements to report under the EPA GHGRP. The emission factors (kg SF6/ton of magnesium) applied to the quantities of magnesium produced and processed by non-reporters were generally based on the average of the emission factors reported for the same types of activities (e.g. die casting and sand casting) by reporting facilities. For non-reporting die casters (who account for the majority of emissions from non-reporters), this value was set at three kg/ton.Footnote5 The methodology assumes SF6 use is equivalent to emissions, consistent with the 2006 IPCC Inventory Guidelines (IPCC Citation2006). Hence, total emissions are assumed equal to consumption for this source category.
2.4. Semiconductor manufacturing
The semiconductors manufacturing industry uses several fluorinated greenhouse gases (F-GHGs), including SF6, during fabrication. During the etching process, plasma-generated fluorine atoms chemically react with exposed dielectric film to selectively remove the desired portions of the film. The material removed as well as unreacted F-GHGs flow into waste streams and, unless emission abatement systems are in place, into the atmosphere (U.S. EPA Citation2014).
Consumption of SF6 by this industry sector is assumed to be equivalent to industry purchases. Industry purchases are estimated based on the following methodology:
| • | Purchase data are available from facilities that participated in the US EPA PFC Reduction/Climate Partnership for the Semiconductor Industry for three years – 2006, 2007 and 2008 – but not for other years. | ||||
| • | To estimate the consumption by the entire US semiconductor industry, the Partners’ usage rate is calculated for all F-GHGs based on (1) 2006 and 2007 Partner-reported purchasesFootnote6 and (2) EPA-developed estimates of Partner activity in terms of total manufactured layer area (TMLA).Footnote7 The usage rate is applied to the total EPA-estimated US TMLA in subsequent years. | ||||
| • | The usage over all F-GHGs is then disaggregated into usage for individual gases by taking the weighted usage fraction in years 2006 and 2007. SF6 is estimated to represent approximately 5.6% of the total F-GHGs (on a ton of chemical basis) used by the semiconductor industry in etching and cleaning processes.Footnote8 | ||||
2.5. Electric transmission and distribution
SF6 is a gaseous dielectric used in electrical transmission and distribution equipment as an insulator and arc-quenching medium. The gas may be released from leaks in the equipment or during equipment manufacturing, installation, servicing and disposal. Emissions reported to the GHGRP are estimated using a Tier 3 utility-level mass-balance approach (IPCC Citation2006). The mass-balance method tracks gas flows and assumes that the quantity of SF6 that cannot be accounted for has been emitted to the atmosphere. One of the gas flows tracked and reported is purchases of SF6 either in bulk or inside equipment. Original equipment manufacturers (OEMs) of high-voltage circuit breakers and other SF6-containing equipment also report emissions to the GHGRP using a mass-balance approach.
The following method is used to estimate consumption of SF6 by this industry sector:
| • | Electric T&D utilities: consumption is assumed to be equal to purchases of SF6 made by electric T&D utilities. Purchase data are available from reporters of GHGRP as well as from the US EPA SF6 Emission Reduction Partnership for Electric Power Systems (EPS Partnership), and include bulk gas purchases and purchases of gas inside or along with newly acquired equipment. These totals are aggregated and added to an estimate of SF6 purchases by non-reporting utilities. Purchases by US utilities that do not report to either of these programmes are estimated using the results of two regression analyses. The first of these correlates emissions from reporting utilities with their transmission miles. The second of these correlates emissions with purchases. (U.S. EPA Citation2014).Footnote9 The emission/consumption factors for non-reporting utilities are assumed to be the same as those for comparable reporting utilities.Footnote10 | ||||
| • | OEMs: consumption is assumed to equal emissions from OEMs.Footnote11 This approach is taken to avoid the potential for double counting SF6 that was purchased by OEMs from bulk gas distributors and subsequently purchased by utilities from OEMs. This method for electric T&D facilities assumes that all SF6 purchased by OEMs is either emitted or sent to utilities (U.S. EPA Citation2014).Footnote12 | ||||
3. Results and analysis
Table presents the total consumption as determined by upstream reporting of supply data and the results of implied consumption based on the downstream reporting of emissions.
Table 2. SF6 consumption estimates, metric tons.
As shown in Table , estimated consumption by users of SF6 accounts for 59% of SF6 supplies, a large difference. The 2013 upstream and downstream consumption estimates are still being developed, but preliminary analysis indicates that the difference between them will be smaller than the difference between the 2012 estimates. Nevertheless, the 2012 difference requires further exploration. The remainder of this section identifies and discusses possible explanations for the difference in the two consumption estimates.
3.1. Uncertainties in upstream estimation method
3.1.1. Import and export reporting is threshold based
Bulk importers or exporters of SF6 are only required to report if either their total imports or their total exports of F-GHGs are greater than or equal to 25,000 metric tons of CO2e per year. The quantity of gas that may be imported and exported by firms that fall below the threshold is not known. The net supply of SF6 gas may be underestimated (i.e. unaccounted for imports are greater than unaccounted for exports) or overestimated (i.e. unaccounted for imports are less than unaccounted for exports). However, given the high GWP of SF6, it is expected that the programme covers the majority, if not all, of the import and export quantities associated with this gas. Thus, the thresholds for reporting imports and exports are not likely to solely account for the difference between upstream and downstream consumption estimates.
3.1.2. Possible errors in reporting
Importers and exporters of SF6 may make errors that over- or understate their imports and exports, e.g. by reporting GWP-weighted rather than unweighted quantities or by failing to report although they exceed the threshold. Although EPA reviews reported data and contacts reporters when quantities are unexpectedly large or small, some mistakes may not be detected. The impact of such errors is magnified by the very high GWP of SF6. While over-reporting of supplies could explain some of the difference between upstream and downstream consumption estimates, it is not likely to be the only contributor to that difference.
3.1.3. Growing or declining stockpiles
In some years, imports and exports may be greater than consumption because the excess is being used to increase chemical stockpiles; in other years, the opposite may hold true. Averaging imports and exports over multiple years can minimize the impact of such fluctuations. When the 2012 and 2013 net additions to the supply are averaged, the difference between the upstream and downstream consumption estimates decreases, but it does not disappear.
3.1.4. Exclusion of imports and exports of SF6 inside of equipment
This study does not include the quantities of SF6 that are imported and exported inside of electrical equipment. While these quantities are reported under the GHGRP, they have been determined to be confidential for each importer and exporter, and the process for publishing the aggregated data was not completed before this paper was submitted. However, the quantities of SF6 that were imported and exported inside electrical equipment in 2012 did not significantly contribute to the difference between upstream and downstream consumption estimates.
3.2. Uncertainties in downstream estimation method
3.2.1. Downstream estimates rely on methods that scale reported data using assumptions that have varying uncertainty
The GHGRP requires reporting from large sources of emissions that equal or exceed thresholds that are equivalent to emissions of 25,000 metric tons of CO2e per year. According to EPA estimates, for example, the regulatory reporting programme captures just under 70% of emissions from electric T&D facilities from facilities, the largest SF6-emitting source in the United States. To develop nationwide estimates of emissions, and potential emissions, it is necessary to make assumptions in scaling reported data to national levels.
The results of the uncertainty analyses that EPA conducts on each sector’s emissions can provide some measure of the uncertainty in the corresponding consumption estimates. Table shows US emissions, US consumption and the upper bound consumption for each source category, assuming the per cent uncertainty estimated for emissions (upper bound) applies to consumption.
Table 3. Tier 2 quantitative uncertainty estimates for US SF6 emissions applied to consumption, metric tons and percent.
The second-to-last row in the table shows the upper bound consumption calculated by propagating the errors for each source category. The last row shows the upper bound consumption calculated under a sensitivity analysis. The sensitivity analysis assumes that the uncertainties of consumption by magnesium production and semiconductor production are each equal to 100%, and that the estimated consumption by the non-reporting segment of the electric transmission and distribution sector is biased low by 50% (i.e. half the actual value). Even under these assumptions, total upper bound consumption accounts for 82% of reported net supplies. Thus, it is unlikely that an error in scaling up consumption is solely responsible for the difference between the upstream and downstream estimates.
3.2.2. Possible underestimate of purchases for medium-voltage distribution equipment
In the US, SF6 is used in two general types of electrical equipment: high-voltage transmission equipment (also known as “closed-pressure equipment”), which has relatively large charge sizes and tends to require servicing during its life, and medium-voltage distribution equipment (also known as “sealed-pressure equipment”), which has smaller charge sizes and tends not to require servicing during its life. Utilities reporting under the GHGRP are required to report their emissions from, and SF6 purchases for, both types of equipment. However, when emissions and purchases are estimated for non-reporting utilities, they are assumed to be proportional to the length of transmission lines (where high-voltage equipment is used) and not to the length of distribution lines (where medium-voltage equipment is used), based on regression analyses performed using the emissions from the reporting utilities. Since medium-voltage equipment is usually not expected to emit SF6 until it is disposed of (when the SF6 may be recovered, avoiding emission), significant quantities of medium-voltage equipment may be installed annually along distribution lines without resulting in corresponding emissions. In other words, purchases of SF6 associated with the installation of medium-voltage equipment may not be accurately modelled using the current, emissions-based regression analysis. While the quantities of SF6 purchased for medium-voltage equipment are believed to be much smaller than those for high-voltage equipment, it is possible that this issue contributes to the difference between the upstream and downstream estimates.
3.2.3. Possible changes in SF6 usage rate by semiconductor manufacturing facilities
Because the SF6 purchase data used to estimate purchases by the semiconductor manufacturing industry is from 2006 to 2007, we investigated the possibility that the SF6 usage rate per TMLA has changed since that period, using emissions as a proxy. The US SF6 emission rate per TMLA has declined by slightly more than half since the 2006–2007 period. To some extent, this emission rate decline is observed for all of the fluorinated GHGs used in etching and chamber cleaning processes, but the decline is greatest for SF6. Although the decline in the SF6 emission rate does not definitely demonstrate that the SF6 usage rate has decreased (the emission rate decline could also be caused by an increase in the SF6 dissociation rate during the manufacturing process or by an increase in the SF6 abatement rate), it does make it unlikely that the usage rate has increased significantly. Thus, the use of the 2006 and 2007 usage rate data to estimate the 2012 usage rate is not likely to be responsible for the difference between the upstream and downstream consumption estimates.
3.2.4. Possible underreporting by facilities
Although EPA conducts verification of all reported data received through the GHGRP, the GHGRP is still a relatively new reporting programme and facilities may have underreported their gas purchases (e.g. by failing to account for gas purchased inside new electrical transmission and distribution equipment). However, many facilities reporting under the GHGRP have more than a decade of experience estimating and reporting their emissions and related inputs to EPA voluntarily using the same methodologies as required by the GHGRP. Participants in EPA’s SF6 Emission Reduction Partnership for Electric Power Systems, for example, comprise approximately 75% of the facilities required to report for this emissions source, which represents the largest source of SF6 emissions in the United States. Thus, it is not expected that underreporting of purchases by facilities is a major contributor to the difference between the upstream and downstream consumption estimates.
3.2.5. Some uses of SF6 are not captured
As noted above, one of the goals of comparing upstream and downstream consumption estimates is to assess the completeness of the emissions inventory. Although the electric T&D, semiconductor and magnesium industries are believed to account for the majority of SF6 use in the United States, other miscellaneous uses require the gas, including laboratory, research, medical, military and other applications. Examples of other applications of SF6 gas include uses as an electrical insulating gas in particle accelerators, as a tracer gas for leak detection, as an intraocular gas to treat retinal tears and laboratory uses (e.g. hood testing, chromatography), (U.S. EPA Citation2014). SF6 is also used in military applications. These include the Airborne Warning and Control System (AWACS) aircraft fleet, which uses the gas within the radar domes to prevent distortion of the radar signal, and Stored Chemical Energy Propulsion Systems, where the SF6 is used as an oxidant for lithium in torpedo propulsion (IPCC Citation2006). The latter application chemically transforms the SF6 rather than emitting it but nevertheless adds to consumption.
The differences between the upstream and downstream consumption estimates may be attributable to consumption of SF6 by some or all of these applications. Emissions from military applications and some particle accelerators are included in an inventory of US government GHG emissions, but these emissions were less than two TgCO2e in 2012 (US Department of Energy Citation2014).Footnote13 Alone, therefore, military applications appear unlikely to account for the difference between the upstream and downstream consumption estimates. (Military applications that transform rather than emit the SF6 would not be included in emissions totals and could be contributing to the difference, although these uses would have to be large to account for more than a small share of it.) Other, applications may be responsible, such as SF6 from research particle accelerators that are not affiliated with the Department of Energy and therefore do not report emissions through the US Government GHG inventory.
Other countries have investigated emissions of SF6 from these miscellaneous applications. For example, Germany quantifies emissions of SF6 from AWACs, optical glass fibre production, welding, tracer testing, insulated windows and car tires, among other applications.Footnote14 The United Kingdom (UK) recently investigated a number of applications and determined to add SF6 emission estimates to their inventory for AWACs, particle accelerators and tracer testing. These applications were estimated to account for slightly less than 15% of SF6 emissions from the UK in 2011. For other sources, such as soundproof windows, the UK did not add emissions because these applications were determined not to exist in the UK (UK DECC Citation2014).
Additional research is needed to identify and quantify consumption by and emissions from these sources in the United States. To develop an accurate estimate of SF6 emissions from these sources, it will be important to distinguish among applications that chemically transform, store and immediately emit the SF6, as each of these use patterns is associated with its own emission pattern (IPCC Citation2006).
4. Conclusion
The collection of both upstream and downstream consumption data by the GHGRP – EPA’s reporting programme covering SF6 and other GHGs – provides a valuable opportunity to evaluate the accuracy and completeness of the US SF6 emissions inventory. Based on data from 2012, supply based, upstream consumption estimates are significantly larger than user-based, downstream consumption estimates. While multiple sources of uncertainty affect both data-sets, it appears likely that current SF6 consumption estimates do not account for all significant applications of SF6 in the United States and/or do not fully account for some known uses, such as medium-voltage electrical equipment. Additional research is necessary to identify and characterize the other significant applications that consume SF6. Ideally, this research will distinguish among uses of SF6 that chemically transform, store, and immediately emit this potent GHG, permitting a more accurate and complete emissions inventory to be developed.
Notes
1. This GWP for SF6 is from the Intergovernmental Panel on Climate Change (IPCC) Fourth Assessment Report (IPCC Citation2007).
2. Chemical that is exported, transformed or destroyed will never be emitted in the United States. SF6 is not typically transformed, but it may be destroyed.
3. The GHGRP collects information from other electronics manufacturers (e.g. MEMS manufacturers); however, these emissions are far smaller than those from semiconductor manufacturers and are not currently estimated in the US inventory.
4. The term, consumption, referred to in this paper as “implied consumption”, “potential emissions” or “supply” does not necessarily equate to actual usage. End users may purchase SF6 gas to either consume it or stockpile it to use at a later date.
5. Note that this value, which is based on an arithmetic average, is higher than most of the annual weighted average emission factors for die casting for that are shown in U.S. EPA (Citation2014). The weighted averages reflect the influence of die casters who produce large parts and have relatively low emission factors.
6. Usage data of 2008 shows a rapid decline in usage as compared to 2006 and 2007, likely a result of economic recession. Further, this economic recession led many fabs to cut back manufacturing, as reflected by the decrease in usage of gases. Hence, the usage data for 2008 were not used in the development of the gas usage rate.
7. The TMLA is the product of the number of layers in semiconductors devices, including both silicon wafer and metal interconnect layers, and silicon consumption (i.e. the area of semiconductors produced). F-GHG use and emissions are proportional to both quantities.
8. F-GHGs used in semiconductor manufacturing, as estimated for the US inventory, include SF6, C3F8, CF4, CHF3, C4F8 and NF3.
9. SF6 is believed to be contained primarily in transmission equipment rated above 34.5 kV.
10. This assumption reflects the US EPA’s experience with the emission factors of utilities that began reporting under the GHGRP in 2012, starting with their data for 2011. Before 2012, the only utilities reporting SF6 emissions to the US EPA were participants in the EPS Partnership (Partners). For purposes of estimating emissions and purchases for the US inventory, non-Partners were assumed to have emission factors equal to the average of the emission factors reported by Partners for 1999, the first year of the EPS Partnership. However, reporting under the GHGRP showed that newly reporting non-Partners had emission factors (averaging 4%) that were far closer to the average of the 2011 emission factors for Partners (3%) than they were to the average of the 1999 emission factors for Partners (13%).
11. Nationwide SF6 emissions from OEMs do not currently integrate reported data from EPA’s GHGRP; although this is a planned improvement for the US Inventory. Emissions are calculated using the ratio of new nameplate capacity of SF6-containing equipment to total nameplate capacity of SF6-containing equipment using a subset of data from reporting utilities. The ratio is then multiplied by the total industry nameplate capacity estimate to derive the amount of SF6 charged into new equipment for the entire industry. An emission rate of 10% is subsequently applied, based on the assumption that manufacturing emissions equal 10% of the quantity of SF6 provided with new equipment. The 10% emission rate is the average of the “ideal” and “realistic” manufacturing emission rates (4 and 17%, respectively) identified in a paper prepared under the auspices of the International Council on Large Electric Systems in February 2002 (O’Connell et al. Citation2002; U.S. EPA Citation2014).
12. In fact, some SF6 purchased by OEMs may be exported inside of equipment. As discussed below, however, these quantities did not appear to have a large impact on total SF6 consumption in 2012.
13. The US Government reported F-GHG emissions in military applications of 1.8 TgCO2e in 2012. While SF6 emissions are believed to be a significant fraction of this total, that fraction is not included in the summary report.
14. Because Germany combines SF6 emissions from sports shoes, AWACS and welding with certain HFC emissions to protect confidential information, it is not possible to compare SF6 emissions from miscellaneous applications to SF6 emissions from all applications in Germany.
References
- Forster P, Ramaswamy V, Artaxo P, Berntsen T, Betts R, Fahey DW, Haywood J, Lean J, Lowe DC, Myhre G, et al. 2007. Changes in atmospheric constituents and in radiative forcing. In: Solomon S, Qin D, Manning M, Chen Z, Marquis M, Averyt KB, Tignor M, Miller HL, editor. Climate Change 2007: the physical science basis contribution of Working Group I to the fourth assessment report of the intergovernmental panel on climate change. Cambridge: Cambridge University Press.
- [IPCC] Intergovernmental Panel on Climate Change. 2006. Industrial processes and product use. In: Eggleston HS, Buendia L, Miwa K, Ngara T, Tanabe K, editor. 2006 IPCC guidelines for National Greenhouse Gas Inventories. (Vol 3), p. A2.4. Hayama: The National Greenhouse Gas Inventories Programme.
- [IPCC] Intergovernmental Panel on Climate Change. 2007. In: Pachauri RK, Reisinger A, editor. Climate Change 2007 synthesis report. Geneva, Switzerland. Available from: http://www.ipcc.ch/publications_and_data/publications_ipcc_fourth_assessment_report_synthesis_reporthtm
- Levin I, Naegler T, Heinz R, Osusko D, Cuevas E, Engel A, Ilmberger J, Langenfelds RL, Neininger B, Rohden, Cv, et al. 2010. The global SF6 source inferred from long-term high precision atmospheric measurements and its comparison with emission inventories. Atmos Chem Phys. 10:2655–2662.10.5194/acp-10-2655-2010
- O’Connell P, Heil F, Henriot J, Mauthe G, Morrison H, Neimeyer L, Pittroff M, Probst R, Tailebois JP. 2002. SF6 in the electric industry, Status 2000, CIGRE. Feb 2002.
- Rigby M, Mühle J, Miller BR, Prinn RG, Krummel PB, Steele LP, Fraser PJ, Salameh PK, Harth CM, Weiss RF, et al. 2010. History of atmospheric SF6 from 1973 to 2008. Atmos Chem Phys. 10:10305–10320.10.5194/acp-10-10305-2010
- [UK DECC] U.K. Department of Energy & Climate Change. 2014. Review of data and methodologies used in the calculation of UK emissions from F-gases. Prepared by ICF International. Available from: http://uk-air.defra.gov.uk/assets/documents/reports/cat07/1404301320_Tender3_F-GasReview_FINALREPORT_14_04_14pdf
- U.S. Department of Energy, Office of Energy Efficiency & Renewable Energy, Federal Energy Management Program. 2014. Federal greenhouse gas inventories and performance. Available from: http://energy.gov/eere/femp/federal-greenhouse-gas-inventories-and-performance
- [U.S. EPA] U.S. Environmental Protection Agency. 2014. Inventory of US greenhouse gas emissions and sinks: 1990–2012. U.S. Environmental Protection Agency. Apr 2014. Available from: http://epa.gov/climatechange/emissions/usinventoryreporthtml