Abstract
This study offers a Choice Experiment (CE) analysis of geographical scope effects. About 500 stated preference surveys were conducted to estimate willingness-to-pay (WTP) for nature protection in the Netherlands and the Caribbean Netherlands which became part of the Netherlands’ constitution just before the survey, providing a unique policy setting. Two version of the CE were implemented with a narrow or a broader geographical scope. Estimation of error correction mixed logit models resulted in the following main insights. First, the hypothesis of scope invariance is rejected since expanding the geographical scope influenced WTP values for nature protection. As an illustration, policies of preventing a degradation of nature have an average WTP of about €20 in the experiment with the smaller geographical scope, while this WTP is not significantly different from zero in the experiment with the more extensive scope. Second, evidence of scope sensitivity of WTP to the levels of nature protection is mixed, and depends on the geographical scope of the CE. We find a sizable WTP for protection of nature in Caribbean Netherlands among citizens of the mainland of the Netherlands, which supports the observed sizable funding of the Dutch government for nature management in the Caribbean Netherlands.
1. Introduction
There is a history of studies that have valued how willingness-to-pay (WTP) for environmental goods depends on the scale or scope of the item being valued, such as the number of protected species (Haneman Citation1994). This is not surprising since the NOAA panel on the Contingent Valuation Method (CVM) concluded that insensitivity to scope was ‘perhaps the most important internal argument against the reliability of the CVM approach’ (Arrow et al. Citation1993, 4607). Although WTP usually increases with the scope of the environmental good (Walsh et al. Citation1992; Hoevenagel Citation1996; Smith and Osborne Citation1996; Carson et al. Citation2001; Veisten et al. Citation2004), it has been shown that in some applications sensitivity of WTP to scope is insufficient (Kahneman and Knetsch Citation1992; Diamond et al. Citation1993; Schkade and Payne Citation1994). The implications of these findings have been hotly debated (see Section 2). Because of these debates, sensitivity to scope remains a reoccurring and important theme in environmental valuation, especially in view of advances in valuation methodologies, such as Choice Experiments (CE) which may overcome CVM shortcomings.
The CE method has increased in popularity and is gradually replacing the traditional CVM for valuing non-market environmental goods (Hoyos Citation2010). In a CE, individuals are asked to indicate their preference at a choice card that shows hypothetical mutually exclusive alternatives (e.g. environmental policy options) which are defined by attributes (e.g. environmental features) that take on specific levels. Including a monetary payment as an attribute – often a tax – allows for deriving WTP values for attributes. It has been argued that sensitivity to scope may be stronger in CEs than CVMs, but few studies have examined scope effects in CEs (Foster and Mourato Citation2003; Goldberg and Roosen Citation2007), and especially the design of the geographical scope of the environmental good has hardly been studied.
In applications in which a CE aims to elicit WTP for an environmental site or nature in a specific region, it is often the case that competing sites and regions exist where environmental protection may be considered by policy-makers and valued by individuals. This poses methodological challenges. During the design phase of a CE decisions need to be made by the researcher about which sites and regions to include in the valuation exercise, which may have a non-negligible and perhaps unintended effect on the obtained WTP estimates. Nevertheless, the effects of this type of geographical scoping have not been systematically studied, as will be done here.
This study offers a CE analysis of geographical scoping in a unique policy setting. We examine the WTP for nature protection in the Netherlands mainland (hereafter defined as the Netherlands) and the Caribbean Netherlands. Of special interest is how this WTP depends on the geographical scope. In particular, a CE elicits WTP for nature protection using experimental versions with a different scale of geographical scope: one CE values nature protection in the Netherlands and the Caribbean Netherlands, while another CE expands the geographical attributes to the respondents’ own local environment and the rest of the world. This set-up allows for testing hypotheses which provide insight into both key survey design issues (e.g. geographical scoping) and policy questions (e.g. where to protect nature the most?).
The geographical context of the study is inspired by the allocation of Netherlands’ nature between the European mainland and their Caribbean Islands. On 10 October 2010 Bonaire, Saba and Sint Eustatius became part of the Netherlands’ constitution. These islands are also referred to as the Caribbean Netherlands, because of their location in the Caribbean Sea which is far from the Netherlands in Europe. The islands in the Caribbean Netherlands have received the constitutional status of special Dutch municipality. This implies that a significant area of high value nature and stock of biodiversity was added to the Netherlands’ Kingdom, including many new and rare species.Footnote1
Local residents of the Caribbean Netherlands start paying tax to the Netherlands’ treasury, and in return are also entitled to claim government service similar to what is provided in the mainland, including environmental protection. An important question for policy-makers to which this study delivers answers is how much Dutch citizens value nature protection in the Caribbean Netherlands, relative to nature in the mainland.
The remainder of this article is structured as follows. Section 2 reviews the main literature on scoping effects in stated preference valuation. Section 3 outlines our research hypotheses. Section 4 describes the set-up of the CE surveys. Section 5 explains the statistical methods. Section 6 provides the survey results. Section 7 concludes.
2. Scoping effects in stated preference valuation studies
A scope test examines whether respondents have a higher WTP for a larger quantity or better quality of a good. Usually environmental valuation studies pass this test (Walsh et al. Citation1992; Hoevenagel Citation1996; Smith and Osborne Citation1996; Carson et al. Citation2001; Veisten et al. Citation2004), but in some cases sensitivity of WTP to scope has been judged as insufficient (Kahneman and Knetsch Citation1992; Diamond et al. Citation1993; Schkade and Payne Citation1994). These results have put the reliability of stated preference valuation into question, since it has been argued that if individuals are not able to distinguish goods of different scope in a valuation survey, then the reliability of WTP estimates that such surveys produce are suspect. However, insensitivity to scope may be partly caused by an inadequate design of the survey, such as an unclear description of a (unfamiliar) good to be valued and its levels of quantity or quality (Carson and Mitchell Citation1995; Veisten et al. Citation2004; Heberlein et al. Citation2005). In practice there is a trade-off in information supply, and a balance needs to be found between potential biases arising from scope insensitivity (too few information) and arising from cognitive burden (too much information).
It has been pointed out that economic theory does not imply that WTP should be adjusted fully proportionally to changes in the amount of the environmental goods. For example, when the quality of one forest has improved, then an individual values a similar improvement of another forest less if these forests are substitutes (Madden Citation1991). Moreover, even improvements in the amount of the same environmental good, such as the area of the same forests, should be valued less than proportionally due to diminishing marginal value. This implies that WTP increases with environmental quality improvements, but at a decreasing rate that depends on the existing level of environmental quality (Rollins and Lyke Citation1998). Heberlein et al. (Citation2005) show that respondents may even have more positive attitudes to smaller improvements in the quantity of nature than larger quantities – in their application of the valuation of the number of wolves in an area – which results in scope insensitivity. Despite these nuances and irregularities, these WTP answers can reflect ‘true preferences’. Moreover, respondents in stated preference valuation studies have limited budgets, which is a constraint on spending that may imply insensitivity of WTP to scope (Randall and Hoehn Citation1996). The explanation is that WTP is limited to actual ability to pay at least if the valuation task is regarded by the respondent as a real trade-off between income and environmental quality, as is the underlying assumption of stated preference valuation.
Another explanation for insensitivity to scope that has been attributed to mental accounting can be found in the behavioural economics literature. Thaler (Citation1999) postulates that individuals create mental accounts for their financial decisions, such as household budgeting, which implies that individuals label both sources and uses of funds in a mental account that keeps track of the balance of funds. Such mental accounts are created for categories of expenditures, which is related to findings by Kahneman and Tversky (Citation1984) that individuals frame monetary outcomes using ‘topical accounts’. An example of mental accounting is that individuals may group expenditures on nature protection into a single category, and spending on this category may be constrained by an explicit or implicit budget (‘an individual’s budget for nature’). Such mental accounting can imply insensitivity to scope if a respondent has reached his/her implicit budget for spending on nature protection, which implies that stated WTP will be low or zero for additional improvements of nature. It can also imply that a respondent states a WTP value that reflects his/her implicit budget for nature irrespective of the improved quantity and quality of nature. Another somewhat related explanation for insensitivity to scope is that respondents state a WTP value for nature because they derive moral satisfaction from the act of giving per se, which is independent from the quality of the nature to be valued. This has been called the ‘warm glow effect’ (Kahneman and Knetsch Citation1992). A CVM study by Nunes and Schokkaert (Citation2003) finds that overall reported WTP values are insensitive to scope, while WTP measures that are corrected for the warm glow effect are sensitive to scope, suggesting that indeed insensitivity to scope can arise due to warm glow.
Sensitivity to scope may also depend on the WTP elicitation format that is applied in stated preference studies. For instance, Veisten et al. (Citation2004) compare how sensitivity to scope differs between the payment card and the open-ended CVM, and conclude that providing a payment card reduces problems with insensitivity to scope. A reason for the increase in popularity of CEs for environmental valuation is that it has been argued that CEs may overcome some of the biases that have been associated with the CVM, such as hypothetical bias and perhaps scope insensitivity (Hoyos Citation2010). Furthermore, a few studies have examined whether the CE method results in greater sensitivity to scope than the CVM, and these found that this was indeed the case (Foster and Mourato Citation2003; Goldberg and Roosen Citation2007). For example, Foster and Mourato (Citation2003) concluded that the WTP values estimated through a CE are significantly higher than these values estimated by the CVM for the overall bundle of characteristics of the good, while WTP estimates for the individual components obtained with the CE are significantly lower than that estimated by the CVM. It is surprising that very few studies examined geographical scope issues related to the design of valuation tasks.
The literature on geographical scoping has mostly focused on so-called ‘distance decay’ effects (e.g. Jorgensen et al. Citation2013; Schaafsma et al. Citation2013). This effect means that WTP for an environmental site is expected to be a decreasing function of the respondent’s location from this site. The reasons for the distance decay effect are twofold. First, opportunities for the respondent to make use of environmental improvements are lower the farther he/she lives from the area where such improvements are made. Second, there can be a substitution effect meaning that the number of available substitutes sites rises with increasing distance from the site of interest. A few studies have examined whether distance decay influences sensitivity to scope of the environmental goods to be valued, and found that such effects were insignificant (Bateman et al. Citation2006), while distance decay effects have been observed to be larger for goods with a small scope (Hanley et al. Citation2003).
An issue that has hardly received attention is the influence of the number of substitution sites included in a CE on obtained WTP estimates. An exception is Schaafsma and Brouwer (Citation2013) who first asked respondents preferences at choice cards with environmental improvements in four lakes, while subsequently the same respondents are asked their preferences in which the number of alternatives is expanded to seven lakes. Their results show that this change in the choice set size has little to no effect on estimated WTP values. An explanation put forward by these authors is that because the same respondents answered both the choice sets with the smaller and expanded alternatives of geographical areas, these respondents may have learned about their preferences by first answering the choice cards with fewer alternatives (i.e. four lakes), and consistently followed these preferences when answering the cards with the expanded alternative sites (i.e. seven lakes). Effects of expanding the geographical scope in terms of included substitute sites in a CE may, thus, be very different if such learning opportunities are not available. Among other issues, this will be examined here by eliciting WTP for nature protection from different samples of respondents who answered CEs in which the number of included substitute sites differ for all choice cards answered by a specific respondent. Our choice setting in which a specific respondent answers choice cards with the same included substitute sites is more common in CEs, although the effects of the included sites on the obtained welfare measures remain untested by other studies.
Our CE study on the WTP value of biodiversity protection in the Dutch Caribbean islands also raises the philosophical question about how to label the valued goods and services. Where in the spectrum of hard economic provisioning ecosystem services and soft existence values can the WTP estimates be positioned? To position this value, placing our study in the context of the debate on the intrinsic value of nature is helpful (Sarkar Citation2005; Batavia and Nelson Citation2017). In contrast to the instrumental or economic value, the intrinsic value is defined as the value that an entity, species or ecosystem has in itself (Soulé Citation1985). In this regard, it is important to distinguish two different views on intrinsic value (Sandler Citation2012). The ‘objective intrinsic value’ is not humanly conferred and is valuable, independent of anyone’s preference. The ‘subjective intrinsic value’ is created by human valuing and implies that something has value for what it is, rather than for what it can bring about (Elliot Citation1992). Humans value many attributes intrinsically such as religion, history, culture and do so for different reasons such as its beauty, scarcity and cultural ties. The values generated in our study estimate, to a large extent, the existence and non-use function of nature in the Dutch Caribbean among a remote audience that feels connected due to its history, but that is unlikely to visit and enjoy the biodiversity directly. Therefore, the WTP estimates could partially be categorised as subjective intrinsic values, and as such could be labelled as the new concept of ‘relational value’ which are values based on preferences, principles and virtues associated with relationships (Piccolo Citation2017).
3. Hypotheses about scoping
Given the rapidly growing number of stated preference environmental valuation studies and their use in policy-making, it is important to arrive at a better understanding of sensitivity to scope of the obtained welfare estimates. Our aim is to test hypotheses about survey design issues related to geographical scoping in order to arrive at insights into how decisions that valuation researchers make about the adopted survey method will influence final outcomes.
The effect of geographical scoping in the design of the CE in terms of the included substitute sites is examined by implementing two versions of the experiment: namely, CE1 contains attributes nature in the Netherlands x j,CE1 and nature in the Caribbean Netherlands y j,CE1, while CE2 in addition includes nature improvements in the respondent’s own local environment (v j ), nature in the remainder of the Netherlands (x j,CE2) and nature in the rest of the world (w j ). The subscript j = 1, …, n indicates the level of the nature attribute in increasing order with the quantity of nature; 1 = small degradation, 2 = no change, 3 = small improvement, 4 = major improvement. Geographical scope invariance is tested as (H1) V(y j,CE1) = V(y j,CE2) for nature in the Caribbean Netherlands and V(x j,CE1) = V(v j ) + V(x j,CE2) for nature in the Netherlands. The latter is a separate attribute in CE1 and a combination of nature in the respondent’s own environment and the remainder of the Netherlands in CE2. Finally, sensitivity of WTP to scope of the level of nature improvement is examined as (H2) V(x j ) < V(x j+1) and V(y j ) < V(y j+1) in CE1 and CE2 and V(w j ) < V(w j+1) and V(v j ) < V(v j+1) in CE2.
4. Set-up of the CE surveys
4.1. Set-up and administration of the CE
A web-based survey was designed in which the choice experiment (CE) was embedded. The survey period was April until May 2012. The online survey was pre-tested using 20 respondents in order to check the understanding of the questions and choice experiment, and to derive prior coefficient values for the final design of the experiment (see Section 4.2). The online survey was completed by 512 respondents. Approximately one-third of these respondents were recruited on the basis of a previously implemented CVM survey. These respondents provided their email address knowing that they would be invited to conduct an online survey on a similar topic. Two-thirds of the respondents were provided by a specialised survey bureau (i.e. Multiscope B.V.) which provided a representative sample of the population of the Netherlands. These respondents were randomly selected from the consumer panel of Multiscope and contacted by e-mail.
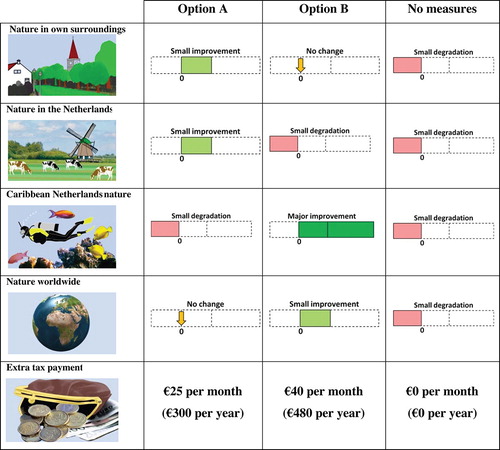
The questionnaires included questions about attitudes towards environmental protection and nature and concluded with the usual socio-demographic questions. As mentioned, two different versions of the CE were implemented in order to test the hypotheses outlined in Section 3. About half of the respondents completed Version CE1 of the choice experiment with three attributes only, being the payment vehicle, nature in the Netherlands and nature in the Caribbean Netherlands. The other half of the respondents completed Version CE2 that included two additional attributes which widens the geographical scope: namely, nature in the respondent’s own surroundings as well as nature in the rest of the world. After a text that introduces the CE, the attributes were explained as in Table B1, Appendix B. In both choice experiments the tax attribute could take on one of the following eight levels: €2.5, €5, €10, €15, €25, €35, €50 or €75 per month. The levels of the nature protection attributes can take on: a small degradation, no change, a small improvement and a large improvement as explained in Figure A1, Appendix A. After describing the attributes and the levels, a practice choice card was shown which was carefully explained. An example of a choice card is presented in .
Figure 1. Example of a choice card.
4.2. Experimental design of the CE
The experimental design of the choice experiment allocates combinations of levels to the attributes which together make up a choice card that is shown to a respondent. The design was generated using the software Ngene, in accordance with the principle of D-efficiency. This principle means that the design is created in such a way that it provides the maximum amount of information that can be obtained from the choices to be made, which is expected to result in the smallest variance of the choice model. A so-called ‘point efficient design’ of 24 and 48 choice cards has been generated for, respectively, CE1 (three attributes) and CE2 (all five attributes), using prior estimates of the coefficient values obtained from the results of the pilot survey. Such a statistical efficient design that includes prior information about coefficient values is more statistically efficient and robust to model misspecification than statistical designs without prior information, or orthogonal designs that were often used in earlier CE studies (Ferrini and Scarpa Citation2007). The design satisfies the properties of level balance, moderate attribute level overlap, and orthogonality (uncorrelated attributes) and excludes dominant choice options. A commonly applied ‘blocking procedure’ divides the total number of choice cards of the choice experiment in such a way that each respondent had to answer only six choice cards.
4.3. Sample characteristics
In total 512 respondents completed the CE surveys, respectively, who were about equally distributed over the different questionnaire versions.Footnote2 The response rate to the surveys was about 50%. The sample is reasonably representative for the general population in the Netherlands as several key statistics show. In particular, 52% of the respondents were male. About 90% of the respondents were born in the Netherlands. The average age is 51 years. About 21% of respondents have a mode income (about €1500 net income per month), and 52% have a higher than mode income. The share of respondents who have completed a high education is 6% in the CE sample.
5. Statistical methods
5.1. Estimation methods of the CE
The estimation method of the CE is based on the random utility model which assumes that the choice probability p ij of an individual i selecting alternative j equals the probability that the utility of alternative j is greater than, or equal to, the utility associated with an alternative q for every alternative in the choice set (q = 1 … J) (McFadden Citation2001; Botzen et al. Citation2013):
where V ijt and ε ijt are, respectively, the observed and unobserved components of individual i’s utility associated with alternative j in choice card t. ε ijt is assumed to follow a type 1 extreme value distribution. V ijt can be expressed as βX ijt , where X ijt are the observed attribute levels of choice alternative j with coefficients β.
The choice model is estimated by applying a mixed logit model with a normally distributed zero mean error correction component. The error correction component is included, in order to allow for the variance to differ between the alternatives and the no measures alternative (Scarpa et al. Citation2007). In this model, individual i’s utility for alternative j = 1, …, J in choice setting t = 1, …, T is (e.g. Botzen et al. Citation2013):
Six sequential choice cards are answered by each respondent (so that T = 6), which means that the error terms are not independent. Time subscript t represents this structure, and is explicitly modelled by estimating the same error for choices made by the same respondent (Train Citation2003). d
jm
is an indicator variable that equals 1 if the error component m appears in utility function j (in this application the utility of an environmental protection option), and 0 otherwise (in this application the utility of no additional environmental protection). The M random effects (σ
m
u
imt
) are normally distributed with a mean equal to zero and variance (Botzen et al. Citation2013). The choice probability of this model is:
The vector β′ contains coefficients β jki of attributes X jik , k = 1, …, K which can be specified to be random as follows:
ρ jk is the population mean parameter and δ jk is a vector of coefficients which produce an individual-specific mean. Individual heterogeneity in the means of the randomly distributed coefficients is introduced by a i , which is a set of choice invariant characteristics. c jki is a random term with mean zero and standard deviation 1. σ jk is the standard deviation of the marginal distribution of ρ jk . As it is common, the uniform distribution is used to model the random parameters of the attributes that are dummy coded.Footnote3 Following Train (Citation2003), individual-specific parameters, conditional on choice, for a random coefficient can be estimated by simulation of:
It is these individual-specific parameters that will be used for WTP calculations. Marginal effects (MEs) have a more intuitive interpretation than coefficients (β) in choice models and are computed using probability weighted-sample enumeration (see Louviere et al. Citation2000; Botzen and van den Bergh Citation2012b for the calculation of MEs of interaction variables). MEs represent the percentage change in the probability of choosing an environmental protection alternative with respect to a unit increase in the level of an explanatory variable.
5.2. Coding of the variables
Appendix B describes the variables used in the analysis. Different methods of coding categorical variables have been applied. Dummy variables are used for several categorical variables, such as the levels of nature protection which are attributes in the CEs. Ordinal qualitative variables, which are partitioned into J intervals, can be transformed into values on the real axis using an approach proposed by Terza (Citation1987).Footnote4 Using this approach, an ordered categorical variable (e.g. categories of the degree of importance of nature ‘not important’ or ‘very important’) can be translated into an underlying numerical variable with a continuous scale (e.g. a latent variable of the degree of importance) (see also van Praag et al. Citation2003; Botzen and van den Bergh Citation2012a, Citation2012b). The Terza (Citation1987) coding has been applied to ordinal variables with relatively many answer categories since it has been shown that this results in gains of efficiency and reduced bias compared with using dummy variables (Terza Citation1987).
6. Results
The choice experiments are first analysed by estimating an attribute only model for each of the two versions of the CE. This model provides straightforward to interpret insights into the relative importance of each attribute on the respondent’s choice for an alternative of environmental protection. The attribute only model of CE1 estimates how individuals’ utility of environmental protection (choice alternative A or B) relates to the attributes nature protection in the Netherlands (x), nature protection in the Caribbean Netherlands (y), and the tax. Formally,
In addition the attribute only model of CE2 includes attributes of nature protection in the respondents’ own environment (v) and the rest of the world (w). Formally,
In both models a constant parameter has been used to model the utility of the no measures alternative, which is defined as implementing no additional environmental protection measures that result in a small degradation of all nature attributes. The left columns in show the estimation results of the models in equations 6 and 7. The significant standard deviation of the error component in both models indicates that the variance of the choice alternatives (A and B) is higher than the model variance of the status quo, as is expected. This result is consistent with other studies that find that the variance of hypothetical alternatives is larger than that of the reference or status quo alternative, which has been called the ‘status quo’ effect and implies fewer randomness in the model predictions for the no measures alternative compared with the protection alternatives (Hess and Rose Citation2009; Botzen and van den Bergh Citation2012b). The pseudo R2 of 0.42 and 0.38 of the models for CE1 and CE2, respectively, indicate a good level of model fit. The level of additional tax has the usual negative influence on the choice for one of the environmental policy alternatives in both models.
Table 1. Coefficient estimates and marginal effects in brackets of the attribute only models (left) and full choice models (right) for versions CE1 and CE2.
In the model of CE1, the coefficient estimates of all attributes are statistically significant at the 1% level. The increasing marginal effect (ME) per level shows that individuals value higher levels of improvements of nature in the Netherlands more than lower levels. The standard deviations of the random parameters of x indicate that significant heterogeneity exist in preferences for nature in the Netherlands. Small improvements of nature in the Caribbean Netherlands are higher valued (ME = 1.72) than keeping nature in that area at a constant level (ME = 1.6). In contrast, large improvements of nature in the Caribbean Netherlands are valued lower (ME = 1.50) than keeping nature unchanged and small improvements, while large improvements are preferred over a degradation of nature in that area. The significant and high standard deviation of the parameter of that attribute level indicates that there is substantial variation in preferences for a large improvement of Caribbean Netherlands nature.
Interesting differences in preferences for nature can be observed when the geographical scope of the valuation method is expanded to include nature in the respondents’ own environment and the rest of the world (CE2). The coefficients of the variables of keeping nature unchanged are not statistically significant in any of the four areas. Although the average coefficient value of keeping nature unchanged in the respondent’s own environment is insignificant, the standard deviation of this parameter indicates that heterogeneity in these preferences are significant. Large improvements of nature in that area (ME = 1.37) are significantly higher valued than small improvements of which the coefficient is not significant. Small improvements of nature in the Netherlands are significantly higher valued (ME = 1.15) than keeping nature constant. But, large improvements are not higher valued than small improvements (ME = 1.07), although significant heterogeneity exists in the valuation of these parameters. For nature in the Caribbean Netherlands, small improvements are valued significantly more than unchanged nature (ME = 1.46), while large improvements (ME = 1.07) are valued less than small improvements. The coefficient values of nature improvements in the rest of the world increase with the size of nature improvement, and significant heterogeneity is present in preferences for the highest attribute level.
Additional insights into heterogeneity in individual preferences for nature protection are obtained by estimating interactions of the choice attributes with explanatory variables. A variety of models have been estimated by including interactions with the socio-demographic variables of being born in the Netherlands, female, household size, high education level, age, and income. In addition, a variable of the perceived importance of nature by respondents has been included. The right columns in show the results of the full models of CE1 and CE2 which include only significant interactions (at the 5% level) and specifies parameters of the attribute variables only as random when significant heterogeneity is present, while parameters of the attribute variables with insignificant random preference heterogeneity are specified as being fixed. Moreover, as is common the price parameter is modelled as fixed. The significant interactions of income with the tax level in CE1 and CE2 indicate that high-income individuals are less sensitive to the tax amounts in their choice, meaning that they have a higher WTP for nature. Moreover, interactions with the levels of nature improvements in the Netherlands and Caribbean Netherlands and age are significant in model CE1, showing that older individuals place a lower value on nature protection, while interaction variables with age are insignificant in CE2. Several significant positive interactions are present between the degree of individual perceived importance of nature and levels of nature improvement, as would be expected. Females place a lower value on large improvements of nature in the Caribbean Netherlands in CE1. The observation that overall fewer significant interaction variables appear in CE2 than CE1 suggests that expanding the scope of the experiment has the effect that less preference heterogeneity can be explained by observed characteristics.
provides the WTP values for the attributes of nature improvement in the CE models, which are calculated using the ratio of the marginal utility value of an attributed and the negative of the price coefficient (Train Citation2003). WTP values for the levels of nature protection in the Netherlands are statistically significantly different between CE1 and CE2 for the levels of keeping nature unchanged and a small improvement. In particular, average WTP for keeping nature unchanged in the respondent’s own environment and the remainder of the Netherlands is not significantly different from zero in CE2, while the average WTP for keeping nature unchanged of €22 is significantly higher than zero in CE1. A small improvement in nature in the Netherlands is valued about twice as large in CE1 (€29) than in CE2 (€16) where a small improvement in nature in the own environment is on average not significantly higher than zero. Only large improvements in nature in the Netherlands are not significantly different between CE1 (€29) and CE2 (€15 + €17 = €32). WTP for keeping nature in the Caribbean Netherlands unchanged is statistically significantly higher in CE1 than CE2 where this value is zero, while WTP values for the levels of nature improvement do not differ significantly (at the 5% level) between CE1 and CE2.
Table 2. Average WTP values (€ per month) for nature improvements according to the CE models.
In summary, H1 about geographical scope invariance is rejected for policies that keep nature unchanged in the Netherlands or Caribbean Netherlands as well as for a small improvement of nature in the Netherlands, while H1 cannot be rejected for a large improvement of nature in the Netherlands or Caribbean Netherlands or a small improvement in the latter area. The observed violations of H1 have substantial implications for the design of certain nature protection policies. As an illustration, policies of preventing a degradation of nature have an average WTP value of about €20 in the experiment with the smaller geographical scope, while this WTP is not significantly different from zero in the experiment with the more extensive scope.
Results about sensitivity of WTP to the scope of the level of nature improvement (H2) are mixed. WTP values for small and large improvements of nature in the Netherlands are not statistically different from each other, while they are statistically significantly higher than WTP for keeping nature unchanged in CE1 and CE2. A small improvement and unchanged nature in the Caribbean Netherlands have a significant WTP in CE1, but differences between these WTP values are insignificant. In CE2 the WTP value for a small improvement in that area is significantly higher than the WTP of keeping nature unchanged. A large improvement is in both experiments significantly less valued than a small improvement which suggests that most respondents find a small improvement in Caribbean Netherlands nature the preferred option. WTP values for nature protection in the respondent’s own environment and the rest of the world relate to the level of improvement in the expected direction, but some low attribute levels have a WTP that is not significantly different from zero.
7. Conclusions
Sensitivity to scope is an important recurring theme in economic valuation studies of environmental goods. Effects on obtained WTP values of the geographical scope of a valuation exercise have hardly been studied, especially in applications of CEs, while in the design phase of CE and also CVM studies often decisions have to be made by researchers about geographical scope issues, like the inclusion of substitute sites. This study shows that such decisions about scope, which are often untested, can have large consequences for the obtained valuation results.
This study offers a CE analysis of geographical scoping. The WTP for nature protection in the Netherlands mainland and the Caribbean Netherlands are examined. This is a unique policy setting since at the end of 2010 the islands of the Caribbean Netherlands received the constitutional status of special Dutch municipalities, meaning that a large area of biodiversity-rich nature was added to the Netherlands of which protection has become a responsibility of the Dutch government. An important question for policy-makers answered by this study is how much Dutch citizens value nature protection in the Caribbean Netherlands, relative to nature in the mainland.
The collection of data by means of about 500 CE surveys with two questionnaire versions of distinct ways in which WTP for nature protection in different areas was elicited allows for testing the influence of geographical scope determined by the CE design on WTP results. In particular, the CEs elicit WTP for nature protection using experimental versions with a different scale of geographical scope: namely, one CE values nature protection in the Netherlands and the Caribbean Netherlands, while another CE expands the geographical attributes to the respondents’ own environment and the rest of the world.
The following conclusions are drawn from our two main research hypotheses.
First, we reject H1 about invariance of the results to the geographical scope of the CE design. This was tested by comparing obtained WTP results from the CE with the narrow geographical scope of nature protection, namely in the Netherlands and Caribbean Netherlands, with a broader scope CE that includes nature protection in the respondent’s own environment, the rest of the Netherlands, the Caribbean Netherlands and the rest of the world. In particular, this geographical scope invariance is rejected for policies that keep nature unchanged in the Netherlands or Caribbean Netherlands and for a small improvement of nature in the Netherlands. H1 cannot be rejected for a large improvement of nature in the Netherlands or Caribbean Netherlands or a small improvement in the latter area.
Second, mixed results of sensitivity of WTP to the scope of the level of nature improvement (H2) are found, as has also been observed in other studies. In this respect, a notable observation is that WTP values for preventing a degradation of nature in the Netherlands and Caribbean Netherlands do not significantly differ from a small degradation of nature in the CE with the more extensive geographical scope, while this difference is significant in the experiment with the narrower scope. In other words, broadening the geographical scope of the environmental good shown on the choice card has the effect that lower levels of nature improvement are valued less, which suggests that the same budget is diluted across more attributes.
Our finding that the geographical set-up of the choice experiment can affect the valuation outcome, has implications for the design of CEs. In particular, decisions made about the geographical scope in terms of included attributes can have important effects on obtained WTP results. This study shows that expanding the geographical scope results in lower WTP values for low levels of environmental goods. Given the expanding use of environmental valuation techniques, and CEs in particular, future research should examine whether the scope effects observed in this study are also found in other policy settings. Especially a more systematic testing of assumptions made about geographical scoping in the design phase of valuation surveys is needed for which this study aims to provide a useful staring point.
Besides generating methodological lessons, this study has also had important policy implications which led to notable changes on the ground. Local managers adopted the economic valuation results in conducting extended cost-benefit analyses for various green infrastructural investments. WWF used the results of the study to defend their continued active presences in the Caribbean Netherlands. But most importantly, the large support expressed by Dutch residents for nature management in the Caribbean Netherlands motivated the State Secretary of Economic Affairs Sharon Dijksma to allocate an additional budget of €7.5 million for this purpose (Dijksma Citation2013). Various nature projects have been financed through this fund, such as controlling overgrazing, reef restoration, trail improvement, nature education and environmentally friendly farming practices. This example of policy impact demonstrates that an economic valuation study, if communicated well, can play an important role in informing influential decision-makers and bridging the science-policy gap.
Disclosure statement
No potential conflict of interest was reported by the authors.
Funding
This work was supported by World Wildlife Fund of the Netherlands; Netherlands Ministry of Economic Affairs, Agriculture, and Innovation (EL&I).
Acknowledgements
We thank Brigitte Bendermacher of Multiscope for the online research facilitation. Next, we are very grateful to Hayo Haanstra, Guus Schutjes and Astrid Hilgers of the Netherlands Ministry of Economic Affairs, Agriculture, and Innovation (EL&I) and to Carel Drijver of the World Wildlife Fund of the Netherlands (WWF-NL) for their financial support of this study. We want to express our appreciation to Luke Brander, Roy Brouwer, Jeroen van den Bergh, Frans Oosterhuis, Paul Hoetjes, Bram Tijdhof and Esther Wolfs for providing invaluable feedback in the design phase of the survey.
Notes
1. As an illustration, the Caribbean Netherlands measures more than 2800 km2 of marine reserves, which include coral reefs, and is the home of seven endemic plant species and 85 endemic animal species.
2. The total numbers of completed questionnaires per version are: 236 for CE1, and 276 for CE2.
3. Model parameters are estimated by conducting maximum simulated likelihood with Monte Carlo integration using 250 Halton quasi-random draws.
4. These are characterised by a continuous unobservable ordinal latent index, where each interval is ranked (1 through J) in increasing order according to its supremum (Terza Citation1987).
References
- Arrow KJ, Solow R, Leamer E, Portney P, Radner R, Schuman H. 1993. Report of the NOAA panel on contingent valuation. Fed Reg. 58:4601–4614.
- Batavia C, Nelson MP. 2017. For goodness sake! What is intrinsic value and why should we care? Biol Conserv. 209:366–376.10.1016/j.biocon.2017.03.003
- Bateman IJ, Day BH, Georgiou S, Lake I. 2006. The aggregation of environmental benefit values: welfare measures, distance decay and total WTP. Ecol Econ. 60:450–460.10.1016/j.ecolecon.2006.04.003
- Botzen WJW, van den Bergh JCJM. 2012a. Risk attitudes to low-probability climate change risks: WTP for flood insurance. J Econ Behav Organ. 82(1):151–166.10.1016/j.jebo.2012.01.005
- Botzen WJW, van den Bergh JCJM. 2012b. Monetary valuation of insurance against flood risk under climate change. Int Econ Rev. 53(3):1005–1025.10.1111/iere.2012.53.issue-3
- Botzen WJW, de Boer J, Terpstra T. 2013. Framing of risk and preferences for annual and multi-year flood insurance. J Econ Psychol. 39:357–375.10.1016/j.joep.2013.05.007
- Carson RT, Flores N, Meade NF. 2001. Contingent valuation: controversies and evidence. Environ Resour Econ. 19:173–210.10.1023/A:1011128332243
- Carson RT, Mitchell RC. 1995. Sequencing and nesting in contingent valuation studies. J Environ Econ Manage. 28:155–173.10.1006/jeem.1995.1011
- Diamond PA, Hausman J, Leonard GK, Denning MA. 1993. Does contingent valuation measure preferences? Experimental evidence. In: Hausman JA, editor. Contingent valuation: a critical assessment. New York (NY): North-Holland; p. 41–89.
- Dijksma SAM. 2013. Besluit van de Staatssecretaris van Economische Zaken van 11 September 2013, Artikel 14: Bijzondere uitkering natuur. nr. 13030742. Den Haag.
- Elliot R. 1992. Intrinsic value, environmental obligation and naturalness. The Monist. 75:138–160.10.5840/monist199275212
- Ferrini S, Scarpa R. 2007. Designs with a priori information for nonmarket valuation with choice experiments: a Monte Carlo study. J Environ Econ Manage. 53:342–363.10.1016/j.jeem.2006.10.007
- Foster V, Mourato S. 2003. Elicitation format and sensitivity to scope. Environ Resour Econ. 24:141–160.10.1023/A:1022856329552
- Goldberg I, Roosen J. 2007. Scope insensitivity in health reduction studies: a comparison of choice experiments and the contingent valuation method for valuing safer food. J Risk Uncertainty. 34:123–144.10.1007/s11166-007-9006-9
- Haneman M. 1994. Valuation the environment through contingent valuation. J Econ Perspect. 8(4):19–43.10.1257/jep.8.4.19
- Hanley N, Schläpfer F, Spurgeon J. 2003. Aggregating the benefits of environmental improvements: distance-decay functions for use and non-use values. J Environ Manage. 68:297–304.10.1016/S0301-4797(03)00084-7
- Heberlein TA, Wilson MA, Bishop RC, Schaeffer NC. 2005. Rethinking the scope test as a criterion for validity in contingent valuation. J Environ Econ Manage. 50:1–22.10.1016/j.jeem.2004.09.005
- Hess S, Rose JM. 2009. Should reference alternatives in pivot design SC surveys be treated differently? Environ Resour Econ. 42:297–317.10.1007/s10640-008-9244-6
- Hoevenagel R. 1996. The validity of the contingent valuation method: perfect and regular embedding. Environ Resour Econ. 7:57–78.10.1007/BF00420427
- Hoyos D. 2010. The state of the art of environmental valuation with discrete choice experiments. Ecol Econ. 69:1595–1603.10.1016/j.ecolecon.2010.04.011
- Jorgensen SL, Olsen SB, Ladenburg J, Martinsen L, Svenningsen SR, Hasler B. 2013. Spatially induced disparities in users’ and non-users’ WTP for water quality improvements: testing the effect of multiple substitutes and distance decay. Ecol Econ. 92:58–66.10.1016/j.ecolecon.2012.07.015
- Kahneman D, Knetsch JL. 1992. Valuing public goods: the purchase of moral satisfaction. J Environ Econ Manage. 22:57–70.10.1016/0095-0696(92)90019-S
- Kahneman D, Tversky A. 1984. Choices, values, and frames. Am Psychol. 39:341–350.10.1037/0003-066X.39.4.341
- Louviere JJ, Hensher DA, Swait JD. 2000. Stated choice methods: analysis and application. Cambridge: Cambridge University Press.10.1017/CBO9780511753831
- Madden P. 1991. A generalization of Hicksian q substitutes and complements with application to demand rationing. Econometrica. 59:1497–1508.10.2307/2938377
- McFadden D. 2001. Economic choices. Am Econ Rev. 91(3):351–378.10.1257/aer.91.3.351
- Nunes PALD, Schokkaert E. 2003. Identifying the warm glow effect in contingent valuation. J Environ Econ Manage. 45:231–245.10.1016/S0095-0696(02)00051-7
- Piccolo JJ. 2017. Intrinsic values in nature: objective good or simply half of an unhelpful dichotomy? J Nat Conserv. 37:8–11. 1617-1381.
- van Praag BMS, Frijters P, Ferrer-i-Carbonell A. 2003. The anatomy of subjective well-being. J Econ Behav Organ. 51(1):29–49.10.1016/S0167-2681(02)00140-3
- Randall A, Hoehn JP. 1996. Embedding in market demand systems. J Environ Econ Manage. 30:369–380.10.1006/jeem.1996.0025
- Rollins K, Lyke A. 1998. The case for diminishing marginal existence values. J Environ Econ Manage. 36:324–344.10.1006/jeem.1998.1045
- Sandler R. 2012. Intrinsic value, ecology, and conservation. Nat Educ Knowledge. 3(10):4.
- Sarkar S. 2005. Biodiversity and environmental philosophy: an introduction. Cambridge: Cambridge University Press.10.1017/CBO9780511498558
- Schaafsma M, Brouwer R. 2013. Testing geographical framing and substitution effects in spatial choice experiments. J Choice Model. 8:32–48.10.1016/j.jocm.2013.04.007
- Schaafsma M, Brouwer R, Gilbert A, Van den Bergh JCJM, Wagtendonk A. 2013. Advancing the estimation of distance-decay functions to account for substitution and spatial heterogeneity in stated preference research. Land Econ. 89(3):514–537.10.3368/le.89.3.514
- Scarpa R, Willis KG, Acutt M. 2007. Valuing externalities from water supply: status quo, choice complexity and individual random effects in panel kernel logit analysis of choice experiments. J Environ Plan Manage. 50:449–466.10.1080/09640560701401861
- Schkade DA, Payne JW. 1994. How people respond to contingent valuation questions: a verbal protocol analysis of willingness to pay for an environmental regulation. J Environ Econ Manage. 26:88–109.10.1006/jeem.1994.1006
- Smith VK, Osborne LL. 1996. Do contingent valuation estimates pass a “scope” test? A meta-analysis. J Environ Econ Manage. 31(3):287–301.10.1006/jeem.1996.0045
- Soulé ME. 1985. What is conservation biology? Bioscience. 35:727–734.
- Terza JV. 1987. Estimating linear models with ordinal qualitative regressors. J Econom. 34(3):275–291.10.1016/0304-4076(87)90013-3
- Thaler RH. 1999. Mental accounting matters. J Behav Decis Mak. 12:183–206.10.1002/(ISSN)1099-0771
- Train KE. 2003. Discrete choice models with simulation. Cambridge: Cambridge University Press.10.1017/CBO9780511753930
- Veisten K, Hoen HF, Navrud S, Strand J. 2004. Scope insensitivity in contingent valuation of complex environmental amenities. J Environ Manage. 73:317–331.10.1016/j.jenvman.2004.07.008
- Walsh RG, Johnson DM, McKean JR. 1992. Benefits transfer of out-door recreation demand studies: 1968–1988. Water Resour Res. 28:707–713.10.1029/91WR02597
Appendix A. Information questionnaires
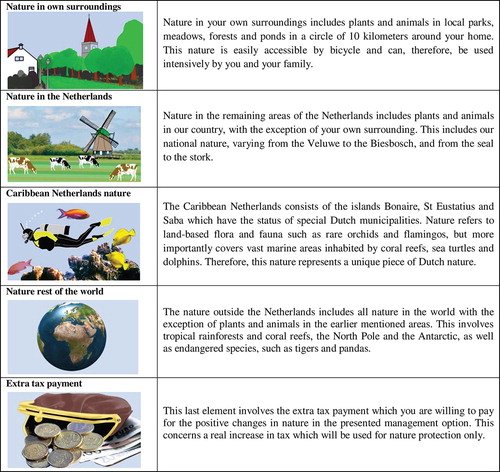
The five attributes used in the online survey including their explanation are shown in Figure . Before presenting the attributes the following text was shown:
Worldwide, nature is under pressure. Without additional conservation efforts, nature will degrade further. Nature protection is costly and this is why choices will have to be made about what to protect and what not to protect. In the following questions, we will ask you to make six choices between three policy options that vary in terms of ‘how much’ nature is managed and ‘where’ nature is protected. These options consist of the following elements:
Figure A1. Explanation of the attributes used in the choice experiment.
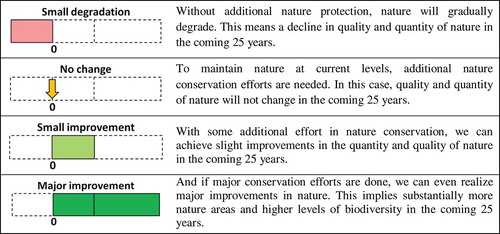
To explain the various levels of the nature protection attributes, the following text was presented in the online questionnaire, before showing Figure :
The changes that nature can undergo may vary between a small degradation to large improvements. The meaning of these changes is as follows.
Figure A2. Levels of the nature attributes that were applied in the choice experiment.