
ABSTRACT
Understanding changes in livestock production and their relationship with socio-economic and environmental impacts is important for exploring the pathways towards sustainable development goals (SDGs) of food systems. We used pig production in China as a case study to evaluate how socio-economic indicators influence pig production and nutrient losses using the environmental Kuznets curve (EKC) and Gini index. The recent acceleration in pig production is driven by an increase in average consumption of pig products per capita and government policies that support new pig production systems. The relationship between the rapid growth of worldwide pig production and its environmental impacts can be described using the EKC. The turning point in the EKC, i.e. the average income at which environmental degradation starts to decrease, is estimated to be USD 15–35 000 per capita when the pig production density is greater than 5.0 head per hectare of arable land. China’s pig production has not yet reached the EKC turning point; however, given the uneven distribution of pig production systems and supply chains (feed and water) and the limited land availability for utilizing manure nutrients, the continued increasing demand for pork in China will inevitably result in continued environmental degradation. The EKC turning point should be reached earlier than the global average level, especially as environmental regulation has been reinforced since 2014. Future government policies and regulations that optimize geographical locations for sustainable pig production (i.e. better spatial planning) and support improved manure nutrient management at both regional and farm levels are required.
Introduction
Currently, there are increasing concerns about how we manage our food systems to achieve sustainable development goals (SDGs) and maintain a healthy environment, because food production and consumption are linked to global resource use, environmental sustainability, human health, and biodiversity protection (Tilman and Clark Citation2014; Crist et al. Citation2017; Springmann et al. Citation2018). The livestock sector is one of the key sectors for food systems because it utilizes approximately 70% of global agricultural land resources, consumes a large proportion of global water resources, and contributes greatly to nutrient inputs to and losses from agriculture production systems (Mekonnen and Hoekstra Citation2012; Bouwman et al. Citation2013; van Zanten et al. Citation2018). Livestock production contributes to reactive nitrogen (N) and phosphorus (P) losses, and greenhouse gas emissions to the environment (Gerber et al. Citation2013; Bai et al. Citation2018).
China faces increasing pressure to improve the sustainability of its food production systems, especially from its rapidly increasing livestock production sector (Schneider Citation2011; Bai et al. Citation2016, Citation2018; Strokal et al. Citation2016; Wang et al. Citation2018). This is particularly important for the pig production sector, which now accounts for approximately 50% of global production, and results in significant manure generation and associated pollution from its mismanagement (Bai et al. Citation2014, Citation2016; FAO Citation2019). For example, N and P losses from the pig production–consumption chain in China increased to 5289 and 829 Gg in 2010, which is 30 and 95 times higher than that in 1960, respectively (Bai et al. Citation2014). Whilst several studies have described the recent policies and technological improvements for the pig industry (Chen et al. Citation2007; Kuang and Ying Citation2011), few studies have explored the relationship between socio-economic indicators and environmental impacts for the evolution of pig production in China. Understanding the evolution of China’s pig production system and their effects, especially linked with socio-economic indicators and nutrient losses, is important for achieving a sustainable food production system in China.
The environmental Kuznets curve (EKC) has been widely used to analyse the relationships among income, social inequality, and pollution (Selden and Song Citation1994; Torras and Boyce Citation1998; Zhang et al. Citation2015), although there are debates about the appropriateness of using the EKC, as there is not always a “U” curve between income and environmental degradation for all countries. This is because sometimes poor countries adopt high-level environmental protection standards within a short time (Dasgupta et al. Citation2002; Stern Citation2004). However, the EKC has been used to explore agricultural N pollution, and a typical “U” shape has been found between gross domestic product (GDP) per capita and N surplus in agricultural soils in France and the United States of America (USA) (Zhang et al. Citation2015). Few studies have implemented the Kuznets curve analysis to livestock pollution, especially for countries with high production density. However, understanding this relationship as well as the agriculture and environmental policies of different countries is important for China as it begins to explore how best to achieve more sustainable pig production.
China is a large country with huge regional variation, and understanding of the evolution of the pig production system requires a deeper understanding of the different distributions among different regions, and its relationship with local socio-economic and environmental indicators. Many factors contribute to the distribution of livestock production, e.g. market demand, feed availability, and livestock production density (Herrero et al. Citation2013; Robinson et al. Citation2014). For example, Denmark implements a maximum livestock density that affects the distribution and farm size of livestock production systems (Willems et al. Citation2016). The Gini coefficient (derived from the Lorenz curve) has been widely used to evaluate income disparity and to estimate the fairness of global resource use, e.g. water use and agricultural production (Sadras and Bongiovanni Citation2004; Seekell et al. Citation2011). Hence, the Lorenz curve can be used to evaluate how the evenness of pig production is affected by social-economics and natural resources use, which would help explore the implications for pig production, feed supply, and manure recycling.
Therefore, the aims of the present study were to i) evaluate the evolution of China’s pig production and its relationship with socio-economic indicators; ii) quantify the contribution of the main socio-economic indicators to changes in pig production systems and nutrient losses; iii) analyse the relationship of socio-economic indicators with the development of pig production in leading pig production countries using EKC and the Lorenz curve, and iv) explore the implications for policies and scientific innovations for pig production in China.
Material and methods
Environmental Kuznets curve and socio-economic indicators
The EKC has been widely used to indicate the relationship between social development and environmental degradation, and to predict the turning point of environmental protection, as shown for N fertilizer use and crop production (Zhang et al. Citation2015). Here, the environmental indicator of pig production was expressed as pig production intensity, i.e. the number of pigs produced per hectare of agricultural land. However, since most of China’s pig production is in regions with no grassland, we expressed pig production intensity per hectare of arable land. We assessed the top pig production countries during this analysis, which represented approximately 90% of global pig production in 2017. These countries were China, the USA, Germany, Spain, Brazil, Vietnam, France, Philippines, Denmark, Italy, Netherlands, Mexico, South Korea, Japan, Belgium, Myanmar, Thailand, and the United Kingdom (UK). These countries provide a diverse range of income levels and pig production density (FAO Citation2019; World Bank, Citation2018). The average GDP per capita of the different countries was derived from the World Bank Citation2018). The total number of slaughtered pigs and the area of agricultural and arable land were derived from the FAO database (FAO Citation2019). The self-sufficiency of pork production was calculated for the top pig producing nations, which was defined as the ratio of total domestic supply and domestic production, both derived from the FAO database (FAO Citation2019).
Correlation of pig production with socio-economic and environmental indicators at the regional level
The following four indicators were selected: i) feed resource availability (maize production), ii) land availability (arable land area), iii) human population, and iv) total GDP. Feed resource availability and land availability were expressed as environmental and crop-livestock integration indicators, and the human population and total GDP level were expressed as demand indicators. Four countries with contrasting pig production densities were selected and compared with China, with these being the Netherlands and Denmark (high pig production density), the USA (a trend of increasing pig production density), and the UK (a trend of decreasing pig production density). Understanding the evenness of pig production distribution among these four selected socio-economic indicators and policies to control the pig production in these countries would provide useful information for China.
Pig production, feed and land availability, human population, and GDP volume at the regional level in China were derived from the Chinese Statistic Yearbook (NBSC Citation2018). Data for the Netherlands, Denmark, and the UK were obtained from the European NUTS-2 statistics (European Commission Citation2018). For the USA, the pig population, human population, total GDP, and feed and land availability were derived from a USDA database.
The Gini index has been widely used to indicate the income or wealth distribution of a nation’s residents and is the most commonly used measure of inequality (Bourguignon and Morrisson Citation2002). The Gini coefficient can also be used to evaluate the effect of socio-economic factors on the unevenness of livestock production. The Gini index is usually defined mathematically based on the Lorenz curve. The algorithm of correlation calculations followed the definition of the Gini index. In the present study, first, we simulated the relationship between different indicators and pig production among different countries using Mathematica Software 8.0. Then, we calculated the area using the definite integral (Bourguignon and Morrisson Citation2002). Finally, the Gini index was regarded as the ratio of the area that lies between the line of equality and the Lorenz curve over the total area under the line of equality.
Results and discussion
Effect of demand factors on pig production
China relies heavily on its domestic pig production to fulfil the demand for pork meat, as the self-sufficiency rate of pork has been > 99% over recent decades (FAO Citation2019). Therefore, pig production has been influenced by national demand and policies. There is a significantly positive relationship between the total human population and pig production (). The trend can be divided into two parts, including a phase of gradual increase when the human population was < 1.1 billion (between 1964 and 1990) and a quicker increase section when the human population became greater than 1.1 billion (after 1990) (). Therefore, as well as an increasing human population, other socio-economic factors influence pig production, such as the average income level of residents and subsequent demand for livestock products (Tilman et al. Citation2011). The income level has very strong effects on pig production, especially when the income level is between USD 0 and 2500 per capita ().
Figure 1. Effect of the total population, average gross domestic product (GDP) value per capita, and urbanization rate on the demand for pig products from 1961 to 2016 in China. Source of data: FAO (Citation2019) and NBSC (Citation2018).
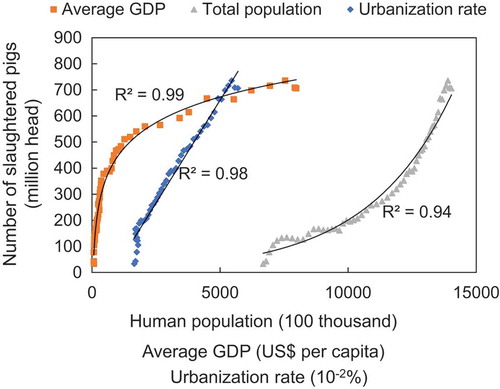
Dietary preferences and food affordability differ between rich and poor people, which may affect pig production. In 1985, urban people consumed approximately 17 kg pork meat per capita per year, which was 60% higher than that of rural people (NBSC Citation2018). Currently, urban people consume only 30% more pig meat than rural people in China (MOARA Citation2017). This partly explains the significant relationship between the urbanization rate and pig population (), and corroborates with the findings of Hou et al. (Citation2013).
Effect of policy factors on pig production
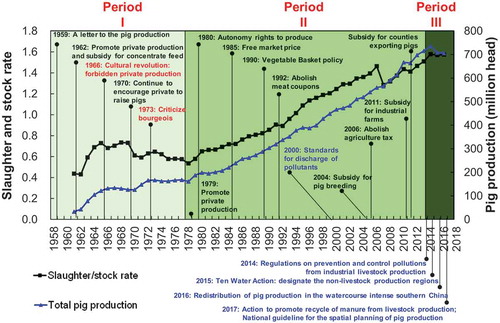
Pig production, as well as other livestock production, is influenced by domestic policy (Bai et al. Citation2018); however, for Chinese people, the rearing of pigs has a strong link with the sense of a specific place, i.e. home. The Chinese character 家 (meaning “home”) is made of two parts: the upper part, 宀, denoting a shelter and the lower part, 豕, meaning “pig” (an ancient Chinese character) (Wang et al. Citation2010). The importance of pig rearing is not only concerned with converting inedible food to more digestible animal proteins, but also with generating manure that is a precious resource of nutrients when there is no chemical fertilizer industry. Owing to its strategic position, pig production was heavily affected by policies, which can be divided into three developmental periods based on the trends in changes of pig production and purpose of regulation policies: Period I) un-managed development with no environmental regulations (1961–1978), Period II) rapid development with little environmental regulations (1979–2013), and Period III) stagnation of development with strengthened environmental regulations (2014 onwards) ().
Figure 2. Changes of total pig production and slaughter/stock rate of pig production from 1958 to 2018 in China, divided into three development periods: Periods I (1961–1978), II (1979–2013), and III (2014–onwards) and related key policies during each period.
Policies were also distinguished in three groups: positive supporting policies in black, negative supporting policies in red, and environmental regulations in blue.
Period I – wandering development
During Period I, there was a rapid increase in pig production, which expanded by 2.7 times between 1961 and 1965 (). This was partially due to the actions of Chairman Mao Zedong, who wrote a policy recommendation letter to the public and central government in 1959, emphasizing that the importance of pig production should be at the same level as the Grain First policy (MOARA Citation2009). This was owing to the severe shortage of nutrients for fertilizing crops during that period, thus more pigs could generate more organic manure for recycling to the land and increase crop yields. Meanwhile, the exporting of pork and related products was an important source of foreign exchange during that period (MOARA Citation2009). Since then, pig production developed rapidly. However, total pig production only increased by 32% between 1965 and 1978 () because of the uncoordinated policies targeting collective production and private production (Chen et al. Citation2007). Additionally, there were several policies promoting pig production, for example, in 1962 farmers could receive a bonus of cereal feed when they sold pigs to the supply and marketing cooperatives, and the central government proposed a national campaign of pig production in 1970 (). During this time, there were short periods when pig production increased; however, the enthusiasm of farmers to produce pigs was suppressed because of unstable policies. Not surprisingly, no environmental regulations were mentioned, as the priority was to boost production during this period.
Period II – rapid development
During Period II, production supporting policy was more stable and pig production steadily shifted towards industrial production. Thus, total pig production increased by 2.9 times from 1978 to 2013 (). Supporting policies included the liberation of markets and the removal of barriers, such as the autonomy right to produce in 1980 and the free market price policy in 1985 (). The cancellation of meat supply coupons and a greater emphasis on the importance of vegetable and meat basket policies also contributed to an increase for demand of pork (Bai et al. Citation2018). Direct subsidies, such as bonuses for counties that exported large amounts of pigs within China and subsidies for reproductive sows, as well as indirect subsidies, such as cancellation of the agricultural tax in 2006, also contributed to the increase of pig production ().
This increase of pig production was caused by the shift in production systems, from the backyard and traditional systems to the large-size industrial production system. During this period, the industrialization rate of pig production jumped from approximately 3% to 64% (Bai et al. Citation2014). This great transition contributed to the improvement of production efficiency, which was reflected by the feed requirement per unit of pork energy or protein produced (Bai et al. Citation2018) and also the slaughter/stock ratio of pig production, which was aligned with the rapid increase of pig production during this period (). However, this transition in production was so rapid that pig production lost most of its functional abilities and created severe environmental problems (Bai et al. Citation2014, Citation2018; Strokal et al. Citation2016; Tan and Yin Citation2017). For example, with the rapid increase of the chemical fertilizer industry, as well as a disconnection between pig farms and cereal production farms, pig production lost its ability to supply manure for crop production. More than 16 000 dead pigs were found floating in Shanghai Huangpu River in 2013, which caused severe public concern regarding sustainable pig production (van Cutsem and Grothey Citation2013). Meanwhile, the first national pollution source survey in 2010 highlighted that livestock production was the largest contributor to the loss of N and P to watercourses (Ministry of Environmental Protection and Ministry of Agriculture Citation2010).
In addition, diverse and abundant antibiotic resistance genes have been detected in pig farms due to the overuse of antibiotics (Zhu et al. Citation2013) and heavy metal accumulation has been found in the soil of orchards and greenhouses caused by the over-application of pig manure and overfeeding of metals to pigs (Tan and Yin Citation2017; Feng et al. Citation2018). Due to these environmental pollution problems, the central and local governments started to develop guidelines and standards for pig production and to address the direct discharge of effluent from pig farms during this period. However, there were no forced national environmental regulations, and thus pig production was not influenced by environmental regulations at this time.
Period III – development under strict environmental regulations
During Period III, there were no new direct supporting policies, with the old supporting policies still in operation. However, with increasing public concerns regarding environmental pollution, the central government initiated several regulations to control the creation of pollution from livestock production, especially pig production. These included the first pollution control regulations regarding industrial livestock production in 2014, the Action Plan for Prevention and Control of Water Pollution in 2015 (SCC Citation2015), and the Action Plan for Recycling of Resources from Livestock Production in 2017 (MOARA Citation2017). These actions have strongly influenced pig production, with total pig production decreasing by approximately 7.0% between 2014 and 2017. According to the Water Pollution Prevention Act, all provinces should design non-livestock production regions (NLPRs), i.e. those that are close to vulnerable water bodies, natural scenic places, and human residential areas (SCC Citation2015). Thus, many pig farms have been shut down or moved out of the NLPRs, resulting in a reduction of the production of 4.6 million pigs (NBSC Citation2018).
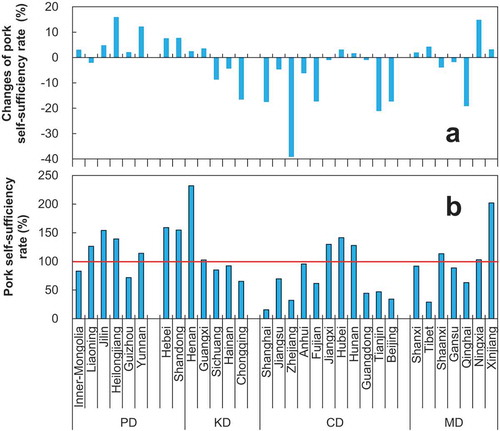
Pig production has been facing ever-tightening environmental regulations during Period III when compared with Periods I and II. However, the implementation of livestock pollution prevention policies varies between regions, with rich provinces usually implementing stricter regulations. For example, Chongqing, Shanghai, Fujian, Beijing, Tianjin, and Zhejiang provinces decreased their pig production capacities by 10%–30% between 2014 and 2017 to meet the requirements of the newly initiated water pollution prevention action, thus placing their pork supply security in danger (). However, provinces such as Henan, Jiangxi, and Guangxi decreased pig production capacities by only 1.4% ().
Figure 3. Changes in pork production and consumption self-sufficiency between 2014 and 2017 (a), and pork self-sufficiency in 2017 (b).
Red line represents the 100% self-sufficiency of pork consumption.The average consumption of pork per capita in 2014 and 2017 was derived from the Chinese Statistic Yearbook, and calibrated with non-household consumption and losses during processing, delivering and consumption chain (Ma et al., 2019). The average gross domestic production (GDP) value per capita of the different province and county level was derived from Chinese Statistic Yearbook and Chinese County level Socio-economic Statistic Year book (National Bureau of Statistics of China (NBSC) Citation2018).
Environmental Kuznets curve of pig production
We did not find a typical inverted “U” shaped curve between income and pig production density across the global leading pig producing countries from 1961 to 2016. However, we did identify that pig production density increased quickly with increasing income level to a (turning) point, then decreased with increasing levels of income in the Netherlands, or was maintained at a plateau in Denmark, Belgium, and Japan ()). Therefore, there is a Kuznets relationship for major pig producing countries worldwide, and the turning point varies from USD 15 to 35 000 per capita when pig production density is greater than 5.0 head per hectare arable land in these countries. This occurred in the 1990s in the Netherlands and Denmark, when their entire territory was designated as a nitrate vulnerable zone under the EU Nitrates Directive. Several policies were implemented, including the production right of pigs and poultry, to comply with strong environmental protection requirements and environmental risks (Oenema Citation2004). However, this turning point may also have been influenced by the massive outbreak of foot–mouth infectious diseases throughout the Netherlands in 1991, which damaged pig production afterwards (Wensvoort et al. Citation1991).
Figure 4. The relationship between average income level and pig production density (a, b, c) and pork production–consumption self-sufficiency (d, e, f) in world-leading pig production countries from 1961 to 2016.
Pig production intensity is expressed as the arable land base.The different countries are divided into three groups depending on pig production intensity and GDP level.
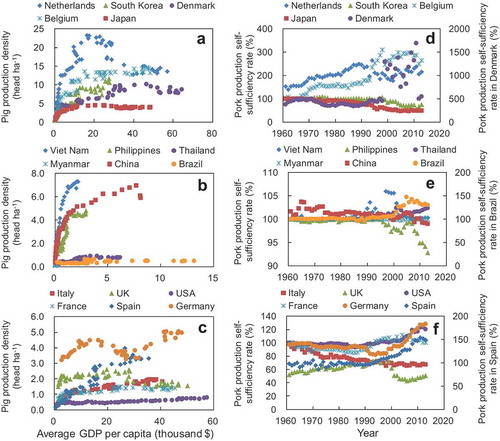
There were no turning points of the EKC for pig production in Italy, Canada, and the USA, even when the income level reached USD 20–33 000 per capita due to lower environmental losses risk from lower pig production density ()). The lower pig production densities and tradition of mixed crop-livestock farming in these countries indicates the small contribution that pig production contributed to nutrient losses, as the recommended livestock per hectare, 0.5 livestock unit ha−1, which is equivalent to approximately 1.6 head of pigs per hectare (Liu et al. Citation2017) was not exceeded. Hence, there are no strong policies to control for total pig production numbers in these regions. South Korea was typically on the left side of the Kuznets “U” shaped curve because the increasing rate of pig production density decreased greatly once the average GDP level reached USD 15 000 per year, and the pig production density reached a similar level as that of the plateau level that was seen in Belgium and Denmark ()).
Similarly, there was no EKC relationship found for Brazil, Myanmar, and Thailand, where both pig production density and income level were lower than that of the threshold level ()). Countries such as China and Vietnam, where the pig production density was larger than 5.0 head of pigs per hectare, were still in the left side of the Kuznets “U” curve due to its lower GDP level. Although there was a decreasing trend in China’s pig density when the average GDP was only USD 10 000 per capita, China has not yet reached the EKC turning point ()). The pig production in China may further increase by 50% between 2010 and 2050 as projected by Bai et al. (Citation2018). To compensate for the continued demand for pig products, new pig farms must be constructed in China, which may lead to pollution swapping and will increase the current uneven distribution of pig production.
The influence of social economics on the evenness of pig production systems
To further understand how pig production was distributed with the main socio-economic indicators, we compared the Gini coefficients between different countries. The lower the Gini coefficient, the greater the evenness of the distribution. The pig production distribution was more correlated with the human population and GDP between different regions in both China and Denmark than in the other countries. Therefore, pig production is more prone to be located near the markets in both these countries. Pig production was unevenly distributed within China both in terms of maize production (Gini coefficient = 0.62) and arable land availability (Gini coefficient = 0.40) in 2016, because the Gini index was larger or similar to 0.40 (). Maize is the major feed ingredient for pigs in China, most of which is produced domestically (Bai et al. Citation2014). This indicates pig production has become decoupled from its feed production area and manure recycling at the regional level. Indeed, pig production in southern China is heavily reliant on the importing of maize produced in northern China.
Figure 5. The uneven distribution of pig production with maize production (a), arable land (b), gross domestic production (GDP) value (c), and human population (d) in China (CN), the Netherlands (NL), Denmark (DK), the United Kingdom (UK), and the United States of America (US). Values in brackets represent the unevenness value.
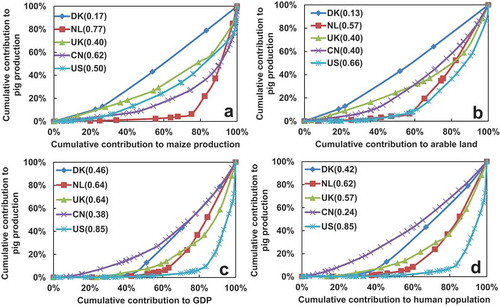
The evenness distribution of pig production in China was better than that in the Netherlands and the USA. Pig production was neither distributed close to maize production (Gini coefficient = 0.77) nor arable land (Gini coefficient = 0.57) in the Netherlands (). Pig production in the Netherlands relied on imported cereals and most of the domestically produced maize was fed to cattle as silage maize (Willems et al. Citation2016). Most pig production in the Netherlands was concentrated in the eastern and southern sandy regions, close to the port of Rotterdam, which benefitted from easy access and lower costs of imported feed (Willems et al. Citation2016). However, pig production was evenly distributed with maize production (Gini coefficient = 0.17) and arable land (Gini coefficient = 0.13) in Denmark (). Pig production was more widely distributed between different regions, although Jutland was the most important region. Most Danish pig farms are mixed pig-crop farms, which produce a large proportion of their required feed, such as maize. In Denmark, the maximum amount of pig manure that may be applied to land is 140 kg N ha−1, and the land must be owned, operated, or guaranteed by manure contracts before 2010. This has resulted in good coupling between pig production and arable land in Denmark (Willems et al. Citation2016).
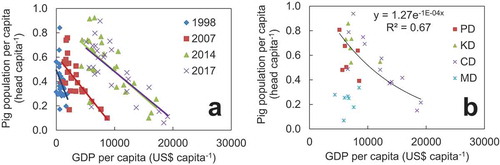
In the past, the unevenness of pig production has increased as shown in ), with pig production expanding rapidly in poor regions compared to rich regions between 1998 and 2017. Meanwhile, the NLPRs policy has further increased the uneven distribution of pig production between 2014 and 2017; in particular, the government would like to relocate pig production to the relatively poor potential development regions (PD) in China ()). This may help to improve the uneven distribution of pig production with GDP in China.
Figure 6. Relationships between average income per capita and pig production per capita in different years; means of provinces in China (a), and the relationship between average income per capita and pig production per capita in pig production regions in 2017 (b) .
The provinces Shanxi, Tibet, Qinghai, Ningxia, Gansu, and Xinjiang were excluded from because these provinces are dominated by either Muslim or Buddhist populations who do not consume pork.Key develop region (KD) includes Hebei, Shandong, Henan, Sichuan, Chongqing, Guangxi, and Hainan. Potential development region (PD) includes Inner-Mongolia, Liaoning, Jilin, Heilongjiang, Yunnan, and Guizhou. Constraint develop region (CD) includes Beijing, Tianjin, Shanghai, Zhejiang, Jiangsu, Anhui, Guangdong, Hubei, Hunan, and Jiangxi. Moderate develop region (MD) includes Shanxi, Shaanxi, Ningxia, Gansu, Qinghai, Xinjiang, and Tibet. For more information see http://jiuban.moa.gov.cn/zwllm/ghjh/201604/t20160420_5101912.htm.
Implications for policies and technology innovation
Different countries have implemented different strategies when faced with high pig production densities (due to improved levels of income) and increasing environmental concerns. For example, South Korea, Japan, the UK, and Italy have chosen to import pig meat to meet domestic demand, alleviating some of the domestic concerns regarding the negative environmental impacts of pig production; currently, these countries are self-sufficient in pig meat production of approximately 40%–70% (). In contrast, the Netherlands and Denmark have strictly regulated pig production and manure management, as they are major pig meat exporters and economically benefit from pig production. Currently, the self-sufficiency of pork is 200%–500% in these two countries ()). Due to the high pig and livestock production intensity and strong environmental regulations implemented via the Nitrates Directives, the Dutch government established the total pig production right and has promoted the processing and export of manure outside of the country border. Each year, approximately 25% of manure P needs to be processed and exported, mainly to Germany (Willems et al. Citation2016). However, the Danish government has focused more on setting the maximum pig production intensity at the regional level, which is currently 1.4 head per hectare, to match pig production with feed and land supply (Willems et al. Citation2016).
China’s pig production has not reached its EKC turning point yet, because the predicted demand for pork products will increase by 50% between 2010 and 2050 (Bai et al. Citation2018). By that time, the average pig density could reach approximately 15 head per hectare, far exceeding the manure loading capacity. However, we expect the EKC turning point will be reached earlier than the global threshold level, especially in China where the environmental regulation has been greatly reinforced since 2014. This fits the theory that poor countries adopt high-level environmental protection standards over a short time (Dasgupta et al. Citation2002; Stern Citation2004). Although the central government of China has implemented several policies to regulate pig production, these policies are not currently strong enough to turn pig production in the right direction. It is difficult for China, as such a big pig production–consumption country, to rely solely on imports to reduce the domestic pig production intensity, as Japan and South Korea have done in the past. It is also difficult to export manure to other countries because it is costly and the neighbouring countries may not be willing to take this manure.
Therefore, the current pig production sector in China must change significantly, given its uneven distribution between regions and its high pig production intensity. China should start to adopt good spatial planning of pig production based on the availability of feed resources and arable land. However, additional cautions are required when moving pigs to areas with high natural biodiversity to avoid pollution transfer. In line with spatial planning, the government must also limit the total pig production size at the national level, similar to the system of pig production in the Netherlands (Willems et al. Citation2016). This could avoid some of the environmental effects of extremely large pig farms, as they have serious challenges with the disposal and recycling of manure they have generated (Bai et al. Citation2014). Technology development and innovation throughout the manure management chain, such as manure treatment, transportation, and optimized application to maximize manure nutrient use efficiency, should be reinforced to promote the use of manure (Chadwick et al. Citation2015). Given the severe heavy metal and antibiotics problems of pig manure (Ji et al. Citation2012; Zhu et al. Citation2013), a manure-tracking system based on block-chain technology could also be constructed to avoid the transfer of potential pollutants. Finally, integrated research on feed, pig growth, and manure management are of high importance to remove these problems at the source (Deng et al. Citation2007; Yin and Tan Citation2010; Tan and Yin Citation2017).
Conclusions
China’s pig production has changed dramatically over the past decades, driven by the demand for livestock products and the implementation of government policies. These changes in pig production have resulted in great environmental challenges because of increased pig densities, decoupling from crop production, and uneven distributions between regions. This might prevent China from achieving SDGs for the entire country, given its huge size. There is a clear relationship between the average public income and pig production intensity (as indicated by the EKC) across the globally important pig producing countries, of which the EKC turning point is approximately USD 15–35 000 per capita when the pig production density is greater than 5.0 head per hectare of arable land. China has not yet reached the turning point; therefore, the government should strengthen its existing regulations and policies to reduce the environmental impacts of pig production and protect its natural resources. Co-ordinated policies are required to restructure the pig production sector, including the implementation of spatial planning of pig production to areas with high availability of feeds and agricultural land, establishing maximum pig production intensity at the farm level, and technology innovation in whole-chain manure management.
Disclosure statement
No potential conflict of interest was reported by the authors.
Additional information
Funding
References
- Bai Z, Ma L, Jin S, Ma W, Velthof GL, Oenema O, Liu L, Chadwick D, Zhang F. 2016. Nitrogen, phosphorus, and potassium flows through the manure management chain in China. Environ Sci Technol. 50(24):13409–13418.
- Bai Z, Ma W, Ma L, Velthof GL, Wei Z, Havlík P, Oenema O, Lee MR, Zhang F. 2018. China’s livestock transition: driving forces, impacts, and consequences. Sci Adv. 4(7):eaar8534.
- Bai ZH, Ma L, Qin W, Chen Q, Oenema O, Zhang FS. 2014. Changes in pig production in China and their effects on nitrogen and phosphorus use and losses. Environ Sci Technol. 48(21):12742–12749.
- Bourguignon F, Morrisson C. 2002. Inequality among world citizens: 1820–1992. Am Econ Rev. 92(4):727–744.
- Bouwman L, Goldewijk KK, van Der Hoek KW, Beusen AHW, Van Vuuren DP, Willems J, Rufino MC, Stehfest E. 2013. Exploring global changes in nitrogen and phosphorus cycles in agriculture induced by livestock production over the 1900–2050 period. Proc Natl Acad Sci. 110(52):20882–20887.
- Chadwick D, JiaWei WJ, TongYan’an YT, Guanghui Y, Qirong S, Qing C. 2015. Improving manure nutrient management towards sustainable agricultural intensification in China. Agric Ecosyst Environ. 209:34–46.
- Chen B, Yi BC, Cheng F. 2007. History of the development of swine industry through the twentieth century in China. J Xinyang Agric College. 17(1):115–118. (In Chinese).
- Chen HY. 2014. The evaluation and research on the support policy of China’s animal husbandry. Beijing: China Agricultural University. Doctorial. (In Chinese).
- Crist E, Mora C, Engelman R. 2017. The interaction of human population, food production, and biodiversity protection. Science. 356(6335):260–264.
- Dasgupta S, Laplante B, Wang H, Wheeler D. 2002. Confronting the environmental Kuznets curve. J Econ Perspect. 16(1):147–168.
- Deng D, Huang RL, Li TJ, Wu GY, Xie MY, Tang ZR, Kang P, Zhang YM, Fan MZ, Kong XF, et al. 2007. Nitrogen balance in barrows fed low-protein diets supplemented with essential amino acids. Livestock Sci. 109(1–3):220–223.
- European Commission. 2018. [accessed 2018 Dec]. http://ec.europa.eu/environment/water/water-nitrates/index_en.html.
- Feng Z, Zhu H, Deng Q, He Y, Li J, Yin J, Gao F, Huang R, Li T. 2018. Environmental pollution induced by heavy metal (loid) s from pig farming. Environ Earth Sci. 77(3):103.
- Food and Agriculture Organization (FAO). 2019. [accessed 2018 Dec]. http://www.fao.org/faostat/en/#home.
- Gerber PJ, Steinfeld H, Henderson B, Mottet A, Opio C, Dijkman J, Falcucci A, Tempio G. 2013. Tackling climate change through livestock: a global assessment of emissions and mitigation opportunities. Rome, Italy: Food and Agriculture Organization of the United Nations (FAO).
- Herrero M, Havlík P, Valin H, Notenbaert A, Rufino MC, Thornton PK, Blümmel M, Weiss F, Grace D, Obersteiner M. 2013. Biomass use, production, feed efficiencies, and greenhouse gas emissions from global livestock systems. Proc Natl Acad Sci. 110(52):20888–20893.
- Hou Y, Ma L, Gao ZL, Wang FH, Sims JT, Ma WQ, Zhang FS. 2013. The driving forces for nitrogen and phosphorus flows in the food chain of China, 1980 to 2010. J Environ Qual. 42(4):962–971.
- Ji X, Shen Q, Liu F, Ma J, Xu G, Wang Y, Wu M. 2012. Antibiotic resistance gene abundances associated with antibiotics and heavy metals in animal manures and agricultural soils adjacent to feedlots in Shanghai; China. J Hazard Mater. 235:178–185.
- Kuang YY, Ying RP. 2011. The change of farmer pig raising technology in China in recent thirty years. Chin Agric Sci Bull. 27(29):1–8. (In Chinese).
- Liu Q, Wang J, Bai Z, Ma L, Oenema O. 2017. Global animal production and nitrogen and phosphorus flows. Soil Res. 55(6):451–462.
- Mekonnen MM, Hoekstra AY. 2012. A global assessment of the water footprint of farm animal products. Ecosystems. 15(3):401–415.
- Ministry of Agriculture and Rural Affairs (MOARA). 2009. [accessed 2018 Dec]. http://www.moa.gov.cn/ztzl/xzgnylsn/gd_1/200910/t20091014_1365250.htm.
- Ministry of Agriculture and Rural Affairs (MOARA). 2017. [accessed 2018 Dec]. http://www.moa.gov.cn/govpublic/XMYS/201707/t20170710_5742847.htm.
- Ministry of Environmental Protection and Ministry of Agriculture. 2010. The first national pollution source census bulletin. [accessed 2018 Dec]. http://www.stats.gov.cn/tjsj/tjgb/qttjgb/qgqttjgb/201002/t20100211_30641.html.
- National Bureau of Statistics of China (NBSC). 2018. Chinese Statistics Yearbook. [accessed 2018 Dec]. http://www.stats.gov.cn/tjsj/ndsj/.
- Oenema O. 2004. Governmental policies and measures regulating nitrogen and phosphorus from animal manure in European agriculture. J Anim Sci. 82(suppl_13):E196–E206.
- Robinson TP, Wint GW, Conchedda G, Van Boeckel TP, Ercoli V, Palamara E, Cinardi G, D’Aietti L, Hay SI, Gilbert M. 2014. Mapping the global distribution of livestock. PLoS One. 9(5):e96084.
- Sadras V, Bongiovanni R. 2004. Use of Lorenz curves and Gini coefficients to assess yield inequality within paddocks. Field Crops Res. 90(2–3):303–310.
- Schneider M. 2011. Feeding China’s pigs: implications for the environment, China’s smallholder farmers and food security. [accessed 2018 Dec]. https://www.iatp.org/documents/feeding-china%E2%80%99s-pigs-implications-for-the-environment-china%E2%80%99s-smallholder-farmers-and-food.
- Seekell DA, D’Odorico P, Pace ML. 2011. Virtual water transfers unlikely to redress inequality in global water use. Environ Res Lett. 6(2):024017.
- Selden TM, Song D. 1994. Environmental quality and development: is there a Kuznets curve for air pollution emissions? J Environ Econ Manage. 27(2):147–162.
- Springmann M, Clark M, Mason-D’Croz D, Wiebe K, Bodirsky BL, Lassaletta L, de Vries W, Vermeulen SJ, Herrero M, Carlson KM, et al. 2018. Options for keeping the food system within environmental limits. Nature. 562(7728):519.
- State Council of China (SCC). 2015. [accessed 2018 Dec]. http://www.gov.cn/zhengce/content/2015-04/16/content_9613.htm.
- Stern DI. 2004. The rise and fall of the environmental Kuznets curve. World Dev. 32(8):1419–1439.
- Strokal M, Ma L, Bai Z, Luan S, Kroeze C, Oenema O, Velthof G, Zhang F. 2016. Alarming nutrient pollution of Chinese rivers as a result of agricultural transitions. Environ Res Lett. 11(2):024014.
- Tan B, Yin Y. 2017. Environmental sustainability analysis and nutritional strategies of animal production in China. Annu Rev Anim Biosci. 5:171–184.
- Tilman D, Balzer C, Hill J, Befort BL. 2011. Global food demand and the sustainable intensification of agriculture. Proc Natl Acad Sci. 108(50):20260–20264.
- Tilman D, Clark M. 2014. Global diets link environmental sustainability and human health. Nature. 515(7528):518.
- Torras M, Boyce JK. 1998. Income, inequality, and pollution: a reassessment of the environmental Kuznets curve. Ecol Econ. 25(2):147–160.
- van Cutsem E, Grothey A. 2013. Dead pigs scandal questions China’s public health policy. Lancet. 381:303–312.
- van Zanten HH, Herrero M, Hal OV, Röös E, Muller A, Garnett T, Gerber PJ, Schader C, De Boer IJ. 2018. Defining a land boundary for sustainable livestock consumption. Glob Chang Biol. 24(9):4185–4194.
- Wang F, Dou Z, Ma L, Ma W, Sims JT, Zhang F. 2010. Nitrogen mass flow in China’s animal production system and environmental implications. J Environ Qual. 39(5):1537–1544.
- Wang M, Ma L, Strokal M, Ma W, Liu X, Kroeze C. 2018. Hotspots for nitrogen and phosphorus losses from food production in China: a county-scale analysis. Environ Sci Technol. 52(10):5782–5791.
- Wensvoort G, Terpstra C, Pol JMA, Ter Laak EA, Bloemraad M, De Kluyver EP, Kragten C, Van Buiten LD, Den Besten A, Wagenaar F, et al. 1991. Mystery swine disease in The Netherlands: the isolation of Lelystad virus. Vet Q. 13(3):121–130.
- Willems J, van Grinsven HJ, Jacobsen BH, Jensen T, Dalgaard T, Westhoek H, Kristensen IS. 2016. Why Danish pig farms have far more land and pigs than Dutch farms? Implications for feed supply, manure recycling and production costs. Agric Syst. 144:122–132.
- World Bank. 2018. [accessed 2018 Dec]. http://www.worldbank.org/.
- Yin Y, Tan BE. 2010. Manipulation of dietary nitrogen, amino acids and phosphorus to reduce environmental impact of swine production and enhance animal health. J Food Agric Environ. 8(3–4):447–462.
- Zhang X, Davidson EA, Mauzerall DL, Searchinger TD, Dumas P, Shen Y. 2015. Managing nitrogen for sustainable development. Nature. 528(7580):5151–5159.
- Zhu YG, Johnson TA, Su JQ, Qiao M, Guo GX, Stedtfeld RD, Hashsham SA, Tiedje JM. 2013. Diverse and abundant antibiotic resistance genes in Chinese swine farms. Proc Natl Acad Sci. 110(9):3435–3440.