
 ?Mathematical formulae have been encoded as MathML and are displayed in this HTML version using MathJax in order to improve their display. Uncheck the box to turn MathJax off. This feature requires Javascript. Click on a formula to zoom.
ABSTRACT
Remotely sensed rainfall plays an important role in providing efficient approaches for global or regional rainfall analysis. However, the accuracy of satellite-based products is mainly affected by the errors in sensor observation and retrieval algorithms, particularly with respect to extreme rainfall estimates. The objective of this study is to evaluate the accuracy of satellite-based products in capturing rainfall extremes. The eastern coastal areas of China were chosen as the case study area to compare the accuracy of three mainstream satellite-based products with respect to extreme rainfall estimates during 2003–2015 period. This included the Tropical Rainfall Measurement Mission (TRMM) rainfall product 3B42V7, the Climate Prediction Centre Morphing technique RAW (CMORPH-RAW), and the CMORPH bias-corrected product (CMORPH-CRT). In general, all satellite-based products demonstrated numerous errors in extreme rainfall estimates. Based on three different indices of extreme rainfall, it was observed that the satellite-based products underestimated the amounts of rainfall extremes and their respective average values. It was noted that CMORPH-RAW demonstrated the largest relative bias (RB) and underestimated the average extreme rainfall by −31% to −35%. Additionally, all satellite-based products exhibited poor capabilities in capturing the variations in hourly extreme rainfall processes. Finally, a simple potential flood index was developed to simulate the potential flood areas in the eastern coastal areas of China. We found that the potential flood areas can be simulated by combining the potential flood index with the amounts of rainfall derived by satellite-based products.
1. Introduction
Improving the accuracy of retrievals in the amount and frequency of extreme events in response to climate change, especially in extreme rainfall, is key to anticipation strategies (Sillmann and Roeckner Citation2008; Gebregiorgis and Hossain Citation2013; Agarwal et al. Citation2014). However, obtaining an accurate reference of rainfall extremes among different dataset types (gauge observations versus satellite-based estimations) and their specific spatial and temporal resolutions is still a challenge (Sun and Barros Citation2010; Stisen and Tumbo Citation2015). At regional scales, which are relevant for extreme rainfall studies, ground observation requires long-period time series with high spatio-temporal resolution (Liang and Ding Citation2017). Usually, ground rain gauges provide direct-point estimations. However, measuring the rainfall globally is difficult due to its sparse distribution. As rainfall varies significantly with respect to space and time, gridded rainfall products with spatial continuity are well suited for such measurements (Sorooshian et al. Citation2011; Vu et al. Citation2017).
Currently, various satellite-based products are available at global scale, namely the 1°/daily Global Precipitation Climatology Project one-Degree-Daily (GPCP-1DD) (Huffman et al. Citation1997), the 0.25°/daily Precipitation Estimation from Remotely Sensed Information using Artificial Neural Networks Climate Data Record (PERSIANN-CDR) (Ashouri et al. Citation2014), the 0.25°/3-hourly Tropical Rainfall Measurement Mission (TRMM) Multi-Satellite Precipitation Analysis (TMPA) 3B42V7 (Kummerow et al. Citation1998), and the 0.25°/3-hourly Climate Prediction Centre Morphing (CMORPH) technique (Joyce and Janowiak Citation2004). As alternative and cost-efficient data sources, these products demonstrate significant potential applications in climate change (Jenkins et al. Citation2002; Stanfield et al. Citation2015) as well as rainfall-induced hazardous events warning (Hong et al. Citation2007; Li et al. Citation2009; Casse et al. Citation2015) with their quasi-global coverage and real-time availability. For instance, the seasonal rainfall in a changing climate area over the Arabian Peninsula is described by Almazroui et al. (Citation2012) based on TRMM 3B42 and other gridded datasets. The utility of CMORPH data has been demonstrated via an examination of the diurnal cycle in rainfall both globally and regionally by Janowiak et al. (Citation2005). In addition, satellite-based products have been used to address the variations of rainfall extremes in climate variability studies (Jamandre and Narisma Citation2013; Nastos et al. Citation2013).
However, the retrieval of rainfall extremes from satellite-based products also presents certain uncertainties with respect to accuracy (Huang et al. Citation2014; Mehran and AghaKouchak Citation2014; Tang et al. Citation2016), which is attributed to factors, such as instrument issues and retrieval algorithms (Sohn et al. Citation2010; Han et al. Citation2011; Li et al. Citation2013; Khan et al. Citation2014; Dembélé and Zwart Citation2016). Some efforts have been made to assess the reliability of these satellite-based products in capturing extreme rainfall worldwide (Hermance and Sulieman Citation2018). In China, Yong et al. (Citation2013) compared the accuracy of four standard TRMM TMPA products over Mishui and Laohahe basins and emphasized that all the products largely underestimated the rainfall during extreme typhoon events. Huang et al. (Citation2018) evaluated the performance of 3B42 real-time (3B42RT) and 3B42V7 products for an extreme rainfall event in Beijing and found that both the products significantly underestimated rainfall. In other countries, Aghakouchak et al. (Citation2011) pointed out that the satellite-based products might not be suitable for detecting extreme rainfall events as the retrieval process tended to miss a significant volume of extreme rainfall and could not capture extremes reliably. Anjum et al. (Citation2016) evaluated the 3B42RT and 3B42V7 products during an extreme rainfall event (on 28–30 July 2010) over the Swat river basin and its adjacent areas in the Hindukush region and concluded that both of these satellite-based products could not capture the spatial pattern of rainfall appropriately. Moreover, they underestimated the storm-accumulated rainfall by 32%-66%. In addition, these two satellite-based products did not capture any extreme rainfall events in Singapore between December 2014-March 2015 (Tan and Duan Citation2017).
Rainfall has large spatial variability across different regions (Milewski et al. Citation2015). The objective of this study is to evaluate the accuracy of satellite-based products in capturing rainfall extremes over urban areas. Previous studies have proven that extreme rainfall intensity (Song et al. Citation2015) and frequency (Chen et al. Citation2017) are more likely to increase in the metropolitan areas in China, especially in the eastern coastal areas of China, which have been experiencing rapid urbanization are becoming one of the most significant global metropolitan areas. Yin et al. (Citation2018) quantitatively simulated the flood risk in the eastern coastal areas of China based on the Coupled Model Inter-comparison Project Phase 5 global climate models. They found that the intensity of future flood risk will gradually increase. Some researchers have also pointed that urbanization in these areas has led to a rise in the magnitude of extreme rainfall intensity and potential risks of flash floods (Li et al. Citation2013; Han et al. Citation2015; Zhong et al. Citation2017). Although several rain gauges are distributed in these urban areas, gridded rainfall data derived by point-scale rain gauges still encounter problems in underestimating extreme rainfall due to the integrated methods (Li et al. Citation2019). Therefore, it is important to evaluate the accuracy and deduce the reliability of satellite-based products in urban areas.
In this study, we considered the eastern coastal areas of China as the case study area and attempted to compare the accuracy of three mainstream satellite-based products for extreme estimates, that is 3B42V7, CMORPH-RAW, and CMORPH-CRT. The rest of the contents of this paper are organized as follows: section 2 provides a brief description related to gauge data and the three satellite-based products. Different indices of extreme rainfall and evaluation methods are also described in section 2. Section 3 presents the results from the comparisons of the satellite-based products for extreme rainfall estimates. Finally, discussion and conclusions are presented in sections 4 and 5, respectively.
2. Materials and methods
2.1. Study area
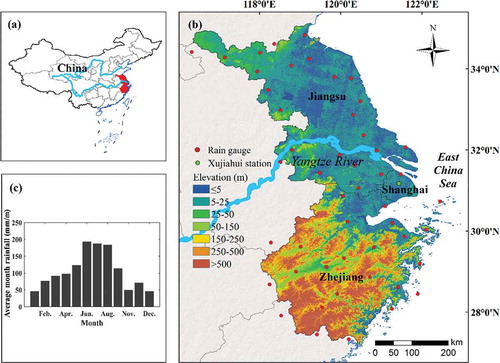
The study area includes one city (Shanghai) and two provinces (Jiangsu and Zhejiang) enclosing approximately 217,681 km2 within 27°25′ N-35°05′ N and 116°30′ E-122°50′ E (). The northern part of the eastern coastal areas of China mainly is comprised of an alluvial plain with flat topography, while the south includes low mountains and hills. This area experiences a humid subtropical climate with four distinct seasons. Its average summer rainfall (1 June-31 August) accounts for more than 30% of the average annual rainfall ().
Figure 1. (a) Location of the study area, (b) the distributions of rain gauges, and (c) the average monthly rainfall over the eastern coastal areas of China from 2003 to 2015.
2.2. Datasets
2.2.1 Rain gauge data
The daily rain gauge observations from 1 January 2003 to 31 December 2015 are obtained from the Chinese National Meteorological Information Center (CNMIC) (http://data.cma.cn/). ) shows the spatial locations of the selected 49 rain gauges. The inverse distance weighted (IDW) method is used to interpolate the gridded rainfall data (GRD) with 0.25° spatial resolution. This method demonstrates a higher reliability compared to ordinary kriging and co-kriging techniques (see ).
Table 1. Results of cross validation.
The GRD is regarded as the “ground truth” to evaluate the accuracy of the three satellite-based products.
The hourly rainfall data recorded by the Xujiahui station in Shanghai in 2015 and provided by the Shanghai Meteorological Bureau are also considered for evaluating the accuracy of satellite-based products in hourly extreme rainfall estimates.
2.2.2 Satellite-based products
Three different satellite-based products are used in this study, including 3B42V7, CMORPH-RAW, and CMORPH-CRT (see ) for their high spatio-temporal resolutions and long length of data acquisition.
Table 2. The basic information on the three satellite-based products.
3B42V7 is a rain gauge-adjusted multi-satellite rainfall product developed by the National Aeronautics and Space Administration and the National Space Development Agency (ftp://trmmopen.gsfc.nasa.gov/pub/merged). This product combines multiple independent rainfall estimates, such as the active/passive microwave fields, infrared (IR)-based estimates, and the monthly Global Precipitation Climatology Centre (GPCC) rain gauge analysis (Kummerow et al. Citation1998).
CMORPH is generated by the Climate Prediction Center (CPC) that functions under the National Centers for Environmental Prediction (ftp://ftp.cpc.ncep.noaa.gov/precip/global_CMORPH/3-hourly_025deg). It is derived from the IR imagery to propagate the rainfall estimates obtained from the passive microwave data (Joyce and Janowiak Citation2004). CMORPH-RAW performs real-time satellite observation without gauge calibration, while CMORPH-CRT adopts the probability density function techniques to reduce the bias by using the CPC unified daily gauge analysis.
In this study, daily accumulated rainfall values are calculated using the 3-hourly rainfall data. Additionally, to match the period of rain gauge data, 13 years (2003–2015) of historical data are selected in this experiment, which can meet the need for accuracy evaluation.
2.3. Methods
In this study, rainy days are defined as those days when the daily rainfall of GRD is higher than 0.1 mm/day. In daily scale, we considered three indices to indicate extreme rainfall events: (1) daily rainfall exceeding 50 mm/day (H50p); or (2) daily rainfall exceeding 95th percentile of rainy days (R95p); or (3) daily rainfall exceeding 99th percentile of rainy days (R99p). According to the three indices, the daily extreme rainfall events from time series GRD were extracted for evaluating the accuracy of the satellite-based products. In an hourly scale, extreme rainfall can be realized based on the definition that a rainfall event lasts over 24 h, during which the hourly rainfall exceeds 16 mm (Kong et al. Citation2017).
We considered four statistical indicators, including root mean square error (RMSE), mean absolute error (MAE), relative bias (RB), and correlation coefficient (CC) to quantitatively evaluate the satellite-based products during the period from 2003–2015. The equations of these indicators are described in , wherein RMSE indicates the average magnitude of error, MAE measures the average magnitude of absolute error, RB is used to represent the systematic bias (i.e. overestimation, RB > 0 or underestimation, RB < 0) of the satellite-based products, and CC is the correlation between the satellite-based products and GRD.
Table 3. The statistical indicators for evaluating the satellite-based products.
3. Results
3.1. General evaluation of satellite-based products for extreme rainfall estimates
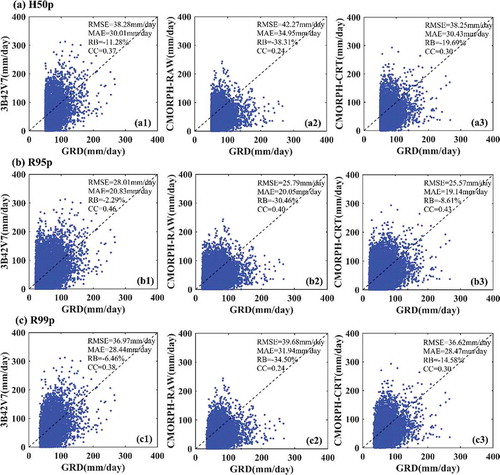
shows the scatter plots of extreme rainfall events between GRD and 3B42V7 (CMORPH-RAW or CMORPH-CRT) based on the three indices. Among the three satellite-based products, the near-real-time product CMORPH-RAW exhibits the worst performance in capturing the extreme rainfall amounts with the highest error magnitude as well as a lack of agreement with GRD. All satellite-based products demonstrate obvious underestimations of extreme rainfall estimates. 3B42V7 demonstrates the lowest biases, while its H50p still exceeds −10%.
Figure 2. The scatter plots of the extreme rainfall amounts of (a) H50p, (b) R95p, (c) R99p from GRD and (1) 3B42V7, (2) CMORPH-RAW, and (3) CMORPH-CRT during the period 2003–2015.
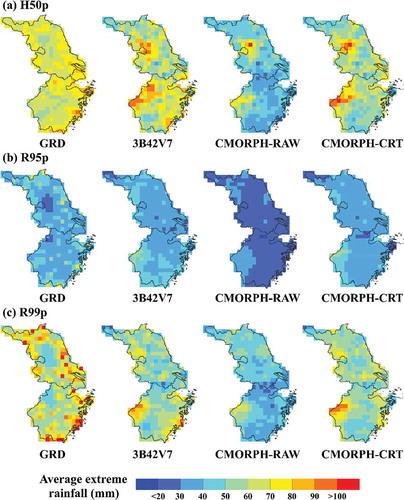
Further, we calculated the average extreme rainfall in each grid for spatial evaluation of satellite-based products during the period between 2003 and 2015. shows the spatial distribution of average extreme rainfall based on the three indices. Overall, all the satellite-based products underestimate average extreme rainfall in the coastal region. Previous studies have pointed out that the calibration system of satellite observations for discriminating rain from no rain performed poorly at the coastline by using passive microwave and infrared sensors (Kim et al. Citation2017). Additionally, the results of the statistical indicators are summarized in . 3B42V7 exhibits a better performance than CMORPH-RAW and CMORPH-CRT. Compared to GRD, the three satellite-based products demonstrate larger estimation errors in assessing the average extreme rainfall. With respect to the indicator RB, detection of average extreme rainfall is significantly underestimated by satellite-based products, especially the underestimation of the average extreme rainfall by −31 to −35% by CMORPH-RAW. Specifically, the index R99p shows that all the satellite-based products perform poorly in estimating the average extreme rainfall.
Table 4. The statistical results of satellite-based products for average extreme rainfall.
Figure 3. The spatial distributions of the average extreme rainfall of (a) H50p, (b) R95p, (c) R99p for GRD, 3B42V7, CMORPH-RAW, and CMORPH-CRT during the period 2003–2015.
3.2 Satellite-based products’ evaluation of hourly extreme rainfall
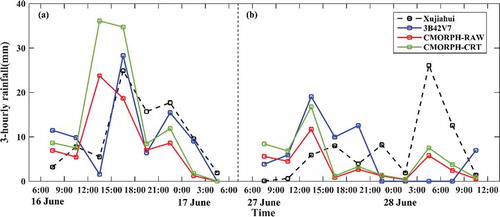
Two extreme events that are in line with the definition of hourly extreme rainfall mentioned in section 2.3 were recorded by Xujiahui station in 2015. These two events occurred on 16–17 June and 27–28 June. shows the 3-hourly amount of extreme rainfall obtained from ground observations and the three satellite-based products. The results indicate that all the satellite-based products occasionally demonstrate larger errors. In the first event ()), the 3-hourly maximum rainfall occurred on 16 June during 15:00–18:00. At this point, 3B42V7 exhibited a better performance compared to CMORPH-RAW and CMORPH-CRT. Additionally, CMORPH-RAW and CMORPH-CRT exhibited larger errors on 16 June during 12:00–15:00. However, 3B42V7 was the worst performer in terms of the second event (). Moreover, 3B42V7 exhibited obvious underestimation of extreme rainfall at times. It was observed that all the satellite-based products overestimated extreme rainfall on 27 June from 6:00 to 15:00.
Figure 4. Two extreme rainfall time series of the Xujiahui station in 2015 and satellite-based product observations. (a) 16–17 June, (b) 27–28 June.
4. Discussion
4.1. Analysis of the estimation errors in satellite-based products
From this study, it was found that the three satellite-based products (3B42V7, CMORPH-RAW, and CMORPH-CRT) present larger biases in terms of daily and hourly extreme rainfall estimates. Particularly, all the satellite-based products exhibit obvious underestimations of extreme rainfall during the evaluation of daily extreme rainfall. This conclusion is also consistent with previous studies (Mehran and AghaKouchak Citation2014; Jiang et al. Citation2018). The underestimation of extreme rainfall could be due to, such as errors in satellite sensors, retrieval algorithms, and spatial sampling frequencies as well as varied bias correction procedures related to uneven distribution of ground stations (Shen et al. Citation2010; Kenawy et al. Citation2015; Miao et al. Citation2015). Although some satellite-based products have been corrected using rain gauges, their capabilities of detecting extreme rainfall have not improved evidently (Jamandre and Narisma Citation2013; Stampoulis et al. Citation2013; Guo et al. Citation2016).
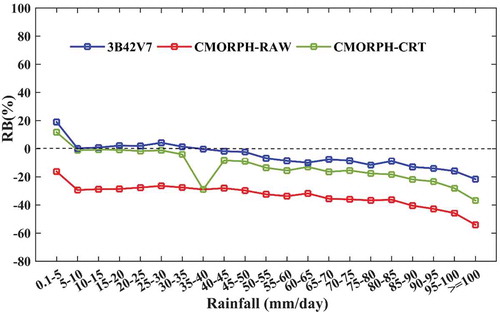
We calculated the relative biases of the three satellite-based products at different daily rainfall levels (see ). It was noted that the trends in biases from satellite-based products increased as rainfall increased. In other words, all satellite-based products exhibited an obvious underestimation with an increase in rainfall. Although 3B42V7 demonstrated lower biases than the others, its biases exceeded −10% when the daily rainfall was higher than 50 mm/day.
Figure 5. The RB of 3B42V7, CMORPH-RAW, and CMORPH-CRT in different daily rainfall levels.
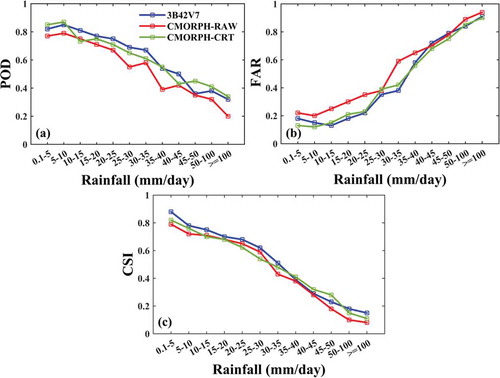
To further investigate the sources of bias, three continuous metrics, namely probability of detection (POD), false alarm ratio (FAR), and critical success index (CSI) were calculated to estimate the capability of satellite-based products in order to evaluate the possibility of corresponding rain events. All the metrics had values ranging from 0 to 1. Moreover, the POD and CSI (FAR) were positively (negatively) correlated with the detection capability. All these values were computed by referring to Jiang et al. (Citation2018). shows the detection results of three satellite-based products for different daily rainfall levels. With increasing thresholds, the detection capability of three satellite-based products showed a significant downward trend, whereas the ratio of false alarm tended to increase. The poor detection capability of satellite-based products in heavy rainfall events (≥25 mm/day) results in non-negligible estimation errors.
Figure 6. The overall detection capacity of the three satellite-based products in different daily rainfall thresholds.
4.2. Application potential analysis of satellite-based products in flood events
Climate change increases flood risk in China, especially in the eastern coastal areas of China, which suffer from potential threats that may be caused by tropical storms, typhoons, and flood hazards, leading to serious economic and human losses. Currently, only satellite-based products can provide space-continuous global rainfall data. The satellite-based products with open source are more attractive for hydrologist in flood simulation. In this study, we developed a simple potential flood index to simulate the potential flood areas in this region by integrating vegetation, topography, hydrology, and rainfall information. In addition, we attempted to compare the capabilities of the tested satellite-based products for potential flood area simulation.
The Potential flood index (PFI) can be calculated using equation (1).
where w represents the weights of different parameters, C is the coverage of vegetation, E is the elevation, SG is the slope gradient, D is the shortest Euclidean distance between the grid and the water body, and R is the amount of rainfall (mm).
The parameters used in the potential flood simulating model are listed in . The data sources include (1) Moderate resolution Imaging Spectroradiometer (MODIS) monthly products MOD13A3; (2) Multi-Error-Removed Improved-Terrain Digital Elevation Model (MERIT-DEM); (3) land use and land cover (LULC) map developed in 2005; and (4) GRD and satellite-based products. The MODIS data are used for calculating the Normalized Difference Vegetation Index (NDVI) as the coverage of vegetation. The topographical features (e.g. elevation and slope gradient) are derived from the MERIT-DEM. In addition, the water body layer is extracted from LULC map to calculate the shortest Euclidean distance between the grid and the water body.
Table 5. The parameters used in potential flood simulating model.
The values of the parameters in this table are normalized between 0 and 1, and all gridded data are resampled to 1 × 1 km spatial resolution using the bilinear method.
In this study, four typical rainfall- and cyclone-induced flood events are used for simulating the potential flood areas based on potential flood index. The flood events were obtained from the open website of Dartmouth Flood Observatory, University of Colorado (http://floodobservatory.colorado.edu/Archives/index.html). shows the details of the events that occurred in the eastern coastal areas of China during 2003–2005.
Table 6. Archive of large flood events in the eastern coastal areas of China during 2003–2005.
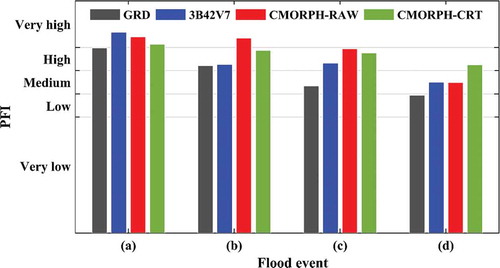
Based on equation (1), we calculated the potential flood index in each grid for different rainfall information sources, including GRD and satellite-based products. In addition, the potential flood indexes are classified into five categories: 1) very high (PFI values higher than 0.8); 2) high (PFI values ranging from 0.7 to 0.8); 3) medium (PFI values ranging from 0.6 to 0.7); 4) low (PFI values ranging between 0.5 and 0.6); and 5) very low (PFI values lower than 0.5). High values of the PFI correspond to the area with a high risk of floods. shows the four flood events that occurred in the southern part of the study area. In general, simulation results from all the satellite-based products are more consistent with those obtained from GRD with respect to most of the southern potential flood areas. However, the simulation results from the satellite-based products are overestimated compared to those from GRD (see and ). It is noted that the satellite-based products demonstrate an obvious overestimation in the northern part of the study area (non-potential flood area). 3B42V7 exhibits a better performance compared to CMORPH-RAW and CMORPH-CRT.
Figure 7. The spatial distributions of the flood centroids and potential flood index (PFI) values of GRD, 3B42V7, CMORPH-RAW, and CMORPH-CRT in four flood events. (a) 23–28 June 2003, (b) 12–15 August 2004, (c) 16–20 July 2005, (d) 1–4 September 2005.
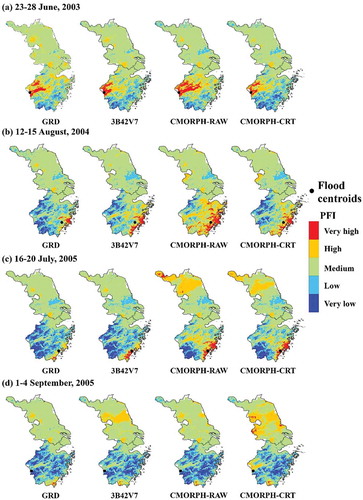
Figure 8. The PFI values of GRD, 3B42V7, CMORPH-RAW, and CMORPH-CRT at flood centroids in four flood events. (a) 23–28 June 2003, (b) 12–15 August 2004, (c) 16–20 July 2005, (d) 1–4 September 2005.
5. Conclusions
In this study, three satellite-based products (3B42V7, CMORPH-RAW, and CMORPH-CRT) were systematically evaluated in the eastern coastal areas of China for detecting the rainfall extremes during 2003–2015 period. The conclusions drawn from this work are summarized, as follows:
At daily scale, these three satellite-based products could capture the spatial distribution of average extreme rainfall; however, they demonstrated larger errors with respect to extreme rainfall estimates. The near-real-time product CMORPH-RAW exhibited the worst performance in capturing the extreme rainfall amounts.
In terms of the hourly extreme rainfall estimates, all the three satellite-based products exhibited poor performances in capturing the variations. Though 3B42V7 exhibited a better performance in the first event, compared to CMORPH-RAW and CMORPH-CRT, it demonstrated the worst performance in the second event. Moreover, it exhibited an obvious underestimation of extreme rainfall.
A novel potential flood index was developed to simulate the potential flood areas in the eastern coastal areas of China. These PFI values indicated that the simulated potential flood areas derived by the satellite-based products were more consistent with the results from GRD in potential flood areas.
In summary, we suggest that satellite-based products can provide a cost-effective data solution in scarce ground observatories. Although they may serve as an important additional data source to generate flood warnings, other issues, such as underestimation during the processes of extreme rainfall estimation, should be considered.
Correction Statement
This article has been republished with minor changes. These changes do not impact the academic content of the article.
Disclosure statement
No potential conflict of interest was reported by the authors.
Additional information
Funding
References
- Agarwal A, Babel MS, Maskey S. 2014. Analysis of future precipitation in the Koshi river basin, Nepal. J Hydrol. 513:422–434.
- Aghakouchak A, Behrangi A, Sorooshian S, Hsu K, Amitai E. 2011. Evaluation of satellite-retrieved extreme precipitation rates across the central United States. J Geophys Res Atmos. 116(D2):D02115.
- Almazroui M, Islam MN, Jones PD, Athar H, Rahman MA. 2012. Recent climate change in the Arabian Peninsula: seasonal rainfall and temperature climatology of Saudi Arabia for 1979–2009. Atmos Res. 111(32):29–45.
- Anjum MN, Ding YJ, Shangguan DH, Ijaz MW, Zhang SQ. 2016. Evaluation of high-resolution satellite-based real-time and post-real-time precipitation estimates during 2010 extreme flood event in Swat River Basin, Hindukush Region. Adv Meteorol. 2016:1–8.
- Ashouri H, Hsu KL, Sorooshian S, Braithwaite DK, Knapp KR, Cecil LD, Nelson BR, Prat OP. 2014. PERSIANN-CDR: daily precipitation climate data record from multisatellite observations for hydrological and climate studies. Bull Am Meteorol Soc. 96(1):197–210.
- Casse C, Gosset M, Peugeot C, Pedinotti V, Boone A, Tanimoun BA, Decharme B. 2015. Potential of satellite rainfall products to predict Niger River flood events in Niamey. Atmos Res. 163:162–176.
- Chen XH, Liu BJ, Chen G. 2017. Effects of urbanization on precipitation characteristics. J Nat Resour. 32(9):1591–1601. in Chinese.
- Dembélé M, Zwart SJ. 2016. Evaluation and comparison of satellite-based rainfall products in Burkina Faso, West Africa AU-Dembélé, Moctar. Int J Remote Sens. 37(17):3995–4014.
- Gebregiorgis AS, Hossain F. 2013. Understanding the Dependence of Satellite Rainfall Uncertainty on Topography and Climate for Hydrologic Model Simulation. IEEE Trans Geosci Remote Sens. 51(1):704–718.
- Guo H, Chen S, Bao AM, Behrangi A, Hong Y, Ndayisaba F, Hu JJ, Stepanian PM. 2016. Early assessment of Integrated Multi-satellite Retrievals for Global Precipitation Measurement over China. Atmos Res. 176-177:121–133.
- Han LF, Xu YP, Pan GB, Deng XJ, Hu CS, Xu HL, Shi HY. 2015. Changing properties of precipitation extremes in the urban areas, Yangtze River Delta, China, during 1957–2013. Nat Hazard. 79(1):437–454.
- Han WS, Burian SJ, Shepherd JM. 2011. Assessment of satellite-based rainfall estimates in urban areas in different geographic and climatic regions. Nat Hazard. 56(3):733–747.
- Hermance JF, Sulieman HM. 2018. Adequacy of the daily TMPA 3B42 high-resolution satellite precipitation product for monitoring hydrometeorological hazards in the Southeast Sahel of Africa. Int J Remote Sens. 39(8):2579–2596.
- Hong Y, Adler RF, Negri A, Huffman GJ. 2007. Flood and landslide applications of near real-time satellite rainfall products. Nat Hazard. 43(2):285–294.
- Huang XRZ, Wang DS, Liu Y, Feng ZZ, Wang DG. 2018. Evaluation of extreme precipitation based on satellite retrievals over China. Front Earth Sci. 12(4):846–861.
- Huang Y, Chen S, Cao Q, Hong Y, Wu BW, Huang MY, Qiao L, Zhang ZX, Li Z, Li WY, et al. 2014. Evaluation of Version-7 TRMM Multi-Satellite Precipitation Analysis Product during the Beijing Extreme Heavy Rainfall Event of 21 July 2012. Water. 6(1):32–44.
- Huffman GJ, Adler RF, Arkin P, Chang A, Ferraro R, Gruber A, Janowiak J, McNab A, Rudolf B, Schneider U. 1997. The Global Precipitation Climatology Project (GPCP) combined precipitation dataset. Bull Am Meteorol Soc. 78(1):5–20.
- Jamandre CA, Narisma GT. 2013. Spatio-temporal validation of satellite-based rainfall estimates in the Philippines. Atmos Res. 122(3):599–608.
- Janowiak JE, Kousky VE, Joyce RJ. 2005. Diurnal cycle of precipitation determined from the CMORPH high spatial and temporal resolution global precipitation analyses. J Geophys Res Atmos. 110(D23):D23105.
- Jenkins GS, Adamou G, Fongang S. 2002. The challenges of modeling climate variability and change in West Africa. Climate Change. 52(3):263–286.
- Jiang Q, Li WY, Wen JH, Qiu C, Sun WW, Fang QL, Xu M, Tan JG. 2018. Accuracy evaluation of two high-resolution satellite-based rainfall products: TRMM 3B42V7 and CMORPH in Shanghai. Water. 10(1):1–15.
- Joyce RJ, Janowiak JEAP. 2004. CMORPH: a method that produces global precipitation estimates from passive microwave and infrared data at high spatial and temporal resolution. J Hydrometeorol. 5(3):287–296.
- Kenawy AME, Lopez-Moreno JI, Mccabe MF, Vicente-Serrano SM. 2015. Evaluation of the TMPA-3B42 precipitation product using a high-density rain gauge network over complex terrain in northeastern Iberia. Global Planet Change. 133:188–200.
- Khan SI, Yang H, Gourley JJ, Khattak MUK, Yong B, Vergara HJ. 2014. Evaluation of three high-resolution satellite precipitation estimates: potential for monsoon monitoring over Pakistan. Adv Space Res. 54(4):670–684.
- Kim K, Park J, Baik J, Choi M. 2017. Evaluation of topographical and seasonal feature using GPM IMERG and TRMM 3B42 over Far-East Asia. Atmos Res. 187:95–105.
- Kong F, Shi PJ, Fang J, Lv LL, Fang JY, Guo JP. 2017. Advances and prospects of spatiotemporal pattern variation of extreme precipitation and its affecting factors under the background of global climate change. J Catastrophol. 32(2):165–174. in Chinese.
- Kummerow C, Barnes W, Kozu T, Shiue J, Simpson J. 1998. The Tropical Rainfall Measuring Mission (TRMM) sensor package. J Atmos Oceanic Technol. 15(3):809–817.
- Li L, Yang H, Wang J, Adler RF, Policelli FS, Habib S, Irwn D, Korme T, Okello L. 2009. Evaluation of the real-time TRMM-based multi-satellite precipitation analysis for an operational flood prediction system in Nzoia Basin, Lake Victoria, Africa. Nat Hazard. 50:109–123.
- Li WY, He XG, Sun WW, Scaioni M, Yao DJ, Fu J, Chen Y, Liu B, Gao J, Li X. 2019. Evaluating three satellite-based precipitation products of different spatial resolutions in Shanghai based on upscaling of rain gauge. Int J Remote Sens. 40(15):1–17.
- Li Z, Yang DW, Hong Y. 2013. Multi-scale evaluation of high-resolution multi-sensor blended global precipitation products over the Yangtze River. J Hydrol. 500(14):157–169.
- Liang P, Ding YH. 2017. The long-term variation of extreme heavy precipitation and its link to urbanization effects in Shanghai during 1916–2014. Adv Atmos Sci. 34(3):321–334.
- Mehran A, AghaKouchak A. 2014. Capabilities of satellite precipitation datasets to estimate heavy precipitation rates at different temporal accumulations. Hydrol Process. 28(4):2262–2270.
- Miao CY, Ashouri H, Hsu K, Sorooshian S, Duan QY. 2015. Evaluation of the PERSIANN-CDR Daily Rainfall Estimates in Capturing the Behavior of Extreme Precipitation Events over China. J Hydrometeorol. 16(3):1387–1396.
- Milewski A, Elkadirki R, Durham M. 2015. Assessment and Comparison of TMPA Satellite Precipitation Products in Varying Climatic and Topographic Regimes in Morocco. Remote Sens. 7:5697–5717.
- Nastos PT, Kapsomenakis J, Douvis KC. 2013. Analysis of precipitation extremes based on satellite and high-resolution gridded data set over Mediterranean basin. Atmos Res. 131:46–59.
- Shen Y, Xiong AY, Wang Y, Xie PP. 2010. Performance of high-resolution satellite precipitation products over China. J Geophys Res Atmos. 115(D2):D02114.
- Sillmann J, Roeckner E. 2008. Indices for extreme events in projections of anthropogenic climate change. Climate Change. 86(1–2):83–104.
- Sohn BJ, Han HJ, Seo EK. 2010. Validation of satellite-based high-resolution rainfall products over the Korean Peninsula using data from a dense rain gauge network. J Appl Meteorol Climatol. 49(2009):367–370.
- Song XM, Zhang JY, Aghakouchak A, Roy SS, Xuan YQ, Wang GQ, He RM, Wang XJ, Liu CS. 2015. Rapid urbanization and changes in spatiotemporal characteristics of precipitation in Beijing metropolitan area. J Geophys Res. 119(19):11250–11271.
- Sorooshian S, AghaKouchak A, Arkin P, Eylander J, Foufoula-Georgiou E, Harmon R, Hendrickx JMH, Imam B, Kuligowski R, Skahill B. 2011. Advanced concepts on remote sensing of precipitation at multiple scales. Bull Am Meteorol Soc. 92(10):1353–1357.
- Stampoulis D, Anagnostou EN, Nikolopoulos EI. 2013. Assessment of high-resolution satellite-based rainfall estimates over the mediterranean during heavy precipitation events. J Hydrometeorol. 14(5):1500–1514.
- Stanfield RE, Jiang JH, Dong X, Xi BK, Hui S, Donner L, Rotstayn L, Wu TW, Cole J, Shindo E. 2015. A quantitative assessment of precipitation associated with the ITCZ in the CMIP5 GCM simulations. Climate Dyn. 47(5–6):1863–1880.
- Stisen S, Tumbo M. 2015. Interpolation of daily rain gauge data for hydrological modelling in data sparse regions using pattern information from satellite data. Int Assoc Sci Hydrol Bull. 60(11):1911–1926.
- Sun XM, Barros AP. 2010. An evaluation of the statistics of rainfall extremes in rain gauge observations, and satellite-based and reanalysis products using universal multifractals. J Hydrometeorol. 5(12):1153–1162.
- Tan LM, Duan Z. 2017. Assessment of GPM and TRMM precipitation products over Singapore. Remote Sens. 9(7):1–16.
- Tang GQ, Ma YZ, Long D, Zhong LZ, Hong Y. 2016. Evaluation of GPM Day-1 IMERG and TMPA Version-7 legacy products over Mainland China at multiple spatiotemporal scales. J Hydrol. 533:152–167.
- Vu TM, Raghavan SV, Liong SY, Mishra AK. 2017. Uncertainties of gridded precipitation observations in characterizing spatio‐temporal drought and wetness over Vietnam. Int J Climatol. 38(4):2067–2081.
- Yin XD, Dong SY, Han ZY, Wang R. 2018. Projected risk of drought and flood at Yangtze River Delta for the next 50 years. J Meteorol Environ. 34(5):66–75. in Chinese.
- Yong B, Ren LL, Hong Y, Gourley JJ, Tian YD, Huffman GJ, Xi C, Wang WG, Wen YX. 2013. First evaluation of the climatological calibration algorithm in the real-time TMPA precipitation estimates over two basins at high and low latitudes. Water Resour Res. 49(5):2461–2472.
- Zhong S, Qian Y, Zhao C, Leung R, Liu DQ. 2017. Urbanization-induced urban heat island and aerosol effects on climate extremes in the Yangtze River Delta region of China. Atmos Chem Phy. 17(8):1–57.