
ABSTRACT
In 2019, New York State passed aggressive new climate legislation to reduce greenhouse gas (GHG) emissions and laid out major changes for how emissions are reported. One change is the inclusion of emissions from outside of the boundaries of the State if they are associated with energy use within NY; the traditional inventory considered emissions only within the State. The new legislation also mandated that methane emissions be compared with carbon dioxide over a 20-year time frame rather than the 100-year time frame previously used by NY and still used by virtually all other governments globally. This reflected the desire of NY's policymakers for a tool that evaluates emissions from the standpoint of energy consumption and that more heavily weighs the role of methane as an agent of warming over the next few decades. This paper compares emissions based on the new approach for GHG reporting with the traditional inventory. The traditional inventory is driven almost entirely by carbon dioxide emissions. As of 2015, these carbon dioxide emissions had declined by 15% since 1990 due to an 88% decrease in coal consumption and a 27% decrease in consumption of petroleum products, although consumption of natural gas had increased by 57%. Methane emissions increased by almost 30% between 1990 and 2015, largely due to the increased consumption of natural gas. According to the new GHG reporting rules, methane contributed 28% of all fossil-fuel emissions in 1990 and 37% in 2015. Total GHG emissions remained virtually unchanged from 1990 to 2015.
Introduction
In July of 2019, the State of New York enacted the Climate Leadership and Community Protection Act (CLCPA Citation2019). This broad-ranging law, which took effect January 2020, sets ambitious goals for statewide greenhouse gas (GHG) emission reductions of 40% by 2030 and 85% by 2050 compared to 1990 emissions. The CLCPA had been many years in the making, with versions passed by the New York Assembly as early as 2016. Political momentum for the act came from several drivers, including widespread damage in the New York City metropolitan area in 2012 from Superstorm Sandy that many attributed to climate change. Another factor was the agreement made in Paris in December 2015 by the United Nations Conference of the Parties 21st conference (COP21) to keep the temperature of the Earth well below 2° C compared to the pre-industrial baseline. A third important factor was the movement to ban shale-gas development from high-volume hydraulic fracturing in New York State. While shale-gas development in New York was banned in 2014 (Kaplan Citation2014), natural gas use in the State has risen steadily since then (EIA Citation2016a). Virtually all of the natural gas now used in New York is shale gas developed in other states such as Pennsylvania.
A growing body of literature has suggested that methane emissions can contribute significantly to the GHG footprint of natural gas, including shale gas (Howarth et al. Citation2011; Howarth Citation2014; Alvarez et al. Citation2018). Some evidence indicates that shale-gas development in North America may have contributed one-third of the total global increase in methane emissions from all sources over the past decade (Howarth Citation2019). Although carbon dioxide is widely recognized as the most important driver of climate change, methane too is a major greenhouse gas with a radiative forcing of approximately 1 W m−2 when indirect effects are included, 60% of the radiative forcing of 1.66 W m−2 for carbon dioxide (Myhre et al. Citation2013).
It is in this context that the CLCPA mandated some major changes in how the State of New York reports GHG emissions, to help frame policy choices from the perspective of energy consumption within the state. The largest change is to include GHG emissions that occur outside of the boundaries of New York State if they are associated with the use of energy within the State (CLCPA Citation2019). This is particularly important for methane emissions from natural gas, since a majority of the emissions occur at the site of gas production, processing, and storage (Alvarez et al. Citation2018), which for gas used in New York occurs outside of the State, particularly in the Marcellus shale area of Pennsylvania. Note that this is fundamentally different from the previous GHG inventory approach for New York, or for any other state or nation, where only emissions within the geographic boundaries of the state or nation under consideration are included. The goal of this change is to make sure that the citizens of New York State have a tool by which to judge their full climate footprint, acting locally but thinking globally to reduce emissions. To reduce the danger of double-counting emissions, care is needed to distinguish between these traditional inventories and the new CLCPA footprint approach, which is intended to help guide energy-use choices within New York State. An approach similar to the new CLCPA mandate was used earlier used in GHG reporting by Cornell University (Citation2016) and Tompkins County (Citation2016) in central New York State.
Another major change required under the CLCPA is to report methane emissions expressed in carbon-dioxide equivalents (CO2-eq) evaluated over a 20-year integrated time horizon. Previously New York State used a 100-year time frame for reporting methane emissions, as do the GHG inventories for virtually all other states and nations. All of these inventories use the global warming potential (GWP), which is the integrated radiative forcing of a pulsed emission of methane compared to the pulsed emission of an equal mass of carbon dioxide over a defined period of time. Because the effective residence time of methane in the atmosphere is far less than that of carbon dioxide, the GWP for methane decreases rapidly over time, particularly during the first 50 years after emission (see Figure 8.29 in Myhre et al. Citation2013). The choice of time frame for comparing methane and carbon dioxide is therefore quite important (IPCC Citation2013; Myhre et al. Citation2013). The GWP approach was proposed in the first report of the Intergovernmental Panel on Climate Change (IPCC) in 1990 as a simple way to communicate complex information to policy makers. IPCC (Citation1990) provided estimates for GWP at three time scales: 20, 100, and 500 years. The middle value of 100 years was chosen by those who authored the Kyoto Protocol, which was adopted by most governments in 1997. There was no clear reason articulated for using this value rather than 20 years or 500 years, and more recently the IPCC has stated the 100-year time period is arbitrary (IPCC Citation2013; Myhre et al. Citation2013). The 100-year time frame places less emphasis on methane than does a shorter time frame, since most of the warming from methane occurs within 30 years after emission. A GWP that uses a shorter time frame for methane, and separately reporting methane and carbon dioxide emissions, may be appropriate if the concern is with the rate of global warming over the next few decades (Howarth Citation2014). The political leaders in New York who passed the CLCPA were influenced by this logic in their choice of the 20-year time frame; note that the CLCPA mandates a 40% reduction in GHG emissions within 10 years and an 85% reduction within 30 years. I discuss arguments for and against this time choice further below in the “results and discussion” section.
In this paper, I estimate GHG emissions for the State of New York in 1990 and in 2015 using the new CLCPA guidelines, and compare these with emission estimates as previously reported in the State’s GHG inventory (NYSERDA Citation2018). I focus on energy systems and on emissions of carbon dioxide and methane, since these dominate overall GHG emissions in New York State. Note that emissions of other GHGs such as nitrous oxide and fluorocarbon are less than 4% of the total emissions from New York State (NYSERDA Citation2018, and discussion below).
Methodology
My analysis follows the approach outlined in the CLCPA which provides consumption-based GHG footprint estimates, and therefore differs from classic inventories. I use data on statewide annual energy consumption by type of fuel (EIA Citation2016a) and emissions per energy use by fuel type. Fuel types considered are coal, natural gas, and the sum of petroleum products, which includes gasoline, diesel, kerosene, jet fuel, propane and heating oil. Emission factors are based on a full lifecycle analysis regardless of where the emissions occur, as mandated by the CLCPA (Citation2019). These are presented below and summarized in .
Table 1. Emission factors for carbon dioxide and methane
Table 2. Greenhouse gas emissions for the State of New York from energy consumption and waste streams (Tg CO2-eq per year)
Emission factors for carbon dioxide for all fossil fuels are from the US Energy Information Administration (EIA Citation2016b). These are based on gross calorific values. Note that the IPCC and most nations use net calorific values, and these are what are reported by Hayhoe et al. (Citation2002) and used by Howarth et al. (Citation2011). Here, I use the gross calorific values to make them comparable to the energy use data from EIA (Citation2016b). For the estimate for petroleum products, I use the mean value from EIA (Citation2016b) for propane, home heating oil, kerosene, gasoline, residual heating oil, jet fuel, and aviation gasoline.
For methane emissions for coal, I use a factor of 0.185 g CH4 MJ−1 based on data for average methane emissions from the coal industry and total coal production in the United States in 1990 ( of IPCC Citation1996), assuming an energy content of 27 MJ kg−1 for coal (Howarth et al. Citation2011). This estimate is robust for 1990. It may not well represent methane emissions from coal in 2015, but by 2015, the use of coal in New York State was minimal ( EIA Citation2016b). For methane emissions from petroleum products, I use an emission factor of 0.093 g CH4 MJ−1 (NETL Citation2008; Howarth et al. Citation2011). This value is fine for 1990 but may underestimate emissions in 2015 due to increased petroleum production from shale oil (Howarth Citation2019).
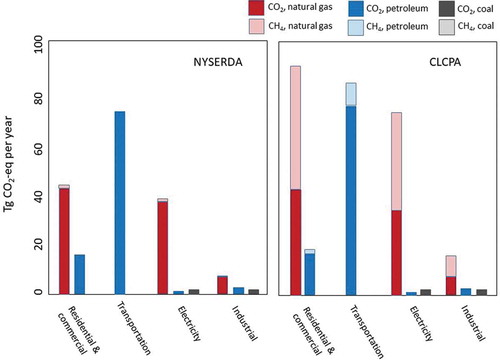
Figure 1. Greenhouse gas emissions by sector and fuel type for fossil fuel energy use in New York State for 2015. Estimates reported by the State are shown on the left (“NYSERDA”). Estimates calculated using the CLCPA guidelines and as developed in this paper are shown on the right (“CLCPA”). Direct emissions of carbon dioxide are illustrated in dark colours. Methane emissions reported as CO2-equivalents are shown in lighter colours. The NYSERDA estimates use a GWP of 25 for methane and include only emissions within New York State. The CLCPA estimates are based on a GWP of 86 for methane and include emissions from outside of the State that are associated with energy use within the State. Imported electricity is included in the electricity sector
For methane emissions from natural gas, I use an emission of 3.6% of the methane in natural gas that is consumed, based on full lifecycle analysis from production through delivery to final consumer. To derive the 3.6% emission factor, I sum an estimate of 14.1Tg CH4 yr−1 emissions from production, gathering, processing, transmission, and storage of natural gas in the United States (top-down estimate from Alvarez et al. Citation2018) and an estimate of 4.4 Tg CH4 yr−1 for downstream distribution emissions derived from the recent analysis of Plant et al. (Citation2019). The Alvarez et al. (Citation2018) estimate is for 2015 and is based on a compilation of many recent studies in several gas-producing regions in the United States; note that their top-down estimate used here is 11% greater than their bottom-up estimate. I use the top-down estimate since several studies have suggested bottom-up estimates underestimate total emissions (Miller et al. Citation2013; Howarth Citation2014; Vaughn et al. Citation2018). This may still be conservative, as Alvarez et al. (Citation2018) excluded from their top-down analysis some studies that showed very high fugitive emissions (i.e., Caulton et al. Citation2014; Schneising et al. Citation2014). Plant et al. (Citation2019) analysed downstream, distribution emissions from natural gas systems across the major metropolitan area of the northeastern United States, stretching from Boston to Washington, DC, concluding that emissions are 9.5 times greater than the gridded estimates from the US Environmental Protection Agency. Scaled to the entire United States, this yields an estimate for distribution emissions of 4.4 Tg CH4 yr−1. This estimate may or may not apply to the entire United States, but it well applies to New York State. I therefore conservatively estimate total, full-lifecycle methane emissions from natural gas in the United State to be 18.5 Tg per year in 2015, summing the upstream and midstream emissions derived from Alvarez et al. (Citation2018) with the downstream emission estimate derived from Plant et al. (Citation2019). Based on consumption of natural gas in the United States in 2015 (550 Tg yr−1, reported as 27.2 trillion cubic feet; EIA Citation2019), and assuming 93% of natural gas is methane (Schneising et al. Citation2014), 3.6% of natural gas consumption is emitted to the atmosphere. In a recent reanalysis of global trends in methane emissions based on changes in the 13 C content of methane in the atmosphere over time, I concluded that it is likely that at least 3.5% of new methane emissions from natural gas production over the past decade was emitted to the atmosphere (Howarth Citation2019). That estimate is equivalent to approximately 4% of emissions when scaled to consumption, but has a large degree of uncertainty. Nonetheless, the 3.6% emission factor relative to consumption used in this paper is highly conservative.
The CLCPA specifies that methane emissions for all fossil fuels are expressed as CO2-equivalents using a 20-year time frame. In this analysis, I use a GWP of 86, which includes indirect climate feedbacks (Myhre et al. Citation2013). Note that more recent literature suggests the use of an even higher GWP value (Etminan et al. Citation2016), so the estimates presented here should be viewed as conservative. GWP is not the only approach available for comparing methane and carbon dioxide emissions (Myhre et al. Citation2013). For example, Shine et al. (Citation2005) proposed the use of a Global Temperature Change Potential instead. The CLCPA is silent as to what method to use, beyond mandating the 20-year time frame. Here, I use the GWP approach because of its widespread application in GHG inventories (at the 100-year time frame) and in the literature on GHG footprints of natural gas (at both the 20-year and 100-year time periods; see Howarth et al. Citation2011).
Carbon dioxide emissions for imported electricity are as reported by New York State (NYSERDA Citation2018); methane emissions from imported electricity are estimated from the carbon-dioxide emissions, assuming that coal was the fossil fuel used to produce it in 1990 and natural gas in 2015 (as was largely the case for electricity produced within the State at those two times). For emissions from waste streams, including waste incineration, landfills, and municipal wastewater treatment plants, carbon dioxide values are as reported by the State (NYSERDA Citation2018). Note that the State reports no carbon dioxide emissions from agriculture. For methane emissions from waste sources as well as agriculture, I use the values as reported by the State (NYSERDA Citation2018) only corrected using the 20-year GWP value of 86 rather than the 100-year value of 25 used by NYSERDA (Citation2018).
For 2015, I also estimated emissions of both carbon dioxide and methane by economic sector: residential and commercial, transportation, electricity production, and industry. Values for emission by fuel type are apportioned to sectors using the portions for each fuel contributing to carbon dioxide emissions from Table S-4 in NYSERDA (Citation2018).
For carbon dioxide emissions in this paper, I only include direct emissions as a fuel is burned and not the indirect carbon dioxide emissions associated with developing and transporting the fuel outside of the boundaries of New York State. Note that these indirect emissions are part of the CLCPA mandate for GHG accounting, but to accurately estimate them is beyond the scope of this short report. In general, these indirect carbon dioxide emissions are relatively small compared to the direct emissions. For example, indirect emissions for shale gas use in the United States are only 6% of the direct carbon dioxide emissions (Howarth et al. Citation2011). In contrast, methane emissions from shale gas when expressed as carbon dioxide equivalents using a 20-year GWP are greater than the direct carbon dioxide emissions (Howarth et al. Citation2011; Howarth Citation2014). Nonetheless, a future improvement to the application of the CLCPA-approach used here should include indirect, full lifecycle carbon dioxide emissions.
Results and discussion
GHG emissions from coal, petroleum products, and natural gas for 1990 and 2015 estimated using the CLCPA approach are presented in , and estimates for emissions by fuel types and economic sector for 2015 are shown in . Also shown in are the estimates for GHG emissions by fuel type and economic sector as previously reported in the traditional inventory for the State of New York (NYSERDA Citation2018). The traditional inventory is dominated by carbon dioxide emissions, with very little contribution from methane (). The pattern of carbon dioxide emissions as determined using the CLCPA approach is very similar, but methane emissions are far more important in the CLCPA approach (). For 2015 using the CLCPA approach, carbon dioxide makes up 63% of total emissions from fossil fuels and methane 37% (), while in the estimates reported in the State’s traditional inventory, carbon dioxide was 98.5% of emissions and methane just 1.5% (NYSERDA Citation2018).
Total methane emissions from all energy use in 2015 was reported as 2.6 Tg CO2-eq yr−1 by NYSERDA (Citation2018) and is estimated as 107 Tg CO2-eq yr−1 from the CLCPA approach (), or 41-times greater. This difference is driven by three factors: 1) the use of a GWP of 86 (20-year period, from 2013 IPCC AR5 report) in the CLCPA approach and 25 (100-year period, from 2007 IPCC AR4 report) in the NYSERDA reporting; 2) the use by NYSERDA of EPA coefficients for methane that underestimate emissions (Miller et al. Citation2013; Howarth Citation2014); and, 3) the inclusion of out-of-state emissions in the CLCPA approach but not in the NYSERDA inventory. The choice of time frame for GWP represents a difference of 3.4-fold: if we apply a GWP value of 86 to the NYSERDA data rather than the 25 value they used, the estimated total methane emissions from energy use increase to only 9.0 Tg CO2-eq yr−1, still an order of magnitude less than the estimate from the CLCPA approach. The under-estimation of emissions in the NYSERDA inventory due to their reliance on low EPA emission coefficients represents a difference of 2- to 2.5-fold (Miller et al. Citation2013; Howarth Citation2014). Multiplying these two factors (#1 and #2) together, we see they account for a 6.8-fold to 8.5-fold difference between the NYSERDA inventory and the CLCPA estimate for methane emissions. The majority of the total 41-fold difference between the NYSERDA and CLCPA methane emissions from fossil fuels is attributable to factor #3, the choice of spatial boundaries for considering emissions.
Note that neither the traditional inventory nor the CLCPA approach is “right” or “wrong” in their choice of spatial boundaries. Both approaches have value, but they provide different emphases for policy makers to consider. For example, the consumption-based approach of the CLCPA includes a substantial emission of methane from natural gas development, processing, storage, and transport that occurs outside of the boundaries of the State, which is not included in the traditional inventory. If New Yorkers did not consume the natural gas associated with these emissions, the methane emissions would decrease, which may be a useful insight for policymakers. On the other hand, if the goal is to spatially account for methane emissions across the United States, the NYSERDA (Citation2018) inventory is preferable, as the CLCPA approach includes substantial emissions which occurred in other states such as Pennsylvania.
Similarly, there is not a “right” or “wrong” in the choice of a 20-year vs a 100-year GWP, although the use of a GWP value of 25 for the 100-year time period in the NYSERDA inventory is low and is not based on the most recent IPCC guidance, which instead recommends a GWP100 of 34 when climate-carbon feedbacks are included (Myhre et al. Citation2013). As noted in the “introduction” section, the 20-year time frame places more emphasis on the role of warming by methane over the next few decades. Any choice of time in comparing methane and carbon dioxide emissions is difficult, as the two gases affect the climate on fundamentally different time scales (Shindell et al. Citation2012; Myhre et al. Citation2013). For this reason, some have suggested reporting methane emissions based on both 20- and 100-year time periods (Howarth et al. Citation2011; Ocko et al. Citation2017; Fesenfeld et al. Citation2018). In passing the CLCPA, however, the policy leaders of New York State followed the suggestion of Howarth (Citation2014) and chose to separately report emissions for carbon dioxide and for methane and to use a 20-year time frame for methane, which emphasizes global warming over the coming 10 to 30 years; the long-time scale for global warming is captured by the carbon dioxide emissions. Note that New York’s mandate to reduce GHG emissions is also focused on the relatively short time frame, with emissions to be cut by 40% within 10 years and by 85% within 30 years. Note further that Collins et al. (Citation2018) concluded that reducing methane emissions can aid significantly in reaching the COP21 climate target, since the predicted uptake of carbon dioxide by oceans and the terrestrial biosphere is increased. This effect is greatest when methane emission reductions occur earlier.
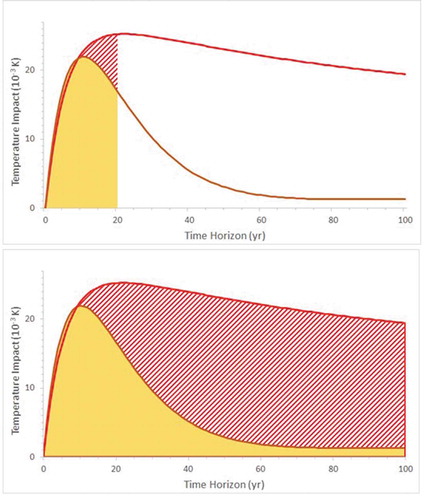
Methane has a half-life in the atmosphere of approximately 12 years (Myhre et al. Citation2013), and so the greatest direct influence of methane emissions on climate is during the few decades after emission, although there is a long temperature tail as the methane emissions warm the deep ocean, and heat is reemitted back from the ocean to the atmosphere over decades and centuries. Carbon dioxide emissions directly influence the climate much further into the future. The difference in time response on global temperature is shown stylistically in . This figure, which is based on Figure 8.33 in Myhre et al. (Citation2013)uses the absolute global temperature change potential (and not GWP) to estimate the consequences of one-year pulses of methane and carbon dioxide into the future. As noted by Myhre et al. (Citation2013), the figure shows the strong but relatively short-lived effects of methane, while carbon dioxide “has a weaker initial effect but one that persists to create a long-lived warming effect”. Both time scales are important to consider. The consequences of climate disruption even over the next few decades could potentially result in massive social disruption, caused by food and water shortages and more frequent extreme weather events, among other factors.
Figure 2. Stylized comparison of the global temperature response over time from carbon dioxide and methane emitted for a 1-year pulse of each gas at time zero. Top shows area under curve integrated for the time zero to year 20 time period, with methane shown as solid yellow and carbon dioxide as striped red. Bottom panel is the same except through the 100 year time period. Note that the integrated area for carbon dioxide in both panels also underlies the area for methane, except for the extreme left-handed side of the curves. Adapted from Figure 8.33 of Myhre et al. (Citation2013), and is based on the absolute global temperature change potential, not GWP. See text
Total GHG emissions from energy use as estimated by the CLCPA guidance are little changed in 2015 as compared to 1990, 294 Tg CO2-eq yr−1 versus 287 Tg CO2-eq yr−1, respectively (). However, direct carbon dioxide emissions in 2015 are 15% less than in 1990 while methane emissions are 29% greater (). Reduced use of both coal and petroleum products contributed to the decreased carbon dioxide emissions, while the increase in methane emissions is driven by a large increase in consumption of natural gas.
Total emissions from waste streams and agriculture saw relatively little change between 1990 and 2015 (); these emissions as reported by NYSERDA (Citation2018) are dominated by methane (principally from landfills followed by animal agriculture), with carbon dioxide emissions from incineration of trash being a relatively minor source. The State has estimated emissions of carbon dioxide from industrial manufacturing processes (such as limestone use and production of cement) as well as emissions of nitrous oxide and various fluorocarbons from multiple sources in this sector as totalling approximately 8 Tg CO2-eq yr−1 in 1990 and 14 Tg CO2-eq yr−1 in 2015. Combining these values with those from fossil fuels and waste streams (), total GHG emissions for New York State, following the guidance of the CLCPA, equalled 365 Tg CO2-eq yr−1 in 1990 and 362 Tg CO2-eq yr−1 in 2015. A robust conclusion is that total emissions have changed remarkably little over the past 25 years, when viewed through the lens of the CLCPA approach.
According to the traditional GHG inventory (NYSERDA Citation2018), emissions are dominated by petroleum products (gasoline, diesel, jet fuel) used for transportation (). Emissions from natural gas in the residential and commercial sector and to generate electricity are important, but substantially less so. The take-home message from the CLCPA-based approach is different: emissions from natural gas dominate, particularly in the residential and commercial sectors, with methane contributing somewhat more than carbon dioxide to these emissions (). As noted above, this difference in emphasis from the NYSERDA (Citation2018) inventory is driven primarily by the CLCPA decision to include out-of-state emissions, and secondarily by the choice of a 20-year GWP and by better estimates for methane emission rates.
The CLCPA (Citation2019) mandates that total GHG emissions in New York State should be reduced by at least 40% by 2030 relative to emissions in 1990 and by at least 85% by 2050, using the GHG-footprint approach of the CLCPA. That is, relative to the estimated total GHG emissions of 365 Tg CO2-eq yr−1 in 1990, emissions should be 220 Tg CO2-eq yr−1 or less in 2030, a reduction of at least 145 Tg CO2-eq yr−1. By 2050, emissions should be reduced by 310 Tg CO2-eq yr−1 or more, to no more than 55 Tg CO2-eq yr−1.
Most of the energy use in residences in New York State is for space heating and domestic hot water, and natural gas is the primary fuel used for this (EIA Citation2009). Petroleum use for transportation is the next largest source of emissions, followed by electricity production, which as with the residential and commercial sector, is dominated by natural gas. To meet the CLCPA 2030 target of a 40% emissions decrease will require a focus on greatly reducing the use of natural gas in the residential and commercial sector and petroleum products in transportation. To date, the State has focussed little attention on GHG emissions from these sectors, and has instead prioritized reducing the use of fossil fuels to produce electricity.
Electrification of heating (ground- and air-sourced heat pumps) and transportation (electric vehicles) provides a pathway to meeting the GHG-reduction mandates of the CLCPA (Jacobson et al. Citation2013). Heat pumps extract energy from the environment, allowing the delivery of far more heat energy than the electrical energy used to power the pumps. As a result, converting from the use of natural gas to a modern heat pump will reduce GHG emissions even if the heat pump is powered by electricity generated from fossil fuels (Hong and Howarth Citation2016). Similarly, electric vehicles reduce overall emissions compared to gasoline and diesel-powered vehicles, even if fossil fuels are used to produce the electricity, because of the greater efficiency of the electric vehicles (Jacobson et al. Citation2013). Consequently, to reduce overall GHG emissions for New York State, electrification of heating and transportation systems must proceed as quickly as possible, even if this precedes reduction of fossil fuels to produce electricity.
The guidelines for GHG accounting enacted in the CLCPA (Citation2019) do not necessarily require policymakers to treat carbon dioxide and methane as equally important. Rather, the guidelines specify that estimates for both gases be presented clearly, with the methane emissions compared to carbon dioxide over a 20-year time frame and based on a full-lifecycle, consumption-oriented analysis. It is then up to decision makers to weigh the shorter-term and long-term consequences of the two gases in developing policies to achieve the stated climate protection goals. For New York State, our political leaders chose to include methane emissions from outside of the State that are associated with energy use within the State and to weigh methane emissions over the 20-year time period, given the COP21 targets and the current rate of global warming.
Acknowledgments
I thank Roxanne Marino, Tony Ingraffea, and two anonymous reviewers for valuable feedback on an earlier draft of this manuscript. This work was supported by a grant from the Park Foundation and by an endowment given by David R. Atkinson to support the professorship at Cornell University held by Robert W. Howarth.
Disclosure statement
The author confirms that he has no conflicts of interest that would adversely influence this research. The research was supported by a grant from the Park Foundation and by an endowment given by David R. Atkinson to support the professorship at Cornell University held by Robert W. Howarth.
Additional information
Funding
References
- Alvarez RA, Zavalao-Araiza D, Lyon DR, Allen DT, Barkley ZR, Brandt AR, Davis KJ, Herndon SC, Jacob DJ, Karion A, et al. 2018. Assessment of methane emissions from the U.S. oil and gas supply chain. Science. 361:186–188. doi:10.1126/science.aar7204
- Caulton DR, Shepson PD, Santoro RL, Sparks JP, Howarth RW, Ingraffea A, Camaliza MO, Sweeney C, Karion A, Davis KJ, et al. 2014. Toward a better understanding and quantification of methane emissions from shale gas development. Proceedings of the National Academy of Sciences. 111:6237–6242. doi:10.1073/pnas.1316546111
- CLCPA. 2019. Climate Leadership and Community Protection Act, State of New York. [accessed 2019 Sept 4]. https://legislation.nysenate.gov/pdf/bills/2019/S6599
- Collins WJ, Webber CP, Cox PM, Huntingford C, Lowe J, Sitch S, Chadburn SE, Comyn-Platt E, Harper AB, Hayman G, et al. 2018. Increased importance of methane reduction for a 1.5 degree target. Environ Res Lett. 13:054003. doi:10.1088/1748-9326/aab89c
- Cornell University. 2016. Options for achieving a carbon neutral campus by 2035: analysis of solutions. Cornell university senior leaders climate action group, September 2016. Ithaca (NY, USA): Cornell University. accessed 2019 Sep 4.https://ctech.cee.cornell.edu›files›2018/02›Cornell-University-Options.
- EIA. 2009. Household energy use in New York. Energy information agency, US department of energy. [accessed 2019 Sep 9]. https://www.eia.gov › residential › reports › state_briefs › pdf › NY
- EIA. 2016a. Table CT2. Primary energy consumption estimates, selected years, 1960–2016, New York, State energy data 2016, consumption. Energy information agency, US department of energy. [accessed 2019 Sep 4]. https://www.eia.gov/state/seds/seds-data-complete.php
- EIA. 2016b. Carbon dioxide emissions coefficients. Energy information agency, US department of energy. [accessed 2019 Oct 11]. https://www.eia.gov/environment/emissions/co2_vol_mass.php
- EIA. 2019. US natural gas total consumption. Energy information agency, US department of energy. [accessed 2019 Sept 4]. https://www.eia.gov/dnav/ng/hist/n9140us2A.html
- Etminan M, Myhre G, Highwood EJ, Shine KP. 2016. Radiative forcing of carbon dioxide, methane, and nitrous oxide: A significant revision of the methane radiative forcing. Geophys Res Lett. 43:12,614–612,623. doi:10.1002/2016GL071930
- Fesenfeld LP, Schmidt TS, Schrode A. 2018. Climate policy for short- and long-lived pollutants. Nat Clim Chang. 8:933–936. doi:10.1038/s41558-018-0328-1
- Hayhoe K, Kheshgi HS, Jain AK, Wuebbles DJ. 2002. Substitution of natural gas for coal: climatic effects of utility sector emissions. Clim Change. 54:107–139. doi:10.1023/A:1015737505552
- Hong B, Howarth RW. 2016. Greenhouse gas emissions from domestic hot water: heat pumps compared to most commonly used systems. Energy Science & Engineering. 4:123–133. doi:10.1002/ese3.112
- Howarth RW. 2014. A bridge to nowhere: methane emissions and the greenhouse gas footprint of natural gas. Energy Science & Engineering. 2:47–60. doi:10.1002/ese3.35
- Howarth RW. 2019. Ideas and perspectives: is shale gas a major driver of recent increase in global atmospheric methane? Biogeosciences. 16:3033–3046. doi:10.5194/bg-16-3033-2019
- Howarth RW, Santoro R, Ingraffea A. 2011. Methane and the greenhouse gas footprint of natural gas from shale formations. Climatic Change Letters. 106:679–690. doi:10.1007/s10584-011-0061-5
- IPCC. 1990. Climate change: the IPCC scientific assessment. Intergovernmental panel on climate change. Cambridge (United Kingdom):Cambridge University Press.
- IPCC. 1996. CH4 emissions: coal mining and handling, good practice guidance and uncertainty management in national greenhouse gas inventories. Intergovernmental Panel on climate change. [accessed 2019 Sept 4]. https://www.ipcc-nggip.iges.or.jp/public/gp/english/
- IPCC. 2013. Climate change 2013: the physical science basis. Contribution of working group i to the fifth assessment report of the intergovernmental panel on climate change, change. [accessed 2019 Sept 4]. https://www.ipcc.ch/report/ar5/wg1/
- Jacobson MZ, Howarth RW, Delucchi MA, Scobies SR, Barth JM, Dvorak MJ, Klevze M, Katkhuda H, Miranda B, Chowdhury NA, et al. 2013. Examining the feasibility of converting New York State’s all-purpose energy infrastructure to one using wind, water, and sunlight. Energy Policy. 57:585–601. doi:10.1016/j.enpol.2013.02.036
- Kaplan T 2014. Citing health risks, Cuomo bans fracking in New York State. New York Times. [accessed 2020 Apr 2 https://www.nytimes.com/2014/12/18/nyregion/cuomo-to-ban-fracking-in-new-york-state-citing-health-risks.html
- Miller SM, Wofsy SC, Michalak AM, Kort EA, Andrews AE, Biraud SC, Dlugokencky EJ, Janusz Eluszkiewicz J, Fischer ML, Janssens-Maenhout G, et al. 2013. Anthropogenic emissions of methane in the United States. Proceedings of the National Academy of Sciences. 110:20018–20022. doi:10.1073/pnas.1314392110
- Myhre G, Shindell D, F-M B, Collins B, Fuglestvedt JS. 2013. Anthropogenic and natural radiative forcing. In: climate Change 2013: the physical science basis. Contribution of working group I to the Fifth Assessment report of the intergovernmental panel on climate change. In: Stocker TF, Qin D, Plattner GK, Tignor M, Allenet SK, editors. Cambridge (United Kingdom and New York, NY, USA): pages 659-740. Cambridge University Press.
- NETL. 2008. Petroleum-based fuels life cycle greenhouse gas analysis - 2005 baseline model. National Energy Technology Laboratory, US Department of Energy. [accessed 2019 Sept 4]. https://openei.org/wiki/NETL_-_PetroleumBased_Fuels_Life_Cycle_Greenhouse_Gas_Analysis_2005_Baseline_Model
- NYSERDA. 2018. New York State Greenhouse Gas Inventory: 1990–2015, Final Report, Revised September 2018. New York State Energy Research and Development Authority, Albany (NY). [accessed 2019 Sept 4]. https://www.dec.ny.gov › docs › administration_pdf › nyserdaghg2015
- Ocko IB, Hamburg SP, Jacob DJ, Keith DW, Keohane NO. 2017. Unmask temporal trade-offs in climate policy debates. Science. 356:492–493. doi:10.1126/science.aaj2350
- Plant G, Kort EA, Floerchinger C, Gvakharia A, Vimont I, Sweeney C. 2019. Large fugitive methane emissions from urban centers along the US east coast. Geophys Res Lett. 46:8500–8507. doi:10.1029/2019GL082635
- Schneising O, Burrows JP, Dickerson RR, Buchwitz M, Reuter M, Bovensmann H. 2014. Remote sensing of fugitive emissions from oil and gas production in North American tight geological formations. Earth’s Future. 2:548–558. doi:10.1002/2014EF000265
- Shindell D, Kuylenstierna JC, Vignati E, van Dingenen R, Amann M, Klimont Z, Anenberg SC, Muller N, Janssens-Maenhout G, Raes R, et al. 2012. Simultaneously mitigating near-term climate change and improving human health and food security. Science. 335:183–189. doi:10.1126/science.1210026
- Shine KP, Fuglestvedt JS, Hailemariam K, Stuber N. 2005. Alternatives to the global warming potential for comparing climate impacts of emissions of greenhouse gases. Clim Change. 68:281–302. doi:10.1007/s10584-005-1146-9
- Tompkins County. 2016. The 2014 Tompkins County Community Greenhouse Gas Emissions and Energy Use Inventory. Tompkins County Planning Department, September 2016. Ithaca, NY, USA. [accessed 2019 Sept 4]. http://tompkinscountyny.gov/planning/energy-greenhouse-gas
- Vaughn TL, Bella CS, Picering CK, Schwietzke S, Heath GA, Pétron G, Zimmerle DJ, Schnell RC, Nummedal D. 2018. Temporal variability largely explains top-down/bottom-up difference in methane emission estimates from a natural gas production region. Proceedings of the National Academy of Sciences. 115:11712–11717. doi:10.1073/pnas.1805687115