
 ?Mathematical formulae have been encoded as MathML and are displayed in this HTML version using MathJax in order to improve their display. Uncheck the box to turn MathJax off. This feature requires Javascript. Click on a formula to zoom.
ABSTRACT
The growing demand but uncertain supply makes the sustainability of the coffee industry a shared concern for all participants along the coffee supply chain. This study proposed a decision-making model that comprises the cultivation management, including shade management and annual agriculture management, and the supply chain logistics. A two-stage stochastic program is presented and used within a rolling horizon scheme that periodically updates input data information to deal with uncertainty associated with future climate scenarios. The program minimizes the total expected cost of the entire supply chain of arabica coffee. The study applied the model to the real case study of arabica coffee bean supply to the U.S. market, trying to answer whether arabica coffee supply can meet the U.S. demand from 2022 to 2050 and how to best mitigate any shortage through corporate-farmer partnerships. The results show that the coffee supply will have a 3% shortage in the future; medium-level shade management and more irrigation and fertilization are possible mitigation strategies. These results demonstrate the need for all participants to adopt suitable technologies for the sustainability of global coffee supply chains together.
1. Introduction
Coffee consumption has increased by 5% in the United States since 2015; 7 in 10 Americans drink coffee every week, and 62% drink every day (National Coffee Association Citation2020). According to the Coffee Market reports from the International Coffee Organization (International Coffee Organization Citation2021), the growth of coffee consumption in Asia, Oceania, and Africa is outpacing other regions and leads to increased global demand for coffee drinks every year. However, the International Coffee Organization also found that the world coffee production decreased by 0.9% in 2019/2020, especially by 3.2% in South America. Climate change has a significant effect on coffee quality and quantity (Chemura et al. Citation2021; Kath et al. Citation2021). Especially, increasing temperature, unpredictable precipitation and pest’s disease have been the main factor for the yield decline of arabica coffee beans in many coffee-growing regions (Davis et al. Citation2012; Jassogne et al. Citation2013; Bunn et al. Citation2015; Bunn et al., Citation2015). Arabica coffee, which accounts for 70% of global coffee production, could decrease by 50% or more by 2088 under all available future projections based on multiple general circulation models (GCMs), emission scenarios, and migration scenarios (Moat et al. Citation2019). Smallholder farmers in developing countries own most of the world’s coffee plantations and have difficulty adapting to the adverse impacts of climate change on the coffee bean yield due to lack of knowledge, access to technologies, and capital (Harvey et al. Citation2018; Bielecki et al., Citation2019). Decrease in coffee production will lead to both an income decline for coffee farmers and a bean supply shortage for coffee beverage companies. Therefore, it is necessary to have a systematic method to study how the global coffee supply chain can adapt to climate change and be sustainable.
Sustainable coffee bean production has been well discussed by academia, governments, international coffee organizations, and private sectors (Krishnan et al. Citation2021). In Latin America, ongoing sustainability efforts on adoption of new rust-resistant varieties, expansion of coffee into forested areas, and conventional intensification of farming system (Harvey et al. Citation2021). One important aspect of the sustainability of coffee supply chains is farming system prevalence (Folnovic Citation2017). An effective farming system associated with shade management and management practices (e.g. fertilization and irrigation) is very important for harvesting. Although coffee yield may decrease under high-density shade, suitable coverage by native trees can protect coffee trees, maintain woody plant communities, provide habitats for animals, and generate additional income for farmers (Liu et al. Citation2016; Jezeer et al. Citation2018; Alvarez-Alvarez et al. Citation2021). For example, in small-scale Peruvian coffee systems, medium-shade plantations have higher gross revenues and coffee yields (Jezeer et al. Citation2018a). In the dry and hot regions of southwest China, an amount of 80% full-irrigation and high nitrogen input lead to higher arabica coffee yield and quality (Liu et al. Citation2016). In view of the difficulties of smallholder famers to build an effective farming system, some global coffee beverage companies like Starbucks have started to provide the farmers with financial and technical support (Starbucks Citation2020).
Existing research on the sustainability of coffee supply generally focuses on climate change impacts on coffee tree distribution (Eitzinger et al. Citation2013; Magrach et al. Citation2015; Tavares et al. Citation2018) but does not tackle with supply chain planning for adaptation. The application of rolling horizon to coffee supply chain planning under climate change is seldom explored. In this study, we investigated an international supply chain network connecting both farmers and coffee beverage companies and developed a stochastic program through a rolling horizon approach to optimize the responses of the supply chain to multiple climate scenarios. We used the model to conduct a case study on a global coffee beverage company and asked the following questions.
How does climate change affect the cultivation practices and logistics of the coffee supply chain?
What are the future coffee bean shortages, even under the optimum cultivation and logistics?
How can a global coffee beverage company help farmers and adjust farmers’ network to adopt to climate change?
We formulate a two-stage stochastic program through a rolling horizon approach for planning a coffee supply chain under various climate scenarios. A real-world case study is presented with numerical experiments. In the case study, we predicate future arabica coffee yield per hectare and suitable arabica coffee tree growing areas under different climate models in the five coffee-supplying countries. Our results describe the effectiveness of different shade management levels, yearly fertilization, irrigation plans, arabica coffee bean shortage and logistic operations towards meeting the demand in the coffee-consuming country. The implication of this study is focused on adaptation and mitigation measures for farmers, coffee beverage companies, and governments.
2. Method
2.1 Coffee supply chain description
We considered a global coffee bean supply chain comprising two main parts: cultivation and logistics. In the cultivation part, farmers plant and manage coffee trees, harvest coffee cherries annually, and process the cherries into green coffee beans for selling. In the logistics part, a global coffee beverage company buys green coffee beans directly from local farms or through secondary coffee cooperatives. Then, the company ships green coffee beans to consumer countries, roasts them in roasting centres, and distributes the roasted beans to retail outlets. Many global coffee beverage companies have begun to be concerned about sustainable coffee cultivation and provide financial and technical support for coffee bean farmers to adopt best management practices against the harmful effects of climate change. illustrates the coffee bean supply chain under study
Figure 1. Coffee bean supply chain.
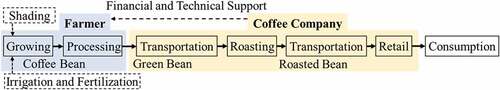
In the cultivation part, at the beginning of the next harvesting seasons, the decision of whether to grow coffee under shade and what the shade level is will be made, and other management decisions such as irrigation and fertilization are short term and can be adjusted at annual or shorter timescales based on weather and soil conditions. The decisions in the logistics part are all short term. To reflect these different decision-making timeframes, this study models the coffee supply chain using a two-stage stochastic program. In the first stage (the beginning of each year’s planning horizon), farmers decide the number of hectares to plant coffee trees under different shade management. In the second stage (each year), farmers decide the number of hectares that uses irrigation and fertilization in their plantations, and the global coffee beverage companies adjust their purchase and transportation of the coffee beans accordingly. As mentioned in the introduction, the iterative procedure of the two-stage stochastic programming model allows to update or modify all input harvesting area parameters to optimize the planning according to the currently available information.
2.2 Variables and parameters definition
Throughout this section, lower-case letters will be used to denote decision variables, or in the superscripts and subscripts, which can take a range of values. Upper-case letters will be used to denote parameters or the ranges from which the superscripts and subscripts take values.
For the cultivation part, the two-stage rolling horizon stochastic programming model considers coffee bean source countries (j as its index) and a planning horizon of T years (
as its index). All decisions depend on weather conditions, which are modelled using a set of climate scenarios
, with each climate scenario
having a probability of occurrence
. The coffee bean cultivation area in country j in year t under climate scenario s is
, in hectare (ha). At the beginning of the first year (
), the cultivated area
was obtained from historical data and therefore was the same for all the climate scenarios (USDA Citation2020). The cultivation area in the future years,
, were equal to the suitable growing area for arabica coffee predicted from a species distribution model under each climate scenario s, and the detailed procedure is given in Section 3.2.
Farmers in each country have
shade management options (
as its index): full sun, low shade, medium shade, and high shade. In the first stage, farmers decide the percentage area,
,
, that adopts shade option e in source country
. Define
the areas that are updated from one type of shade management
to another type of shade management
in country
.
is the area hectare (ha) with shade level
in country
before the first stage’s decision-making, and
is the area in hectare (ha) with shade level
in country
after the first stage’s decision-making. Farms in each country also have
short-term management options (
as its index): no fertilization and no irrigation, no fertilization but irrigation, fertilization but no irrigation, and both fertilization and irrigation. As such, in the second stage, farmers decide the percentage area,
, that adopts short-term management option
in country
in year
under climate scenario
.
Yield per unit cultivated area is a key parameter in the optimization model and must be calculated prior to solving the model. The yield per unit cultivated area in each country in year
under climate scenario
, shade option
, and short-term management option
, is considered to be the sum of two parts: the base unit yield,
, in kg ha−1 year−1, which is affected by the shade management and weather conditions, and the additional unit yield,
, in kg ha−1 year−1, which is the marginal effect created by fertilization and irrigation. The base and additional unit yield values were estimated using a combination of regression techniques and literature values, and the detailed procedure is given in Section 3.2. The base coffee bean yield of country
in year
under climate scenario
is equal to the base unit yield per unit area multiplied by the percentage area that adopts each shade option multiplied by the area of cultivation with shade level
in country
before the first stage’s decision-making, summed across all the shade options, and add the base unit yield per unit area multiplied by the difference of the suitable growing area and the minimal of the initial suitable growing area in year 0 and the suitable growing area in year t
). The additional coffee bean yield of country
in year
under climate scenario
is equal to the additional unit yield per unit area multiplied by the percentage area that adopts each short-term management option multiplied by the area of cultivation, summed across all the short-term management options (
). The total coffee bean yield is the sum of the base and additional coffee bean yields.
The cost of coffee cultivation involves two parts. The first part is the one-time cost associated with shade management change, which is denoted by , in $ ha−1, for changing from shade option
to
. The second part is the annual variable cost of fertilization and irrigation, which is denoted by
$ ha−1 year−1, for short-term management option q. Using these unit costs, the cost of changing shade management of
hectares from
to
in each country j is
, and the total variable cost is
.
For the logistics part, the two-stage stochastic programming model considers three processing flows. First, an annual percentage of green arabica coffee beans produced in coffee beans source country
is exported to the consumer countries via ocean shipping. The shipping destinations are
ports (
as its index). Second, the green arabica coffee beans are sent from the ports to
roasting centres (
as its index) by trucks. Third, the roasted arabica coffee beans are sent from the roasting centres to
retail destinations (
as its index) by trucks. The demand of roasted arabica coffee beans in retail destination
in year
is
, in kg.
For each of the three processing flows, the logistics cost is the unit transportation cost multiplied by transported coffee bean volume. The cost of shipping from source country to port
in the consumer countries is
, where
, in kg, is the coffee beans imported from source country
at port
in year
under climate scenario
, and
, in $ kg−1, is the unit ocean shipping cost from source country
to port
. The cost of shipping from port
to roasting centre
is
, where
, in kg, is the coffee beans transported form port
to roasting centre
in year
under climate scenario
and
, in $ kg−1 is the unit truck transportation cost from port
to roasting plant
. The roasting capacity of each roasting centre
in year
is
, in kg. The unit roasting cost in roasting centre r is
, in $ kg−1. The cost of shipping from the roasting centre r to retail destination m is
, where
, in kg, is the volume of roasted coffee beans shipped from roasting centre
to retail destination
in year
under climate scenario
, and
, in $ kg−1, is the unit truck transportation cost from roasting centre
to retail destination
. Therefore, the total transportation and roasting cost of the coffee beans from the source countries to the retail destinations, in year t under climate scenario s, is
. Various volume loss may occur along supply chain flows. Before international transportation, the loss can be caused by the processing of coffee berry into green coffee beans and the storage loss of green coffee beans. During ocean shipping, there is also a volume loss for green beans. We assume that the coffee bean volume is reduced to
when arriving at ports in the consuming country based on the Transport Informations Service (Citation2020). The roasting process will further reduce the volume, and this study assumes that the volume of beans is further reduced to
when leaving roasting centres, also based on the Transport Informations Service (Citation2020).
If the arabica coffee bean supply cannot meet the demand, the coffee beverage company will have shortage , in kg, in destination m in year t under climate scenario s. We use
to denote unit cost in $ kg−1 for unfulfilled demand, including the loss of profit and consumer goodwill. Therefore, the total shortage cost in year t under climate scenario s is
.
2.3. Mathematical model
The goal of the two-stage program is to find the shade and short-term management options and logistics network that minimizes the total cost for farmers and coffee companies under different climate models. The overall objective function and the constraints are as follows.
s.t.
The objective function (1) minimizes the total cost for cultivation, logistics, and shortage. Constraint set (2) makes sure that the sum of base unit yield and additional unit yield, after considering the processing loss and being multiplied by the export percentage to the target-consuming country, should be greater than or equal to the annual shipment to all the ports at the consuming country. Constraint set (3) makes sure that the sum of the updated areas and the area with shade before the first stage’s decision-making equal to the area with shade after the first stage’s decision-making. Constraint set (4) ensures the initial harvesting area applied shade equals to the area with shade after the first stage’s decision-making. Constraint sets (5) and (6) ensure mass flow conservation at the ports and the roasting centres while constraint set (7) enforces roasting centre capacities. Constraint set (8) is used to obtain shortage after meeting consumer demand. Constraint set (9) ensures that the total area in each production country allocated to different shade options and short-term management options sum up to 100%. The stochastic model as outlined in (1)−(9) only involves continuous variables and has low computational burden.
3 Description of the starbucks case study
The proposed two-stage rolling horizon stochastic program is applicable to any global coffee supply chain. This study selected the U.S. Starbucks as a case study. Starbucks is one of the most successful and popular coffee companies around the world. In the U.S., Starbucks occupies around 40% of the coffee industry business and operates 15,149 coffee shops as of March 2020 (Shahbandeh Citation2020). Starbucks also has some involvement at the cultivation stage through Farmer Support Center (Starbucks Citation2018). The goal of this case study is to evaluate the future decision-making of Starbucks’ technical support and financial investment for farmers and logistics under different future climate scenarios. The study was not a collaboration with Starbucks, and all the data about the company were obtained from publicly available sources.
To parameterize the stochastic program, historical agricultural data, arabica coffee supplies and demands data and transportation data were collected for the Starbucks case, and are described in supplementary materials Section 1.1. The coffee beans were mainly imported from five countries, Brazil, Colombia, Ethiopia, Honduras, and Peru. To simulate future supply conditions, the stochastic program used empirically estimated future yields per unit area (unit yield) and suitable growing area for arabica coffee. The impacts of weather on unit yield were estimated using K-Nearest-Neighbour (KNN) regressions between historical unit yields and weather in the five countries. Future unit yields were predicted using the trained KNN regressions and the outputs of seven climate models, i.e. BCC-CSM2-MR (BCM), CNRM-CM6-1(CC1), CNRM-ESM2-1 (CE1), CanESM5 (C), IPSL-CM6A-LR (ICL), MIROC-ES2L (ME), and MIROC6 (M), under the Shared Socio-Economic Pathways 5–8.5 (SSP585) scenario. The regression-predicted future unit yields were adjusted to different shading levels (unshaded, low shaded, medium shaded, and high shaded) and management options (no fertilization with no irrigation, no fertilization with irrigation, fertilization with no irrigation, and fertilization with irrigation) using literature-based multiplicative coefficients (Soto-Pinto et al. Citation2000; de Souza et al. Citation2012; Liu et al. Citation2016). Coffee produced from Ethiopia are mostly shade grown, while coffee from Brazil and Colombia are mostly sun grown (Eartheasy Citation2015). Therefore, the future unit yields predicted by the regression were assumed to represent the yield under no shade, fertilization, or irrigation in Honduras, Peru, Colombia, and Brazil, and medium shade, no fertilization, or irrigation in Ethiopia. More details on the KNN regression and prediction procedure are described in supplementary materials Sections 1.2. Future suitable growing area for arabica coffee were estimated using the Maxent algorithm for modelling species niches and distributions (Phillips and Miroslav Dudík Citation2020), the outputs of the same seven climate models as above, and the Janks natural breaks classification method (De et al. Citation2007). More details on the estimation of suitable growing area are described in supplementary material Sections 1.3.
4 Results
The proposed two-stage stochastic model of coffee supply chain planning was coded and solved in Gurobi, a popular optimization solver. A 29-year planning horizon has been considered in this study. The optimal planning results for 2022–2050 decide what to do for the next 29 years. We only solve the model for year 2022. For the next year’s planning, we can solve the problem from 2023 to 2052 with new datasets. In all five coffee-growing countries and for all seven climate models, the results showed that medium-level shade, which has the highest yield among the four shading choices (Section 3.2), should be implemented. shows the optimized annual short-term fertilization and irrigation planning for each coffee growing country and climate model. In 2022, the management practices planning under seven climate models is shown in . Shade management and management practices planning in five coffee growing countries in 2022 under climate BCM is shown in .
Figure 2. Shade management and management practices planning in five coffee growing countries in 2022 under climate BCM. Every country can apply more than one type of management practice, if the total percentage area that implement each management practice sum up to 100%.
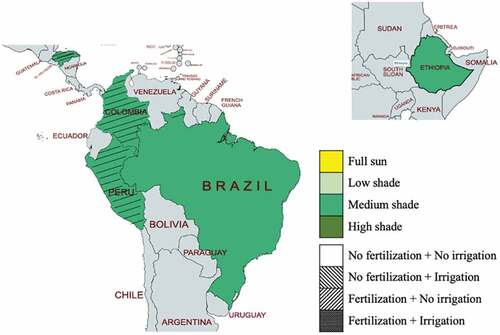
Table 1. Management practices planning in five coffee growing countries under seven climate models in 2022.
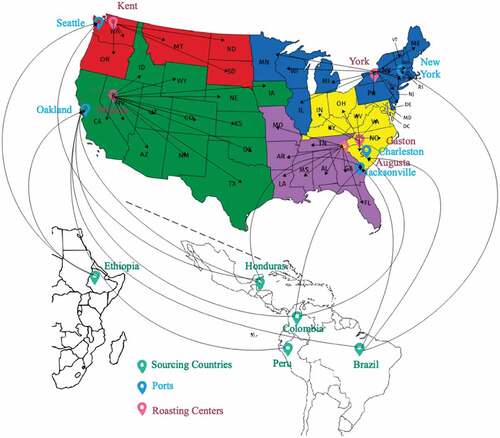
shows the optimized supply chain logistics network for arabica coffee beans to be delivered from Honduras, Peru, Colombia, Brazil, and Ethiopia to 48 U.S. states and Washington, D.C. The result shows that five ports, Port of Seattle, Port of Oakland, Port of New York, Port of Charleston, and Port of Jacksonville, are chosen from the top 10 U.S. ports as the import ports for the arabica coffee beans. The results also indicate that the shortest route for all the transportation processes will always be chosen at first. From supply countries to ports in the U.S., Ethiopia and Peru ship the arabica coffee beans to the ports in Seattle and Oakland on the west coast. Honduras, Colombia, and Brazil ship the arabica coffee beans to both coasts. The beans are then transported to the nearest roasting centre from the ports, and the routes are Seattle to Kent, Oakland to Minden, New York to York, Charleston to Gaston, and Jacksonville to Augusta. Roasted beans are delivered from roasting centre to nearby states, subject to roasting centre capacities.
Figure 3. Optimal transportation network for the Starbucks coffee bean supply chain in 2022.
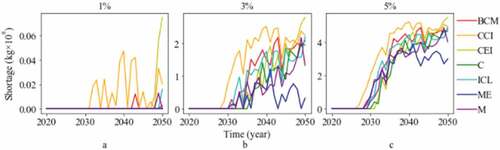
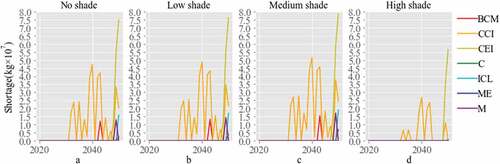
Under an annual 1% increase of demand until 2035 and constant demand after that, the result of the supply chain planning model showed that the arabica coffee bean supply could not meet the demand in the future even under the best farming management and logistics planning (). We repeated the calculations for two additional demand increasing rates (3% and 5%) under seven climate models. Under the annual 1% increase of demand scenario, Starbucks will start to have shortages in 2031. Under the 3% and 5% scenario, Starbucks will start to have shortages 1–2 years earlier than 2031. The demand increasing rate has a significant influence on the shortage. Starbucks will have more shortages with a more considerable demand for Arabic coffee. As the demand increasing rate rises from 1% to 5%, the shortage increases dramatically. The shortage is around 0.03 × 10⁸ kg under a 1% increasing rate in 2050. However, this number will rise to 4 × 10⁸ kg in 2050 under a 5% increasing rate. The shortages are also different under different climate models. Under the CNRM-CM6-1(CC1) model, the suitable growing area for Arabica coffee is the smallest, which causes more shortage in all demand scenarios (orange line).
Figure 4. Starbucks’ arabica coffee bean shortage with an annual demand increase by a) 1%, b) 3%, and c) 5% under seven climate models.
Since Ethiopia already applied shade-grown coffee, we also compared the Starbucks’ arabica coffee bean shortage when Ethiopia uses no, low, medium, and high shade management before the first stage’s decision-making with an annual demand increase of 1%, 3%, and 5% for seven climate models. The shortage for 1% increasing demand is shown in , and the shortage for 3% and 5% increasing demand are listed in the supplemental material Figure S4-S5. As shown in , we can see that Starbucks will have the biggest shortage when Ethiopia uses medium shade management then the amount of shortage followed by low shade, no shade, and high shade. There is no shortage under the CanESM5(C) climate model. As we mentioned before, the ratios of coffee bean yield for unshaded, low shaded, medium shaded, and high shaded conditions to be 1: 1.1: 1.65: 0.3. If Ethiopia is using high shade now, there will be a big improvement of the yield after they change the shade management into the medium shade so that the shortage will be the smallest under this assumption. On the contrary, if Ethiopia uses medium shade now, there is no room for growth, so the shortage is the biggest under this assumption.
Figure 5. Starbucks’ arabica coffee bean shortage under no, low, medium, and high shade in Ethiopia with an annual demand increase by 1% for seven climate models.
5 Policy recommendations
To maintain the production of arabica coffee beans under climate change, implementing suitable long-term shade management and annually short-term management practices (fertilization and irrigation) in coffee-growing counties is important. As suggested in the case study, growing coffee under medium-level shading is the most efficient shade strategy under any demand or climate scenario. This strategy can protect coffee trees from exposure to high temperatures and too much sunlight and provide more natural nutrition for coffee trees (Johnson Citation2020). Therefore, forest conservation and new tree planting should be considered. Planting local species for shading is more cost-effective than planting other tree species. Therefore, farmers should take choosing right species into consideration to avoid nutrition competition. They could grow coffee trees under existing shade trees or some value-added crops for additional benefits. Local governments may issue regulations to preserve existing forest from severe deforestation. Companies can send experts to help farmers to identify the appropriate shade species for every plantation based on their location and climate condition. Yearly management practices recommended by results from our optimization show that the need for irrigation and fertilization application in all five coffee producing countries beyond 2030. Sufficient precipitation is an essential requirement for coffee growing. However, precipitation will decrease in Honduras, Peru, Brazil, and Colombia, and increase in Ethiopia in the multi-model ensemble means in the SSPs from 1850 to 2100 (Cook et al. Citation2020). Therefore, local governments and companies can provide financial and technical support for building irrigation infrastructure to help farmers improve their resilience against drought and maintain stable incomes. The need for more fertilizers implies the importance of promoting organic fertilizers, which is superior to synthetic fertilizers to create a sustainable environment. Farmers could apply organic fertilizer to improve the productivity and sustainability of coffee plant. Beside the implementation of appropriate shade, irrigation, and fertilization practices, the productivity of coffee farms can be promoted by using new disease- and drought-resilient coffee bean species and other advanced agricultural technologies (e.g. fertigation). Coffee farmers are generally smallholders, many of whom are poor, experience food insecurity and live in highly precarious conditions and have limited financial resources for acquiring health kites, adopting drip irrigation and pest control and accessing precision agricultural technologies (Harvey et al. Citation2018; Akenroye et al. Citation2021). Therefore, coffee beverage companies and local government should play an active role in providing financial, technical, and educational supports for them. The collaboration will benefit all partners on the supply chain. In addition to economic sustainability, the sustainability of coffee supply chain includes social sustainability. In most coffee producing countries, farmers work and live under deplorable conditions. Their health is subject to pesticides, injures caused by cutting tools during harvesting and air and noise pollution in processing coffee berries. Local government should take responsible to improve the working conditions for farmers by providing necessary life and health insurance for them.
6. Discussion, conclusions, and future study
The discussion mainly focused on environmental governance, economic and social impacts and the need for collaboration among all actors in the coffee community (Seuring and Müller Citation2008). There are three aspects of sustainability for coffee supply chains, farming system prevalence, environmental management and social responsibilities. We investigated the arabica coffee supply chain planning under climate change using a two-stage stochastic model with the objective being to minimize the cultivation, transportation, and shortage cost under various climate scenarios while meeting growing future demands. The model was demonstrated and tested in a case study on a real-world global coffee beverage company and used within a rolling horizon scheme. The results show that the arabica coffee yield per unit area initially increases in Ethiopia for few years and decreases in the end and decreases in Honduras, Peru, Colombia, and Brazil under seven climate models. Without shade management and management practices to boost productivity, arabica coffee production in these countries will not meet the increasing coffee demand. To increase the coffee yield, medium-level shade management should be applied generally, and the percentage area that requires irrigation and fertilization practices needs to be adjusted annually and will increase over time. A comparison of shortages under different initial shade management of Ethiopia suggests the adjustment to better shade management can reduce the shortage. However, even with better shading management, management practices, and logistics, the model suggests large coffee bean shortage in the future under all climate models with 1%, 3%, and 5% demand increasing rate scenarios. Therefore, in the policy recommendation section, we also suggested additional adaptation and mitigation measures, such as introducing more drought and pest-resistant coffee species and sourcing coffee beans from more coffee-producing countries, could be useful. Environmental management has also played an essential role in reducing negative climate change impact, which including water conservation, forest conservation, and restoration. It is increasingly difficult for coffee farmers to get enough water due to the environmental degradation, climate change, and inappropriate water resources use. Therefore, building more water instruments is crucial to deal with the difficulty (Cerdán et al. Citation2012). In the social responsibility’s aspect, Bielecki and Wingenbach (Citation2019) come up with a livelihood’s framework including three stages, and the first stage is analysing the producers’ context (e.g. history, politics, etc.), resources, institutions, and organizations, the second stage is analysing the vulnerabilities in context, the third stage is analysing the response to vulnerabilities.
This study has potential limitations. The temperature and precipitation are long-term effects for coffee bean production. However, flooding and logistics disruption happen as short-term risks, which are hard to be considered in our model. Then, although the case study was on the U.S. Starbucks, the coffee supply chain model of this study can be applied to other countries, companies, and coffee strains (e.g. Robusta). The coffee bean yield prediction model and the coffee supply chain model are both simple and can be improved in many ways in the future. The use of kNN regression to predict arabica coffee yield per hectare is quite uncertain, because it only considers the monthly temperature and precipitation in harvesting seasons at country-average level, neglecting many factors such as local elevation and microclimate, migration of coffee cultivation from lower to higher elevations, diseases and pests, and coffee species (Läderach et al. Citation2017; Moat et al. Citation2017). The assumption that the base unit yield and additional unit yield are additive is also likely inaccurate. In the future, physiological model that explicitly simulates the growth using climate forcing and management assumptions can be used. The stochastic model does not consider the feedback effect of coffee price on the adoption of management practices and cultivation area, the storage inventory of coffee beans in the source countries or at the roasting centres, or macroeconomic factors and government policies. In the future, coffee price effects can be added into the optimization model by maximizing the long-run profits with pricing. An inventory conservation constraint can be added into the model to capture supply and demand dynamics across years.
Disclosure statement
No potential conflict of interest was reported by the author(s).
Data availability statement
The authors confirm that the data supporting the findings of this study are available within the article and its supplementary materials. https://github.com/rachelriri0228/coffee-supply-chain-planning.git
Additional information
Funding
References
- Akenroye TO, Dora M, Kumar M, Elbaz J, Kah S, Jebli F. 2021. A taxonomy of barriers to the adoption of sustainable practices in the coffee farming process. J Clean Prod. 312(October 2020):127818. doi:10.1016/j.jclepro.2021.127818.
- Alvarez-Alvarez EA, Almazán-Núñez RC, González-García F, Brito-Millán M, Méndez-Bahena A, García-Ibáñez S. 2021. Shade coffee plantations maintain woody plant diversity and structure in a cloud forest landscape of southern Mexico. Journal of Forestry Research. 32(2):637–648. doi:10.1007/s11676-020-01143-5.
- Bielecki CD, Wingenbach G. 2019. Using a livelihoods framework to analyze farmer identity and decision making during the central American coffee leaf rust outbreak: implications for addressing climate change and crop diversification. Agroecol Sustain Food Syst. 43(4):457–480. doi:10.1080/21683565.2019.1566191.
- Bunn C, Läderach P, Ovalle Rivera O, Kirschke D. 2015. A bitter cup: climate change profile of global production of Arabica and Robusta coffee. Clim Change. 129(1–2):89–101. doi:10.1007/s10584-014-1306-x.
- Bunn C, Castro F, Lundy M (2018). The impact of climate change on coffee production in Central America. https://cgspace.cgiar.org/handle/10568/93348
- Cerdán CR, Rebolledo MC, Soto G, Rapidel B, Sinclair FL. 2012. Local knowledge of impacts of tree cover on ecosystem services in smallholder coffee production systems. Agric Syst. 110:119–130. doi:10.1016/j.agsy.2012.03.014
- Chemura A, Mudereri BT, Yalew AW, Gornott C. 2021. Climate change and specialty coffee potential in Ethiopia. Sci Rep. 11(1):1–13. doi:10.1038/s41598-021-87647-4.
- Cook BI, Mankin JS, Marvel K, Williams AP, Smerdon JE, Anchukaitis KJ. 2020. Twenty-first century drought projections in the CMIP6 forcing scenarios. Earth’s Future. 8(6):1–20. doi:10.1029/2019EF001461.
- Davis AP, Gole TW, Baena S, Moat J, Fenton B. 2012. The impact of climate change on indigenous arabica coffee (coffea arabica): predicting future trends and identifying priorities. PLoS ONE. 7(11):10–14. doi:10.1371/journal.pone.0047981.
- De SMJ, Goodchild MF, Longley P (2007). Geospatial analysis: a comprehensive guide to principles, techniques and software tools. Leicester: Matador website; [accessed Mar 8, 2021]. https://www.spatialanalysisonline.com/HTML/index.html
- de Souza HN, de Graaff J, Pulleman MM. 2012. Strategies and economics of farming systems with coffee in the Atlantic rainforest biome. Agrofor Syst. 84(2):227–242. doi:10.1007/s10457-011-9452-x.
- Eartheasy. (2015). Shade grown coffee. [accessed Mar 8, 2021]. https://learn.eartheasy.com/guides/shade-grown-coffee/
- Eitzinger A, Läderach P, Carmona S, Navarro C, Collet L (2013). Prediction of the impact of climate change on coffee and mango growing areas in Haiti. Full Technical Report. Centro Internacional de Agricultura Tropical, (August), 44.
- Folnovic T (2017). Sustainable coffee farming across the world. [accessed 2021 Feb 23]. https://blog.agrivi.com/post/sustainable-coffee-farming-across-the-world
- Harvey CA, Saborio-Rodríguez M, Martinez-Rodríguez MR, Viguera B, Chain-Guadarrama A, Vignola R, Alpizar F. 2018. Climate change impacts and adaptation among smallholder farmers in Central America. Agric Food Secur. 7(1):57. doi:10.1186/s40066-018-0209-x.
- Harvey CA, Pritts AA, Zwetsloot MJ, Jansen K, Pulleman MM, Armbrecht I, … Valencia V. 2021. Transformation of coffee-growing landscapes across Latin America. A review. Agron Sustain Dev. 41(5. doi:10.1007/s13593-021-00712-0
- International Coffee Organization. (2021). International coffee organization - What’s new. [accessed 2021 Mar 22]. http://www.ico.org
- Jassogne L, Läderach P, Asten PVAN. 2013. the impact of climate change on coffee in Uganda. Oxfarm Research Reports Oxfarm Policy and Practice: Climate Change and Resilience. 9(April):51–66.
- Jezeer RE, Santos MJ, Boot RGA, Junginger M, Verweij PA. 2018. Effects of shade and input management on economic performance of small-scale Peruvian coffee systems. Agric Syst. 162(February):179–190. doi:10.1016/j.agsy.2018.01.014.
- Johnson T (2020). Shade Management – coffee&climate toolbox. [accessed 2021 Mar 15]. https://toolbox.coffeeandclimate.org/tools/shade-management
- Kath J, Mittahalli Byrareddy V, Mushtaq S, Craparo A, Porcel M. 2021. Temperature and rainfall impacts on robusta coffee bean characteristics. Climate Risk Management. 32(October 2020):100281. doi:10.1016/j.crm.2021.100281.
- Krishnan S, Matsumoto T, Nagai C, Falconer J, Shriner S, Long J, Vega FE, Vega FE. 2021. Vulnerability of coffee (coffea spp.) genetic resources in the United States. Genetic Resources and Crop Evolution. 68(7):2691–2710. doi:10.1007/s10722-021-01217-1.
- Läderach P, Ramirez–Villegas J, Navarro-Racines C, Zelaya C, Martinez–Valle A, Jarvis A. 2017. Climate change adaptation of coffee production in space and time. Clim Change. 141(1):47–62. doi:10.1007/s10584-016-1788-9.
- Liu X, Li F, Zhang Y, Yang Q. 2016. Effects of deficit irrigation on yield and nutritional quality of Arabica coffee (coffea arabica) under different N rates in dry and hot region of southwest China. Agric Water Manag. 172:1–8. doi:10.1016/j.agwat.2016.04.007
- Magrach A, Ghazoul J, Moreira F. 2015. Climate and pest-driven geographic shifts in global coffee production: implications for forest cover, biodiversity and carbon storage. PLoS ONE. 10(7):1–15. doi:10.1371/journal.pone.0133071.
- Moat J, Williams J, Baena S, Wilkinson T, Gole TW, Challa ZK, Davis AP, Davis AP. 2017. Resilience potential of the Ethiopian coffee sector under climate change. Nat Plants. 3(June). doi:10.1038/nplants.2017.81.
- Moat J, Gole TW, Davis AP. 2019. Least concern to endangered: applying climate change projections profoundly influences the extinction risk assessment for wild arabica coffee. Glob Chang Biol. 25(2):390–403. doi:10.1111/gcb.14341.
- National Coffee Association. (2020). NCA releases 2020 national coffee data trends, the “atlas of American coffee”. [accessed 2021 Feb 23]. https://www.ncausa.org/Newsroom/NCA-releases-Atlas-of-American-Coffee
- Phillips SJ, Miroslav Dudík RES (2020). Maxent software for modeling species niches and distributions (Version 3.4.1). [accessed 2020 Dec 15]. https://biodiversityinformatics.amnh.org/open_source/maxent
- Seuring S, Müller M. 2008. From a literature review to a conceptual framework for sustainable supply chain management. J Clean Prod. 16(15):1699–1710. doi:10.1016/j.jclepro.2008.04.020.
- Shahbandeh M. (2020). Domestic consumption of coffee in the United States from 2013/14 to 2019/2020. [accessed 2021 Mar 22]. https://www.statista.com/statistics/804271/domestic-coffee-consumption-in-the-us
- Soto-Pinto L, Perfecto I, Castillo-Hernandez J, Caballero-Nieto J. 2000. Shade effect on coffee production at the northern Tzeltal zone of the state of Chiapas, Mexico. Agric Ecosyst Environ. 80(1–2):61–69. doi:10.1016/S0167-8809(00)00134-1.
- Starbucks (2018). Starbucks farmer support centers. [accessed 2020 Dec 14]. https://stories.starbucks.com/press/2018/starbucks-farmer-support-centers
- Starbucks. (2020). Planet. [accessed 2021 Mar 22]. https://stories.starbucks.com/stories/planet
- Tavares PDS, Giarolla A, Chou SC, Silva AJDP, Lyra ADA. 2018. Climate change impact on the potential yield of Arabica coffee in southeast Brazil. Reg Environ Change. 18(3):873–883. doi:10.1007/s10113-017-1236-z.
- Transport Informations Service. (2020). Coffee. Retrieved 2021 Mar 22, from https://www.tis-gdv.de/tis_e/ware/genuss/kaffee/kaffee-htm/
- USDA. (2020). Coffee | USDA foreign agricultural service. [accessed 2021 Mar 1]. https://www.fas.usda.gov/commodities/coffee