
 ?Mathematical formulae have been encoded as MathML and are displayed in this HTML version using MathJax in order to improve their display. Uncheck the box to turn MathJax off. This feature requires Javascript. Click on a formula to zoom.
ABSTRACT
When assessing the achievement of the 2030 Agenda, the equilibrium among the dimensions of the sustainable development should be taken into account, recognizing the balanced and integrated nature of the Sustainable Development Goals (SDGs). To this end, we propose the use of a Balance Index to complement the performance indexes of the SDGs and the integration of sustainable development dimensions and experts’ opinions in the normalization process. The data source is the 2020 SDG Index Report proposed by the Bertelsmann Stiftung and the Sustainable Development Solutions Network. Provide and analyse the performance and the balance indexes for OECD countries. Finally, we propose a visual matrix of the two indexes with four progress scenarios to orientate the decision-making. This proposal allows a more accurate quantification of the situation of each country and is, therefore, a useful tool for evaluating the integrated nature of the sustainability (SDG 17).
1. Introduction
The United Nations 2030 Agenda, approved in 2015, comprises 17 Sustainable Development Goals (SDG) and 169 targets to achieve the sustainable development (SD), grouping them in five pillars (5P): People, Planet, Prosperity, Peace and Partnership (UNSSC Citation2017). During the evaluation process of the 2015 Millennium Agenda and the definition of the 2030 Agenda there was much discussion (technical, scientific, and political) about the selection of these goals and their grouping into pillars. In 2012, Jeffrey Sachs, Special Adviser to UN Secretary-General Ban Ki-moon on the Millennium Development Goals (MDGs), shared his perspective on the post-2015 development agenda in an event at the Overseas Development Institute. He “proposed four pillars for a set of post-2015 goals, to: end poverty in all its forms; ensure social inclusion; address the environmental agenda, including biodiversity, climate change and oceans; and governance to support the first three goals” (International Institute for Sustainable Development-SGD Knowledge hub Citation2012).
The final selection of the 5P is very close to the classical pillars of the SD: Economic development (Prosperity), Environmental protection (Planet) and Social inclusion (People), introducing Governance (Peace and Partnership) as the most recent pillar of SD, which international organizations have undoubtedly vindicated. In this sense, the Agenda enhances the idea of the integrated sustainable development (ISD), empowering Governance and the mechanisms to manage the goals: planning, monitoring and evaluating them. United Nations Environment Programme (UNEP (United Nations Environment Programme) Citation2013) identified “aligning governance to the challenges of global sustainability” as the most urgent emerging issue related to the global environment. Authors as Kanie et al. (Citation2014), propose to consider the governance as the fourth pillar of sustainable development and the 2017 High-Level Political Forum (High-level political forum, HLPF Citation2017) of the 2030 Agenda argued that “governments must share how they are generating effective and inclusive institutions for SDG delivery- what can be considered the ‘fourth’ pillar” of sustainable development.” In the most recent annual meeting of the Economic and Social Council and the HLPF (4–8 April 2022), the focus was specifically on “transforming institutions and governance to achieve peace and the 17 Sustainable Development Goals (SDGs)”.
The multidimensional vision of the development theories requires promoting policies that interact with one another (Adams Citation2017). In addition, adequate assessment tools must be available to reflect this multifaceted nature of the concept and, at the same time, to allow an effective diagnosis and evaluation of the outcomes. Therefore, the assessment of the 2030 Agenda requires systematic evaluation tools, not just a set of global indicators. As Nilsson et al. (Citation2016) argued “policymakers lack tools to identify which interactions are the most important to tackle, and evidence to show how particular interventions and policies help or hinder progress towards the goals”. We oriented our research and proposal to provide a useful tool to this end.
The current measure of performance systems from international institutions prioritize the use of indicators and composite indexes, despite their shortcomings (Diaz-Balteiro et al. Citation2017), in SD and other fields (El Gibari et al. Citation2019). In fact, the United Nations endorses the annual reports jointly prepared by the Sustainable Development Solutions Network (SDSN) and the Bertelsmann Stiftung foundation since 2016, where they collect two measures of the achievement of the 2030 Agenda: the SDG Index and the SDG Dashboard (Sachs et al. Citation2017).
Despite these reports have created 17 goals index to analize monitor the performance of the Agenda, they did not incorporate the idea of the 5 pillars (5P) in their evaluation and, even less, the four pillars of ISD that are behind the entire Agenda. Neither have they considered the necessary balance among these pillars to accomplish a real ISD.
Our research involves two improvements in the existing approaches to properly consider and measure the ISD, beyond the SD, and facilitate the definition of ISD policies. First, we propose a modification of the SDG Index, named 4D Experts SDG (4D-ESDG) Index, which calculates the aggregate score of SDGs for each country, incorporating the reference levels set by the experts for the construction of the SDG Dashboard and grouped them in the four pillars of SD (4D) (Sachs et al. Citation2020; pg.93). We integrate these levels using the normalization proposed in the Multiple Reference Point based Weak and Strong Composite Indicators (MRP-WSCI) method, proposed by Ruiz et al. (Citation2020), a generalization of the double reference point method (Ruiz et al. Citation2011), for the construction of synthetic indexes. We group the SDGs into the four pillars of SD (Economic development, Social inclusion, Environmental protection and Governance), named “dimensions” to distinguish them from the “pillars” (5P) of the 2030 Agenda.
In the second place, we consider here that the measurement of ISD must evaluate not only the accomplishments achieved by the territories, but also the balance that they have promoted among the four dimensions (4D) To measure this balance, we propose a second index, which we call Balance (B) Index, based on the concentration index of Herfindahl-Hirschman (HHI) used in the regional economy (Rhoades Citation1993), which evaluates the weight of each one of the dimensions of the ISD in the final result. Finally, we propose the visualization of the two indexes (performance and balance) for each territory in a graphic matrix with four progress scenarios towards the ISD (Briguglio et al. Citation2009) to orientate the decision-making.
The combination of a global measure of performance with the balance index is a new diagnosis tool of the ISD. It has two key properties to help decision makers: its mathematical simplicity and its straightforward interpretation to monitor balance in SDG achievement within and across the countries.
The use of the balance index and the scenarios’ matrix allows the decision-makers to see at a glance whether the efforts made, in addition to the results, are guaranteeing an integrated and coherent development, breaking down the political “silos”.
After the analysis of the theoretical framework in the second section, we detail the proposed methodology and the data source applied, using as a starting point the 2020 SDG Index Report and its results for the OECD countries.
In the third section, we set out the main results and improvements obtained with the use of our method and the way it reveals the existence of an unbalanced development in some of the OECD countries often considered prominent ones in sustainability and in the leading positions of the SDG index ranking.
Finally, we draw the main conclusions and contributions of the proposed method and gather some discussions around its use based on the literature and the most recent papers on the subject, remarking that our proposal goes beyond a new way of measuring ISD. It constitutes an evaluation tool to carry out a more accurate diagnosis of the performance of a territory, which will serve for the design of ISD policies.
2. Theoretical framework
2.1. The concept of the integrated sustainable development (ISD)
The SD does not count with a single definition and has evolved considerably over the last thirty years, involving increasingly the “linkages between ‘natural’ and ‘human’ systems, including attention to questions of environmental justice” (Redclift Citation2005). In this sense, the economic, social, and environmental pillars of the SD are widely accepted in the literature and in international organizations since the beginning of this century.
In the last decade, Governance has consolidated as the fourth pillar of SD (Kanie et al. Citation2014), and international organizations have vindicated its key role. As Meuleman and Niestroy (Citation2015, p. 12,298) point out, the governance is “the totality of interactions, in which government, other public bodies, private sector and civil society participate, aiming at solving societal problems or creating societal opportunities”. UNDP (United Nations Development Programme) (Citation2014) maintain in a discussion paper that in the Post-2015 process it is very important to understand “the governance as an end of development, and not just an enabler”. Biermann et al. (Citation2014) proposed that “the ideal solution would lie in agreeing on a stand-alone governance goal, and possibly also a goal on peaceful and stable societies, while also mainstreaming good governance across the other goals”.
A parallelism of the five pillars (5P) of the 2030 Agenda (People, Planet, Prosperity, Peace, Partnership) may be drawn with the four pillars of the ISD (Social inclusion, Economic development, Environmental protection and Governance), called here four dimensions (4D) to differentiate them from the 5P, since both are holistic approaches to the ISD with similar elements. Tremblay et al. (Citation2020) pointed out that many organizations, countries and authors diverge in how they classify the SDGs across the five pillars. We follow the Organization for Economic Cooperation and Development, OECD (Citation2017) proposal to group the goals into the 5P, used in their “Measuring distance to the SDG Targets” reports since 2017.
We regard the Peace and Partnership pillars as the Governance one and the relations between goals, pillars and dimensions proposed are:
• Social dimension (People): SDGs 1, 2, 3, 4, 5
• Economic dimension (Prosperity): SDGs 7, 8, 9, 10, 11
• Environmental dimension (Planet): SDGs 6, 12, 13, 14, 15
• Governance dimension (Peace and Partnership): SDGs 16, 17
In fact, this idea is not new in the real political field of action: for example, in its 2022 report of the alignment of the public budget with the SDGs, the Spanish Government uses four dimensions, and the “institutional dimension” consists of Goals 16 and 17. It can be seen in its report on the alignment of the 2022 Draft State Budget with Agenda 2030 Sustainable Development Goals (Gobierno de España Citation2022),
The integrated character of the sustainable development implies not only the addition of Governance as the fourth pillar, but also the consideration of the interrelations among them. Balance is a key factor in sustainable development since an imbalanced development makes the country more vulnerable and less sustainable. A country with high economic performance, but a low environmental outcome, cannot be considered sustainable and, on the other hand, neither can be a developing country that has a good environmental performance and low social inclusion, economic growth, and governance.
In the conclusions report of the 2017 High-Level Political Forum (High-level political forum, HLPF Citation2017) they established the necessity of “balancing the pillars” of sustainable development to assure the achievement of the 2030 Agenda objectives and “leave no one behind”.
The identification of interactions between the various SDG targets, and among them and the 5P, is a vast challenge and a very important issue. Different authors have identified, mapped, or characterized the interactions with different methodologies and approaches (cross impact analysis, multicriteria analysis, target- target interaction, policy-policy interactions, network analysis, qualitative scenario analysis, spatial maps, etc.).
Bennich et al. (Citation2020, p. 1), in their overview of the literature on SDG interactions, based on a sample of 70 peer-reviewed articles, found that “few studies consider actor interactions, account for geographic spillovers, analyze SDG indicator interactions, employ participatory methods, or take a whole-systems approach to the 2030 Agenda”. Therefore, they emphasized the importance of studying the implementation of the Agenda and the role of the stakeholders.
2.2. Multicriteria methods to measure the ISD
Given the complexity not only of the concept but also of its application, the scientific literature has been very prolific proposing multicriteria methods to measure the performance of the ISD (Bell and Morse Citation2012; Neuman and Churchill Citation2015), and, from 2015, to establish the results of the 2030 Agenda itself (Costanza et al. Citation2016; Bali Swain and Yang-Wallentin Citation2020). Anyway, it requires tackling multidimensional concepts that need multicriteria tracing and evaluating tools and methods, and that is the reason why these are the ones more employed, despite the criticism they have aroused (Mair et al. Citation2018).
El Gibari et al. (Citation2019) and Greco et al. (Citation2018) review the scientific literature on multicriteria methods and highlight the importance of the normalization and the aggregation phases in the construction of a synthetic index. In the aggregation phase, El Gibari et al. (Citation2019) distinguish between totally compensatory aggregation (using, for example, a weighted sum), partially compensatory aggregation (like the geometric mean) and not compensatory aggregation. Regarding the normalization, it can be carried out in many ways. Pomerol and Barba-Romero (Citation2012) compare four normalization procedures and analyse their characteristics. They point out that, even if in all of them the ordinality is fully respected, depending on the chosen approach, it can lead to normalized values that lose some other features, such as the proportionality of the resulting data, or present higher or lower concentration than the original data, etc. Ruiz et al. (Citation2011), (Citation2020) proposed a normalization process based in collaboration with experts. They used intermediate values, considered reference values for the indicators or thresholds: one below which the indicator’s value would be considered in a non-acceptable level and another one above which the indicator would be considered on good lead. Using those thresholds, the normalization consisted of piecewise linear transformations. This way, in a single process the values of the indicators were homogenized, including, at the same time, the opinion of the experts.
In this paper we propose the use of a synthetic index that incorporates the opinion of international experts and their knowledge of the sustainability thresholds of indicators, collected in the SDG Dashboard (Sachs et al. Citation2020, p. 93), using the Multiple Reference Point based Weak and Strong Composite Indicators (MRP-WSCI) (Ruiz et al. Citation2020). The Multiple Reference Point approach has been applied and tested in scientific papers in different fields, such as Tourism (Jurado et al. Citation2012), Finance (Cabello et al. Citation2014), University Performance (El Gibari et al. Citation2018, Citation2021), Circular Economy (Garcia-Bernabeu et al. Citation2020), Landscape Fragmentation (De Montis et al. Citation2020), Environmental Sustainability (Ruiz et al. Citation2011), among others.
The resulting normalization is more complex than the one proposed in the SDG index, but this complexity is useful to translate into numbers something that the Bertelsmann Foundation pursues through the dashboard, unifying the quantitative approach (SDG index) with the qualitative one (The traffic light of the dashboard).
2.3. The SDG index and dashboard
The United Nation’s Inter-institutional and Experts Group Meeting (IEGM) has established a group of 232 indicators to assist the follow-up of the 169 targets of the 2030 Agenda and presents an annual report of the evolution of these indicators for each country. These reports are fed by the statistics published by the countries through their national offices. The information is treated and analysed by the High-level Political Forum of the UN, which dispenses an annual report on the world advancements in each SDG and the possibility of reaching or not the targets pursued at a global scale (UN Citation2020). Nevertheless, the excess of information has often little use in the public and private managers’ decision making. It is much easier to resort to the synthetic or composite indexes, which summarize, simplify, and visualize the information.
That is the reason why, since 2016, the annual reports published by the SDSN and Bertelsmann Foundation, endorsed by the United Nations, provide a composite index, the global SDG Index, which combines the official indicators into a single measure. We based our research in the 2020 SDG index report (Sachs et al. Citation2020), which comprises 85 indicators (globally) and 30 additional indicators (for OECD countries), using all of them to study the case of the OECD countries in our analysis.
They establish rankings of countries based on their accomplishment of the 2030 Agenda, reached from the SDG Index (Lafortune et al. Citation2018). These Reports allow not only to value the advances of each country or territory (there are also regional and urban reports), but to establish comparisons among them all (Lynch et al. Citation2019; SDSN & IEEP Citation2020).
To facilitate even more the decision making in a graphic and intuitive way, they deliver a dashboard that expresses through colours the position of the countries in each SDG, integrating the opinion of the experts on the red and green thresholds for each indicator (Sachs et al. Citation2020; pg.93). The global SDG dashboards for each SDG is based on the colours of the two indicators on which a country performed worst. The authors specify that to score green for a goal, both of the two worst performing indicators have to be green – otherwise the goal would be rated yellow. Similarly, a red score is assigned only if both indicators score red. These colours are obtained through consultation with experts on the minimum threshold (red, in the case of an indicator of the kind “the more the better”) and the maximum threshold (green) for every indicator. This work, carried out by the experts, which is of vital importance to ground the indicators to the contexts of reality, is not included in the construction of the SDG Index, losing the opportunity of knowing if the results fall within the limits of sustainability.
Our method benefits from this information and generates a new SDG Index that includes the opinion of the experts (ESDG index) and, so, qualifies the achievements performed on the base of these sustainability thresholds.
2.4. The balance index
We maintain that the 2030 Agenda Reports should not only incorporate the opinion of the experts in the construction of the index itself, but also, they should be a useful tool to analyse the balance among the four dimensions of the ISD (Biggeri et al. Citation2019). The European Commission itself, in the new Territorial 2030 Agenda establishes as a priority the achievement of a more balanced territorial development, that allows reaching a fairer in its growth Europe. In this sense, it is not enough to establish a ranking of countries based on the degree of attainment of the 17 SDG, it should also analyse its capacity to maintain a permanent and balanced interaction among all the dimensions of the ISD, so that it is a territorial integrated development (Van Soest et al. Citation2019).
To that end, we propose to draw upon the studies of regional economy, specifically the denominated concentration indexes. They have been used especially in the quantitative analysis of the industrial economy, although its use has been extended from the social sciences to the political sciences, the economy of sports, finance, or the economy of health (Triguero Ruiz and Ávila-Cano Citation2019). Their objective is to measure the degree of dominance that some elements have over others in a system. In our analysis, this index will be named Balance Index and will allow each country to determine if there is concentration of the development in any of the four dimensions of the ISD. The ones in better position will be those countries in which that concentration does not exist.
Although unbalanced scores may be circumstantially acceptable, in the long term, they must be corrected, since the concept of sustainable development, is, by definition, multidimensional and global, which implicitly presupposes an equilibrium among its components.
Obviously, there are conflicts among the different goals and targets, and there are many interlinkages between them (trade-offs and synergies). Bennich et al. (Citation2020) studied the literature specialized in these interactions and recognized that “integrated and coherent policies can optimize resource use and generate more sustainable outcomes, by avoiding counteracting objectives and incentives”.
In fact, it is precisely policy coherence that will allow using the interconnectedness and synergies of the SDGs to meet multiple goals in one. Particularly, connecting different goals has the potential of bringing out if the progress towards one goal may also pave the way for another. It could be the case that these synergies involve more than one dimension (Social, Economic, Environmental, and Governance). Sometimes the fulfilment of one dimension may compromise the achievement of another, so it will be desirable to track down and monitor these trade-offs.
3. Methodology and materials
For the application of the method, we have used the dataset of 2020 Sustainable Development Report – SDG Index and we have selected the 36 OECD countries as a case study, since they have a level of accomplishment of the 2030 Agenda very homogeneous regarding their high position in the general ranking of countries of the SDG Index. Most of the countries in the top 20 positions are OECD countries, although almost all of them have some “red score” in the Dashboard or even do not seem to advance when analysing the trends in some of the goals. On the other hand, the OECD countries have good data and clear metrics, and in these reports, they incorporate a greater number of indicators than the other countries, so it seems interesting focusing on them. In fact, in the 2020 version, these countries have 30 indicators more than the others (85 indicators), that we have integrated in our research.
The method that we propose to carry out these improvements has been arranged in four steps, as can be seen in . In a first stage, the opinion of the experts is integrated, modifying the normalization and aggregation methods to build the SDG Index with the Multiple Reference Point based Weak and Strong Composite Indicator method (MRP-WSCI). The ESDG index is obtained, unifying this way the two tools (SDG Index and Dashboard) that the Bertelsmann Foundation proposes in only one (ESDG Index). In the second phase, the aggregations and, implicitly, the weights, are changed, grouping them into the four dimensions of the ISD, obtaining the 4D-ESDG Index. In a third step, the global equilibrium of sustainability is analysed with a new Balance Index (B), obtaining in the final step a model of four possible positions for a balanced achievement of the 2030 Agenda, inspiring the policies and decision-making.
Figure 1. Methodology Scheme. Source: Own elaboration.
3.1. The SDG Index of SDSN and Bertelsmann Foundation method
The SDG Index of SDSN and Bertelsmann Foundation considers a set of J units (countries) to be evaluated based on a set of indicators, which are grouped into several dimensions.
Let nd be the number of dimensions in which the indicators are clustered (in the SDG Index these dimensions are the 17 goals). For each dimension k, k ∈{1, 2, …, nd}, let pk be the number of indicators of that dimension, and the value of indicator i, i = 1, 2, …, pk, of dimension k for country j, j ∈ J. These indicators will either be of kind “the more, the better” or “the less, the better”.
The construction of the SDG index follows a three-step process (Lafortune et al. Citation2018):
Selection of the worst (
and the best value
Normalization of the values through the following formula (1):
(3) Aggregation of the indicators for each dimension. This is accomplished with the arithmetic mean of the values in the same dimension, and, to obtain the Global Index (SDG), the use of the arithmetic means of the results of the 17 Goals. In order to use the arithmetic mean, perfect substitutability across dimensions is required, since it allows the compensation of “bad” and “good” values for different indicators. Nevertheless, after considering other aggregation processes (geometric average, and Leontief function), in the UN report they use the arithmetic mean “because each SDG describes a set of broadly complementary policy priorities (despite some notable exceptions)” (Lafortune et al. Citation2018, p. 24). They justified the use of equal weighting at the goal level in the SDG Index with the fact that all SDGs are considered as having equal importance as part of the 2030 Agenda. At the indicator level, they choose equal weighting over mathematical weighting, expert weighting or flexible weighting. “However, equal weights do not mean “no weights” (OECD and JRC Citation2008).
The mathematical expression of the value for dimension k for country j is (2):
The value of the Index for country j ∈Jis (3):
Along with the SDG index, the Bertelsmann Foundation presents the Dashboard, a “traffic light” table, with the aim of revealing the imbalances that may be hidden behind the arithmetic mean. As they remark in the report: “averaging across all indicators for an SDG might hide areas of policy concern if a country performs well on most indicators but faces serious shortfalls on one or two metrics within the same SDG”. (Lafortune et al., Citation2018, p. 9).
3.2. Our method to improve the SDG Index
Ruiz et al. (Citation2020) suggest an adaptation of the multicriteria method of double reference point to build indicators, named the Multiple Reference Point based Weak and Strong Composite Indicator method (MRP-WSCI).
The method is characterized by increasing the flexibility, both in the normalization and aggregation processes of simple indicators. Regarding the normalization, in their first proposal Ruiz et al. (Citation2011) split the range of the indicator in three subintervals, fixing a value rki, (below which it is considered that the indicator’s value is in a non-acceptable level) and a value aki (considered as an advisable or desirable level), either set by experts or chosen from statistical or mathematical techniques. In Ruiz et al. (Citation2020) they propose the MRP-WSCI method, allowing the decision-maker to choose the number of subintervals and the scale of transformation for the simple indicators.
Step 1: Integration of decision- makers in the normalization process: The Multiple Reference Point (MRP-WSCI).
We propose the elaboration of the ESDG index with the MRP-WSCI method. In the normalization phase we use the thresholds established in the Dashboard of the SDSN by experts and statistical techniques, to establish rki and aki. The value rki, is a threshold below which it is considered that the indicator’s value is in a non-acceptable level (it is the upper band of the red interval). The value aki is the lower band of the green interval: it is an advisable or desirable level for the indicator, above which the indicator can be considered on good track.
Four intervals are derived of the values and
, with
≤ rki ≤ aki ≤
, if the indicator is of the kind “the more, the better” and
≤ rki ≤ aki ≤
if the indicator is of the kind “the less, the better”. Once these thresholds are fixed, the midpoint mki, between rki and aki is calculated
, and the colours red, orange, yellow and green are assigned to the intervals defined.
The value of each SDG index is turned into a number between 0 and 100 through a piecewise linear function corresponding to each interval. The formulation of this achievement function, for an indicator of the type “the more, the better” is as follows (4):
For indicators of the kind “the less, the better”, the achievement function will be (5):
where .
For an indicator of the type “the more, the better”, a value of the indicator lower than is transformed into a value between 0 and 25, a value between
and
is transformed into a value between 25 and 75, fixing the middle point in 50. Finally, a value greater than
, will result in a new value between 75 and 100. ) displays the achievement function for this kind of indicator, and for indicators of the type “the less, the better”.
Figure 2. Individual Achievement Functions. Source: Own elaboration.
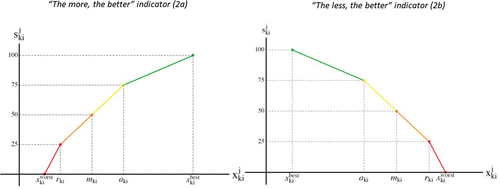
In our view, introducing the experts’ opinion (ESDG index) enriches the outcome, since the normalization allows seeing if each indicator has values in the red, orange, yellow or red interval according to the consensual values for the thresholds published in the report.
Our proposal provides a qualified normalization. After this normalization we not only reach a homogeneousness in the measure, but it may also be considered a “traffic light”: if the normalized value is under 25, the original indicator is in the red interval. The same can be said of the other intervals: a value over 75 indicates that the indicator is in the green (desirable) interval.
The novelty of our approach here is to use all the boundaries or thresholds, in the construction of the global SDG index itself, with the aid of the Multiple Reference Point proposed in Ruiz et al. (Citation2011), (Citation2020). In our proposal, we incorporate the “traffic light” in the normalization process, using the thresholds provided by the experts for each indicator, instead of those corresponding to the two worst indicators for each goal. This facilitates the interpretation since it is using all the information provided by the experts.
Step 2: Aggregation in the ESDG Index, calculated with the arithmetic mean, and consideration of the 4 SD dimensions’ level: 4D-ESDG.
Continuing with the proposal of Lafortune and SDSN, for each country and Goal (17 dimensions), the synthetic indicator is calculated through the arithmetic mean, attaining what in our method we denote ESDG. The value of the Experts SDG Index for country j ∈J is (6):
We will consider the incorporation of the four dimensions of the ISD in the computation of the SDG, interchanging the 17 Goals for the four dimensions of the ISD, going from the ESDG to the 4D- ESDG. As Tremblay et al. (Citation2020) explain, there are many ways to consider the trade-off and synergies among SDG, but we maintained the approach of Organization for Economic Cooperation and Development, OECD (Citation2017) and UNDP (United Nations Development Programme) (Citation2014), when they proposed that “the ideal solution would lie in agreeing on a stand-alone governance goal, and possibly also a goal on peaceful and stable societies, while also mainstreaming good governance across the other goals”.
Since each one of the Economic, Social, and Environmental dimensions include five goals, while the Governance consists of only two goals, there is a decompensation of the different dimensions (see section 2.1.), which is highlighted by numerous authors (Jacquier Citation2005; Meuleman and Niestroy Citation2015; Schoon and Cox Citation2018; Tremblay et al. Citation2020; García-Peña et al. Citation2021). The 4D-ESDG index equals their weights grouping the goals in dimensions and using the arithmetic mean to aggregate them. This re-weighting enhances the Governance dimension.
The Expert SDG index and the 4D Expert SDG index are complementary measures, both enriched with the experts’ opinions. In one case we have a global measure, and in the other, an alternative measure reweighting the different dimensions of the ISD. At a technical level, the two measures could be provided, and both shed light over the situation of the country. The multidimensional nature of the sustainability concept makes these groupings appropriate to supply a holistic measure of the situation of each country.
Step 3: Evaluate the balance of the 4D-ESDG with the Herfindahl-Hirschman Index (HHI): The Balance index
This Step incorporates the importance of the balance among the four dimensions of the ISD in the composite index. The reach of a given value for a development index must be accompanied by a measure of the equilibrium among the four dimensions of the ISD A low value of the Balance Index for a country warns that the accomplishment index may be disguising a possible compensation in some of the dimensions in which it is not having a good performance.
To this end, we propose the use of the Herfindahl-Hirschman (HHI) concentration index, which has its origin in the Industrial Organization Theory and is defined as the addition of the squared share of each firm in the market, allowing the study of the degree of competitiveness of the market (Rhoades Citation1993).
Although it is not the only index that may be used to study the concentration, it is, according to Triguero Ruiz and Ávila-Cano (Citation2019, p. 21): “The one that has reached the greater consensus and preeminence in the literature regarding the extent of its use”, pointing out that “the European Commission and the Commerce Federal Commission or the Justice Department of the U.S. use it for the follow-up and control of certain operations, and in particular, company mergers”.
This index is also used in the studies associated with the regional economy, allowing to determine the degree of concentration that a territory has among its sectors (Rastvortseva Citation2014; Simonen et al. Citation2015; Frick and Rodríguez-Pose Citation2018). Other applications of this index are referred to the financial market, including banking, insurance or capital market (Jouida Citation2018), as well as the spatial or geographic concentration and diverse analyses in health economy, sports economy, etc. (Michie and Oughton Citation2004). However, to our best knowledge, to date it has not been applied to the Sustainable Development studies to analyse the balance of the different dimensions that it comprises.
The index is calculated with the formula (7):
In our proposal, is the value for each of the four dimensions k of country j of the 4D-ESDG, and
is the value of the 4D-ESGD for country j. The range of values of the
are bounded between 1/nd and 1. A value equal to 1 is indicative of a country that is completely specialized in one dimension and a value close to 1/nd (that is, 1/4 in our case) means that the achievements of the country are distributed equally among the four dimensions.
From this concentration index we derive what we will denominate “Balance index” (), through the following transformation (8):
This alteration makes it possible to maintain the same ESDG scale, with values between 0 and 100. It also to invert its interpretation, so that a value close to 0 indicates that country j is specializing in one of the four dimensions (i.e. it has a low balance), while a value close to 100 indicates that there is a more or less equal or balanced proportion among the four dimensions, which would be the ideal position. Thus, as in the Global Index, values close to 100 indicate better results.
Obtaining this balance index provides additional information that qualifies the information in the achievement index (4D-ESDG), thus helping decision-makers to know whether the degree of compliance they have obtained in the global index also corresponds to sustainable and integrated development, so that they can reorient their policies.
Step 4: Build a matrix for a balanced achievement of the 2030 Agenda.
Finally, countries need to have a balance or integration between the policies and resources they allocate to economic, social, environmental and governance aspects. The concentration index of the four dimensions shows that countries with a high overall index of the SDGs are not always those with the most integrated development. Given the link between the concepts of sustainability and ecosystem resilience, one could establish, following the proposals of Briguglio et al. (Citation2009) for vulnerability and resilience index, a matrix of four scenarios to classify countries based on the two indexes (achievement and balance) as shown in . Given that both indexes have been constructed from 0 to 100, with 100 being the best value, the countries located higher and to the right are those that could be considered as having ISD, while those on the lower left are those that are farthest from achieving it As for those with high scores but low balance, they are considered to be achieving SD but not in a sufficiently balanced way, so they can improve the comprehensiveness of their policies and solutions. Those with balance but poor results (top left) are countries that are concerned about the comprehensiveness of their policies, but are not devoting sufficient resources and efforts and should look for elements that accelerate the achievement of the SDGs.
Figure 3. The four scenarios of a balance achievement of 2030 Agenda. Source: Own elaboration.
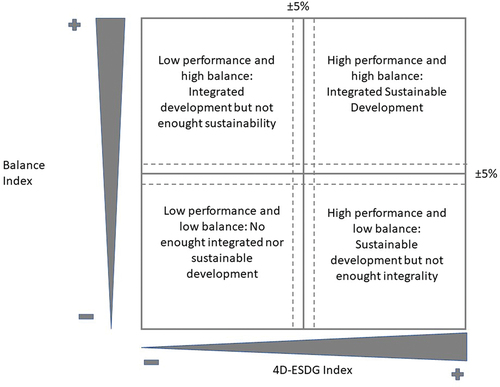
The average of each index is determined and a margin of ±5% around it is established in order to consider countries that are “bounderlines”.
4. Results
This section presents the main results of the application of the described methodology to improve the SDG Index of the Bertelsmann Foundation and SDSN, applying it to the 2020 data. The green and red thresholds of the Dashboard established by experts in the report were considered the references for the and
values of our ESDG. In addition, the aggregation of dimensions described in Step 2 is used to build our 4D-ESDG (17 dimensions of SDG transformed into 4 dimensions of SD).
Columns 3 and 4 of present the scores and rank positions of the 17D-SDG Index and the 17D-ESDG Index. In this table, the countries are ordered based on the results of the Balance Index (from highest to lowest). On a scale from 0 to 100, the value of the 17D-SDG Index for OECD countries varies from 70 to 85. The top countries are Sweden (SWE), Denmark (DNK), Finland (FIN), France (FRA), Germany (DEU) and Norway (NOR), with high levels of GDP and per capita income, while those with lower SDG Index levels are Turkey (TUR), Mexico (MEX), Luxembourg (LUX), Greece (GRC) or Israel (ISR), which have generally lower values for these economic indicators.
Table 1. Comparing the Expert Index for 17 dimensions, the Expert Index for 4 dimensions, the Balance Index of the four dimensions () and the Expert Indexes for each dimension: Environmental Index, Social Index, Economic index and Governance Index, ordered by the Balance Index of the four dimensions (
).
Integration of decision- makers in the normalization process. Contributions of the 17D-ESDG
When expert opinion is incorporated into the construction of the 17D-SDG Index through the MRP-WSCI methodology and the 17D-ESDG Index is created, it is observed a general reduction in the index values of all countries and an increase in their variation range. Note that the original index took values between 70 and 85, and the new one goes from 50 to 80.
All countries have higher values in achieving the Agenda with the 17D-SDG Index (), confirming that the 17D-ESDG is making it more difficult to achieve the sustainability goals. In other words, by incorporating the experts’ knowledge of the targets into the calculation of the index, the cautiousness pursued by the Dashboard in the Bertelsmann Foundation and SDSN report, which selected the two worst colours for each target to assign a final colour, is integrated into the index. In this way, it can be stated that the ESDG integrates the achievement index with the tool they created to qualify those values, which was the Dashboard. To analyse the effects of the change introduced in more detail, the variations in the position of the countries of one index with respect to the other are also examined, that is, the alteration in the ordinal position of each of the countries in the final ranking is assessed. There is a certain grouping of countries based on their results, with extreme values concentrated around the bisector.
Regarding the comparison of the positions () in both rankings, the top three positions are held by the Nordic countries (Sweden (SWE), Denmark (DNK) and Finland (FIN)), and the bottom positions are also occupied by almost the same countries (Turkey (TUR), Mexico (MEX), Greece (GRC), Israel (ISR), Luxembourg (LUX) and Australia (AUS)). The experts’ opinion has altered more significantly the countries in the centre of the distribution. We also calculated, in addition to the graph, the Spearman ordinal correlation coefficient. 17D-SDG and 17D-ESDG indexes exhibit a strong positive relationship with a value of 0.9119.
Figure 4. Comparison of original and Experts Indexes with 17 Dimensions (rank). Source: Own elaboration.
A deeper analysis reveals that the changes in the ranking are up or down by only two or three places. However, some countries stand out, with Iceland (ISL) rising 14 places (although the value of the achievement index falls from 77.52 to 70.56), Hungary (HUN) rising 10 places (achievement falls from 77.34 to 68.19) and others rising 5 places, such as Slovenia (SVN), Poland (POL) and Slovak Republic (SVK), although they also fall in the value of achievement. Iceland (ISL) has numerous indicators of SDG 5 and 6 (gender equality and water) that are within the range set by the experts, but the rest of the SDGs have indicators outside the range, both positive and negative, so there is some compensation. Hungary (HUN), on the other hand, has indicators within the thresholds spread across all SDGs. The rest of the countries that have risen 5 or 6 places, such as Slovenia (SVN), Poland (POL), Slovak Republic, (SVK) have a large part of the indicators of SDGs 3, 4, 5, 11 and 12 (health, education, gender equality, sustainable cities, and responsible production) within the thresholds set by the experts. Moreover, France (FRA), Ireland (IRL), Spain (ESP), and Latvia (LVA), up 4 places, have a large part of their indicators within the and
thresholds set by the experts. Other countries, such as Korea (KOR) (7 places), Japan (JPN) the United Kingdom (GBR), Germany (DEU) and Chile (CHL) (6 places each), dropped significantly. All these countries have quite a few indicators that are outside the range established by the experts for the
and
limits, so the 17D-ESDG penalizes them, and they lose positions in the ranking of the composite index with respect to the 17D-SDG. In some cases, again there seems to be some trade-offs between indicators that exceed and those that fall below the experts’ sustainability threshold.
The 4 four dimensions of ISD (4D-ESDG) and the balance index (B)
In this phase, it is verified that the calculation of the ESDG for 4 Dimensions (4D-ESDG index) versus the 17 Dimensions (17D-SDG Index) does not substantially alter the results of the achievement of the countries, but simplifies the decision-making process and, in addition, corrects the lower weight of the governance indicators in the final index. To this end, we first assess the changes that occur in the ESDG Index when the 17D are reduced to 4D, firstly through Spearman’s correlation and secondly through the analysis of the change in the order of the countries in the final ranking.
The Spearman correlation value in this case is 0.9672, close to unity and higher than the previous case (SDG Index and ESDG Index with 17D). The reduction in the number of dimensions has made, apparently, little difference in results, but for public policy makers, the aggregation of the 17D in 4D makes it much easier to analyse information and assign equitably the resources to achieve the ISD. It should be noted that the creation of the 4D does not imply a reduction of the information of the 17 SDGs, but rather the creation of a higher level of aggregation of the information that allows a clearer visualization of the dimensions of the ISD on which to act.
and columns 4 and 5 of reveal that there is a better score for countries in general with the 4D-ESDG analysis with some exceptions. The analysis of the values shows some countries with good scores in 17D-ESDG are linked to worse governance indicators, such as Netherlands (NLD), Switzerland (CHE), Hungary (HUN) or Latvia (LVA). It is noteworthy that among these countries some have an established and advanced democracy, which has already been highlighted by some authors (Lamichhane et al. Citation2021). However, it should be considered that the indicators linked to the governance dimension (SDGs 16 and 17) not only incorporate concepts of good governance or solid institutions, but also the way of managing public affairs, such as taxes and fees on companies, tax havens, financial secrets or even arms sales. Countries with more liberal policies tend to be outside the thresholds established for the world average by experts in these matters. On the other hand, shows that there is a greater concentration of values around the central axis.
Figure 5. Comparison of the Experts Indexes with 17 and 4 Dimensions (rank). Source: Own elaboration.
Figure 6. Comparison of ranks with the original methodology (17D SDG) and our proposal (4D ESDG). Source: Own elaboration.
Comparing columns 3 and 5 of and , we observe that there is no change in the ranks of the top countries, Sweden (SWE) and Denmark (DNK). Other Nordic countries such as Finland (FIN) and Norway (NOR) present opposite behaviour: while the first one is better off in the 17D-SDG ranking, the second one has a higher position in the 4D-ESDG. At the bottom of the rankings, the changes in positions are small, just in one position. See, for example, Turkey (TUR) and Mexico (MEX). In the middle of the ranking, again Iceland (ISL) is very noticeable for rising clearly (15 positions) in the ranking due to the experts’ opinions.
The next step is to qualify these performance rankings by analysing whether the development that is taking place maintains a certain balance between all the dimensions of the SD. To this end, the balance between dimensions was studied using the Balance Index (), which is based on the Herfindahl-Hirschman concentration index. This index is used to determine whether there is a concentration of weight in any of the dimensions. The lower the value, the greater the concentration of weight in a dimension, i.e. the less the balance.
is ordered based on the results of the balance index (from highest to lowest) and shows the 4D-ESDG Index achievement values, as well as the value of the different dimensions of the SD for all OECD countries (Environmental Index, Social Index, Economic Index and Governance Index). It can be observed that the most balanced countries (higher ) do not coincide with those with better values in the 4D-ESDG Index. On the contrary, the Nordic countries that were in the first positions of the 4D-ESDG Index have lower values in the balance index (Denmark (DNK), Finland (FIN), Norway (NOR) or Sweden (SWE)). It can be observed that in these countries the environmental dimension (Environmental Index) is the one with a considerably lower value compared to the other dimensions.
Therefore, the balance index is proposed to qualify the achievement index of the 2030 Agenda (ESDG). In this way, we emphasize that in addition to reaching a high value in the achievement index, it is important to be doing so on the basis of ISD.
When comparing the rankings of both indexes (4D-ESDG and ), the countries that occupy the first and last positions in both indexes are not the same, as can be seen in . In contrast to the Nordic countries and Slovenia (SVN), which are the first in terms of achievement (4D-ESDG), Slovak Republic (SVK), Estonia (EST), Czech Republic (CZE), Lithuania (LTU) and Poland (POL) stand out in the Balance Index. The case of Norway (NOR) is remarkable, with one of the top five positions in the 4D-ESDG Index, but also one of the last five positions in the Balance Index. The opposite case is Lithuania (LTU), which has one of the five best Balance Indexes, but one of the five worst levels of achievement of the 2030 Agenda.
Table 2. Comparing the five countries at higher and lower positions for the Experts index in four dimensions and the Balance Index.
The aforementioned cases lead to highlight that the Balance Index is only added as an element that qualifies the achievement of the Agenda and not the other way around. It is important to achieve a high level of compliance with the Agenda (4D-ESDG Index) and that this is reached with maximum efficiency and comprehensiveness in the policies and results obtained (), but not the other way around. ( details the ranks for each country for both indexes).
Table 3. Comparing the positions of the countries in rankings for the Experts index in four dimensions and the Balance Index, ordered by the rank.
The four scenarios of ISD
Finally, the four scenarios matrix for achieving the ISD of the 2030 Agenda are constructed based on these two indices indexes: the 4D-ESDG index and the Balance Index, thus determining the position of each of the OECD countries. As indicated, the cut-off axes are established on the average of the distributions of the indexes and thresholds of ±5% of the value are generated around them to gather countries that could be at the limit of each of the boundaries ().
Figure 7. Integrated Sustainable Development: Scenarios for the OECD countries (score). Note: dotted lines are the +-5% of the average for each index. Source: Own elaboration.
Thus, almost all countries are at high levels of achievement of the 2030 Agenda, as well as of balance between all its dimensions, although more details can be given on the type of development they are following. For example, in the case of the Nordic countries, which have in the SDSN ranking the best positions in the achievement index, our ranking shows that Sweden (SWE) and Finland (FIN) also have ISD with a balance between all its dimensions. Denmark (DNK) and Norway (NOR) need to strengthen the integrated nature of their policies and increase their efforts, especially in environmental aspects. On the other hand, Australia (AUS) and Luxembourg (LUX), together with Ireland (IRL) and Switzerland (CHE), need to improve both the achievement and the balance between the dimensions of their ISD policies, being positioned in the low achievement and the balance position. Nevertheless, Ireland (IRL) and Switzerland (CHE) are almost in the high performance of the Agenda, in the “boundaries” (inside the dotted lines).
Many countries are positioned in the “boundaries”, meaning that they are capable of easily changing the position if the ranking conditions change slightly (number of countries, values of the indicators or thresholds, etc.). The area of high balance and medium performance is the most populated. There are 8 countries that can be considered in the high or low performance if the average of the sample changes in any way. Only Mexico (MEX), Greece (GRC), Chile (CHL), Lithuania (LTU) and Latvia (LVA) are clearly in a high balance but not enough achievement of the ISD.
5. Discussion
The debate about the best way to measure SD dates to the early 1990s and the definition of the 2030 Agenda has reactivated the discussion on the most appropriate methods. The United Nation insists in the necessity of creating good national statistical systems to collect reliable data, as the principal problem to measure the performance of the SDGs and the key factor to improve the actual methodologies.
In any case, the use of composite indexes is one of the most widely used systems on an international scale and is accepted despite the problems derived from the simplification and aggregation of information that they entail. Our method starts from the use of the indexes already created to measure the achievement of the Agenda (Schmidt-Traub et al. Citation2017), therefore, the achievement of the ISD. Although other authors propose alternative methods and indexes (Allen et al. Citation2016), it seems to us that it is important to join in the same direction as the United Nations and international organizations that are supporting compliance with the 2030 Agenda.
The 2030 Agenda is a roadmap for countries and their leaders to achieve a SD in the next decade. Authors as Kanie et al. (Citation2019) defend that 2030 Agenda proposed the move from rule-based international governance to governance through goals. Countries must adopt measures that ensure their fulfilment of the specific goals (the 17 SDGs), understood as a mean to reach a better and more sustainable future for all.
The compliance with the 2030 Agenda is more relevant than ever before, with many countries presenting their Voluntary National Reports (VNR) and their public budgets supplemented with reports of their alignment with the SDGs. Mulholland and Berger (Citation2019) in their publication “Budgeting for the SDGs in Europe: Experiences, Challenges and Needs” emphasized that this exercise improves overall policy coherence, reveals the progress of a country towards the sustainable development and helps assess the government’s performance. As Carter said “sustainable development does not just `happen’ in an automatic or preordained way. It needs to be carefully discussed, openly debated, and possibly even centrally planned” (Carter Citation2007, page 224).
The 2030 Agenda requires integrated approaches that view development through a holistic lens, taking account of the causal relationships, the synergies and trade-offs produced among the social, economic, environmental and governance dimensions in a comprehensive manner. Many authors are proposing this kind of whole-systems approach, as Bennich et al. (Citation2020) or Tremblay et al. (Citation2020). They also consider the importance of expert’s opinions to fix the boundaries of territorial sustainability, as we exposed, and the improvement of quantitative and qualitative tools.
In this paper, we demonstrated the value and the capacity of the expert’s opinion to improve the index and to be more restrictive than the global standards. In future research, we are interested in introducing sensitive analysis to study the existence of significant variations of performance when the thresholds values change based on the experts’ territorial proposals. Moreover, it could be possible to create many different indexes based on the compensation or not between SDGs, and their interlinkages, with variations of the aggregation procedure, as in Biggeri et al. (Citation2019).
Because of the global nature of SD, when formulating policies, it is important to consider the potential effects that actions in a country may have on other states, particularly developing countries.
Since 2017, the SDG Index Report recognized that the actual countries growth is creating positive and negative externalities in other countries, and it has introduced a new index to consider this. In the 2020 edition, the authors recognized that high-income countries perform poorly on indicators to measure these externalities, particularly in relation to sustainable consumption and production or the protection of biodiversity, for which most high-income countries are stagnating. For this reason, the relation between the unbalanced development of a country and its growth impacts on other countries is a line of research that we are exploring.
In any case, the performance of the Agenda requires the compromise of a policy integration that carries out real diagnoses that identify the challenges and the objectives to be pursued. As some authors point out, the selection of SDG by the countries in the process of localization is in many cases serving to legitimize political decisions prior to committing to their fulfilment (Spaiser et al. Citation2017). In fact, as Jain and Jain (Citation2020) highlights, measurements are being built in an unsustainable way, “the policy perspective requires a balanced and harmonious tuning of the pillars”, because now the international reports reflect that the countries with the largest ecological footprint are those that achieve the best positions in complying with the Agenda (Hickel Citation2019).
Our method proposes to maintain a permanent balance between all the dimensions of the ISD to avoid the cherry-picking and the manipulation of these priorities (Forestier and Kim Citation2020) with the use of the HHI concentration index. This selection also could be discussed, but it is a common tool in Regional Science and many international organizations (World Bank, European Union, OECD) that use these indexes to study the effects of their policies (Masciandaro and Quintyn Citation2009; Brezina et al. Citation2016).
Our proposal is to measure the ISD, so we apply the Balance Index at dimensions level, looking for the equilibrium among its four basic dimensions. Of course, the use of the Balance Index can be generalized to any level of detail. The analyst may be interested in studying the inner balance among the indicators of a goal or a dimension. A priori, it makes sense to think that inner imbalances may affect the overall balance. Although it is beyond the purpose of this research, it is a further research line.
Finally, the visualization of the country’s position in a matrix of performance and balance could be also defined as a double-ranking or a traffic light tool, as SDSN and Bertelsmann Foundation. Nevertheless, we consider that this kind of figure reflects the multidimensional condition of ISD and the fact of its fuzzy definition, at the same time showing the comparative position among countries and the path to improve their policy integration (Briguglio et al. Citation2009).
6. Conclusions
The 2030 Agenda boosts an integrated sustainable development (ISD) in the broadest sense of the term, where the consideration of its multidimensional character is critical to achieve it.
The current methods to evaluate the performance of the 2030 Agenda are committed to use multicriteria analysis to solve the difficulties of integrating all these aspects, but sometimes they forget the balance between the Economic, Social, Environmental and Governance dimensions of ISD or underestimate the importance of expert’s opinion, using it only to design complementary tools.
Despite that, the use of complex indexes is the most popular tool to evaluate the ISD and the performance of the 2030 Agenda. The SDG Index, developed by SDSN and the Bertelsmann Foundation, is a very recognized tool to measure the Agenda and it is evolving to enhance the quality of the results. This paper proposes some improvements to its method and the visualization of the results. The interest is to overcome the lack of qualitative information in the design of composite indexes and facilitate a balanced decision-making by public and private agents.
The 4D-ESDG index is a very innovative combination of quantitative and qualitative indicators to measure the results of the Agenda. We consider the experts’ knowledge to establish close-fitting sustainable thresholds for each indicator and to evaluate the performance of the 2030 Agenda, using the MRP-WSI method for normalizing and aggregating the indicators of the SDG Index and integrating the four dimensions of sustainability. This new index links ultimately the Agenda with the theoretical framework of ISD and facilitates the political decisions.
We propose to complete the SDG index with the Balance Index (B). This new index indicates whether each country is growing in a balanced way among the four dimensions of ISD or is instead concentrating on some of them. In fact, many countries considered in the top of the rankings are failing in our analysis in maintaining a balanced development, especially in the environmental dimension.
The use of the performance index in combination with the balance index designs a matrix where the position of each country (territories) suggests the orientation of their policies through the ISD in a global sense or in a balanced way (the objective of ISD). The graphical representation of the final matrix in which each country can identify its position given the two indexes (performance and balance) gives also a “good practice line” which is moving towards the first quadrant (high performance and balance: integrated sustainable development). It will allow the stakeholders to orientate their policies depending on the position they occupy. Each quadrant could be easily enriched with a mix of integrated policies, to guide decision-making by public and private agents, facilitating the monitoring, reporting and evaluation of the 2030 Agenda.
For this reason, the Balance Index is a necessary complement to the 4D- ESDG Index. It is an objective and quantitative measure of the equilibrium among those dimensions. The scenarios’ matrix, with an easy interpretation, overcomes the possible complexity arising from the analysis of two indicators.
Clearly, the complexity of sustainability is not completely represented with two complex indexes built with the indicators of 2030 Agenda, but as the metaphor of Lyytimäki et al. (Citation2020, p. 1536) exposed: “the SDGs should be understood as the most sophisticated and commonly agreed lighthouse system heretofore. For those on the shore, unsure about whether to embark on a journey towards sustainability, the beams are clearer than ever before”.
In accordance with Taylor & Francis policy and our ethical obligation as researchers, we are reporting that we don’t have a financial and/or business interests in a company that may be affected by the research reported in the enclosed paper.
Supplemental Material
Download MS Word (14.7 KB)Data availability statement
The data that support the findings of this study are available from the corresponding author, MCGP, upon reasonable request.
Disclosure statement
No potential conflict of interest was reported by the author(s).
Supplementary material
Supplemental data for this article can be accessed online at https://doi.org/10.1080/1943815X.2022.2143530
References
- Adams CA (2017). The sustainable development goals, integrated thinking and the integrated report. ICAS and Integrated Report, IR.
- Allen C, Metternicht G, Wiedmann T. 2016. National pathways to the Sustainable Development Goals (SDGs): a comparative review of scenario modelling tools. Environ Sci Policy. 66:199–207. doi:10.1016/j.envsci.2016.09.008.
- Bali Swain R, Yang-Wallentin F. 2020. Achieving sustainable development goals: predicaments and strategies. Int. J. Sustain. Dev. World Ecol. 27(2):96–106. doi:10.1080/13504509.2019.1692316.
- Bell S, Morse S. 2012. Sustainability indicators: measuring the immeasurable? London: Routledge.
- Bennich T, Weitz N, Carlsen H. 2020. Deciphering the scientific literature on SDG interactions: a review and reading guide. Sci. Total Environ 728:138405. doi:10.1016/j.scitotenv.2020.138405.
- Biermann F, Stevens C, Bernstein S, Gupta A, Kabiri N (2014). Integrating governance into the sustainable development goals (No. 3). UNU-IAS.
- Biggeri M, Clark DA, Ferrannini A, Mauro V. 2019. Tracking the SDGs in an ‘integrated’manner: a proposal for a new index to capture synergies and trade-offs between and within goals. World Dev. 122:628–647. doi:10.1016/j.worlddev.2019.05.022.
- Brezina I, Pekár J, Čičková Z, Reiff M. 2016. Herfindahl–Hirschman index level of concentration values modification and analysis of their change. Cent. Eur. J. Oper 24(1):49–72. doi:10.1007/s10100-014-0350-y.
- Briguglio L, Cordina G, Farrugia N, Vella S. 2009. Economic vulnerability and resilience: concepts and measurements. Oxf. Dev. Stud 37(3):229–247. doi:10.1080/13600810903089893.
- Cabello JM, Ruiz F, Pérez-Gladish B, Méndez-Rodríguez P. 2014. Synthetic indicators of mutual funds’ environmental responsibility: an application of the reference point method. Eur J Oper Res. 236(1):313–325. doi:10.1016/j.ejor.2013.11.031.
- Carter N. 2007. The Politics of the Environment. 2nd ed. Cambridge): Cambridge University Press.
- Costanza R, Daly L, Fioramonti L, Giovannini E, Kubiszewski I, Mortensen LF, Wilkinson R, Ragnarsdottir KV, De Vogli R, Wilkinson R. 2016. Modelling and measuring sustainable wellbeing in connection with the UN Sustainable Development Goals. Ecol. Econ 130:350–355. doi:10.1016/j.ecolecon.2016.07.009.
- De Montis A, Serra V, Ganciu A, Ledda A. 2020. Assessing landscape fragmentation: a composite indicator. Sustainability. 12(22):9632. doi:10.3390/su12229632.
- Diaz-Balteiro L, González-Pachón J, Romero C. 2017. Measuring systems sustainability with multi-criteria methods: a critical review. Eur J Oper Res. 258(2):607–616. doi:10.1016/j.ejor.2016.08.075.
- El Gibari S, Gómez T, Ruiz F. 2018. Evaluating university performance using reference point based composite indicators. J Informetr. 12(4):1235–1250. doi:10.1016/j.joi.2018.10.003.
- El Gibari S, Gómez T, Ruiz F. 2019. Building composite indicators using multicriteria methods: a review. J Bus Econ. 89(1):1–24. doi:10.1007/s11573-018-0902-z.
- El Gibari S, Perez-Esparrells C, Gomez T, Ruiz F. 2021. Analyzing the impact of Spanish university funding policies on the evolution of their performance: a multi-criteria approach. Mathematics. 9(14):1626. doi:10.3390/math9141626.
- Forestier O, Kim RE. 2020. Cherry‐picking the Sustainable Development Goals: goal prioritization by national governments and implications for global governance. Sustain. Dev 28(5):1269–1278. doi:10.1002/sd.2082.
- Frick SA, Rodríguez-Pose A. 2018. Change in urban concentration and economic growth. World Dev. 105:156–170. doi:10.1016/j.worlddev.2017.12.034.
- Garcia-Bernabeu A, Hilario-Caballero A, Pla-Santamaria D, Salas-Molina F. 2020. A process oriented MCDM approach to construct a circular economy composite index. Sustainability. 12(2):618. doi:10.3390/su12020618.
- García-Peña C, González-Medina M, Diaz-Sarachaga JM. 2021. Assessment of the governance dimension in the frame of the 2030 agenda: evidence from 100 Spanish Cities. Sustainability. 13(10):5519. doi:10.3390/su13105519.
- Gobierno de España (2022). Informe de Alineamiento del Proyecto de Ley de los Presupuestos Generales del Estado para 2022, available at: https://www.sepg.pap.hacienda.gob.es/sitios/sepg/esES/Presupuestos/InformesImpacto/IA2022/IAPGE2022/Paginas/Inicio.aspx
- Greco S, Ishizaka A, Tasiou M, Torrisi G. 2018. On the methodological framework of composite indices: a review of the issues of weighting, aggregation, and robustness. Soc Indic Res. 1–34.
- Hickel J. 2019. The contradiction of the sustainable development goals: growth versus ecology on a finite planet. Sustain. Dev 27(5):873–884. doi:10.1002/sd.1947.
- High-level political forum, HLPF (2017): Balancing the pillars: eradicating poverty, protecting the planet and promoting shared prosperity. Together 2030 Written Inputs to the UN High-Level Political Forum 2017. Together 2030 Global Advocacy Working Group, April, 2017.
- International Institute for Sustainable Development-SGD Knowledge hub. (December 11th 2012). UN adviser proposes four pillars for post-2015 goals. https://sdg.iisd.org/news/un-adviser-proposes-four-pillars-for-post-2015-goals/.
- Jacquier C. 2005. On relationships between integrated policies for sustainable urban development and urban governance. Tijdschr. Econ. Soc. Geogr. 96(4):363–376. doi:10.1111/j.1467-9663.2005.00469.x.
- Jain P, Jain P. 2020. Are the Sustainable Development Goals really sustainable? A policy perspective. Sustain. Dev 28(6):1642–1651. doi:10.1002/sd.2112.
- Jouida S. 2018. Diversification, capital structure and profitability: a panel VAR approach. Res. Int. Bus. Finance. 45:243–256. doi:10.1016/j.ribaf.2017.07.155.
- Jurado EN, Tejada MT, García FA, González JC, Macías RC, Peña JD, Becerra FS, Gutiérrez Fernández G, Luque Gallego M, Málvarez García G. 2012. Carrying capacity assessment for tourist destinations. Methodology for the creation of synthetic indicators applied in a coastal area. Tour. Manag 33(6):1337–1346. doi:10.1016/j.tourman.2011.12.017.
- Kanie N, Griggs D, Young O, Waddell S, Shrivastava P, Haas PM, Broadgate W, Gaffney O, Kőrösi C. 2019. Rules to goals: emergence of new governance strategies for sustainable development. Sustain Sci. 14(6):1745–1749. doi:10.1007/s11625-019-00729-1.
- Kanie N, Zondervan R, Stevens C, 2014. Ideas on Governance ‘of’ and ‘for’ Sustainable Development Goals: UNU-IAS/POST2015 Conference Report. United Nations University Institute for the Advanced Study of Sustainability, Tokyo.
- Lafortune G, Fuller G, Moreno J, Schmidt-Traub G, Kroll V (2018). SDG index and dashboards. Detailed methodological paper. Bertelsmann Stiftung and Sustainable Development Solutions Network Sustainable Development Solutions Network.
- Lamichhane S, Eğilmez G, Gedik R, Bhutta MKS, Erenay B. 2021. Benchmarking OECD countries’ sustainable development performance: a goal-specific principal component analysis approach. J Clean Prod. 287:125040. doi:10.1016/j.jclepro.2020.125040.
- Lynch A, LoPresti A, Fox C (2019): The 2019 US cities sustainable development report. New York: Sustainable Development Solutions Network (SDSN).
- Lyytimäki J, Salo H, Lepenies R, Büttner L, Mustajoki J. 2020. Risks of producing and using indicators of sustainable development goals. Sustain. Dev 28(6):1528–1538. doi:10.1002/sd.2102.
- Mair S, Jones A, Ward J, Christie I, Druckman A, Lyon F. 2018. A critical review of the role of indicators in implementing the sustainable development goals. Handbook of Sustainability Science and Research. 41–56.
- Masciandaro D, Quintyn M (2009). Measuring financial regulation architectures and the role of the central banks: the financial supervision Herfindahl Hirschman index. Paolo Baffi Centre Research Paper, (2009–2055).
- Meuleman L, Niestroy I. 2015. Common but differentiated governance: a metagovernance approach to make the SDGs work. Sustainability. 7(9):12295–12321. 2015. doi:10.3390/su70912295.
- Michie J, Oughton C. 2004. Competitive balance in football: trends and effects. London: The sportsnexus; p. 1–38.
- Mulholland E, Berger G (2019). “Budgeting for the SDGs in Europe: experiences, challenges and needs”, ESDN Quarterly Report 52, April 2019, ESDN Office, Vienna. https://www.esdn.eu/fileadmin/ESDN_Reports/ESDN_Quarterly_Report_52_Final.pdf
- Neuman M, Churchill SW. 2015. Measuring sustainability. Town Plan Rev. 86(4):457–482. 2015. doi:10.3828/tpr.2015.28.
- Nilsson M, Griggs D, Visbeck M. 2016. Policy: map the interactions between Sustainable Development Goals. Nature. 534(7607):320–322. doi:10.1038/534320a.
- OECD and JRC. 2008. Handbook on Constructing Composite Indicators: methodology and User Guide. Paris:OECD, Joint Research Committee.
- Organization for Economic Cooperation and Development, OECD (2017). Measuring distance to the SDG targets - an assessment of where OECD countries stand.
- Pomerol JC, Barba-Romero S. 2012. Multicriterion decision in management: principles and practice. Vol. 25, Dordrecht: Springer Science & Business Media. p. 53–56.
- Rastvortseva SN (2014). Analyses of regional specialization and geographical concentration of industry in Russia.
- Redclift M. 2005. Sustainable development (1987–2005): an oxymoron comes of age. Sustain. Dev 13(4):212–227. doi:10.1002/sd.281.
- Rhoades SA. 1993. The Herfindahl-Hirschman index. Fed Res Bull. 79:188.
- Ruiz F, Cabello JM, Luque M. 2011. An application of reference point techniques to the calculation of synthetic sustainability indicators. J Oper Res Soc. 62(1):189–197. doi:10.1057/jors.2009.187.
- Ruiz F, El Gibari S, Cabello JM, Gómez T. 2020. MRP-WSCI: multiple reference point based weak and strong composite indicators. Omega. 95:102060. doi:10.1016/j.omega.2019.04.003.
- Sachs J, Schmidt-Traub G, Kroll C, Durand-Delacre D, Teksoz K (2017). SDG. Index and Dashboards Report 2017. Bertelsmann Stiftung and Sustainable Development Solutions Network (SDSN). New York.
- Sachs J, Schmidt-Traub G, Kroll C, Lafortune G, Fuller G, Woelm F (2020). The Sustainable Development Goals and COVID-19. Sustainable Development Report 2020. Cambridge: Cambridge University Press.
- Schmidt-Traub G, Kroll C, Teksoz K, Durand-Delacre D, Sachs JD. 2017. National baselines for the Sustainable Development Goals assessed in the SDG index and dashboards. Nat Geosci. 10(8):547–555. doi:10.1038/ngeo2985.
- Schoon M, Cox M. 2018. collaboration, adaptation, and scaling: perspectives on environmental governance for sustainability. Sustainability. 10(3):679. 2018. doi:10.3390/su10030679.
- SDSN & IEEP (2020). The 2020 Europe sustainable development report: meeting the sustainable development goals in the face of the COVID-19 pandemic. Sustainable Development Solutions Network and Institute for European Environmental Policy: Paris and Brussel.
- Simonen J, Svento R, Juutinen A. 2015. Specialization and diversity as drivers of economic growth: evidence from High‐Tech industries. Pap. Reg. Sci 94(2):229–247. doi:10.1111/pirs.12062.
- Spaiser V, Ranganathan S, Swain RB, Sumpter DJ. 2017. The sustainable development oxymoron: quantifying and modelling the incompatibility of sustainable development goals. Int. J. Sustain. Dev. World Ecol. 24(6):457–470. doi:10.1080/13504509.2016.1235624.
- Tremblay D, Fortier F, Boucher JF, Riffon O, Villeneuve C. 2020. Sustainable development goal interactions: an analysis based on the five pillars of the 2030 agenda. Sustain. Dev 28(6):1584–1596. doi:10.1002/sd.2107.
- Triguero Ruiz F, Ávila-Cano A. 2019. The distance to competitive balance: a cardinal measure. Appl Econ. 51(7):698–710. doi:10.1080/00036846.2018.1512743.
- UN (2020): The Sustainable Development Goals report 2020. 300 east 42nd street, New York (NY), 10017, United States of America.
- UNDP (United Nations Development Programme) 2014. Discussion paper: governance for sustainable development- integrating governance in the post- 2015 development framework.
- UNEP (United Nations Environment Programme) 2013. A new global partnership: eradicate poverty and transform economies through sustainable developmente, the report of the high- level panel of eminent persons on the post- 2015 development agenda. UNDESA. Available from: https://sustainabledevelopment.un.org/index.php?page=view&type=400&nr=893&menu=35
- UNSSC (2017). Understanding the dimensions of sustainable development. Available online: https://www.unssc.org/news-and-insights/news/understanding-dimensions-sustainable-development-now-available-8-languages/ (accessed on 2021 Aug 4).
- Van Soest HL, Van Vuuren DP, Hilaire J, Minx JC, Harmsen MJ, Krey V, Luderer G, Riahi K, Luderer G. 2019. Analysing interactions among sustainable development goals with integrated assessment models. Glob. Transit. 1:210–225. doi:10.1016/j.glt.2019.10.004.