
 ?Mathematical formulae have been encoded as MathML and are displayed in this HTML version using MathJax in order to improve their display. Uncheck the box to turn MathJax off. This feature requires Javascript. Click on a formula to zoom.
ABSTRACT
There has been minimal consideration of the implications of demographic and social shifts for future old-age social protection needs and programming in sub-Saharan Africa. In this paper we address this gap, building on the example of Rwanda. We utilise mixed-methods research to show that aggregate national statistics mask many of the complex vulnerabilities that older people face. These, combined with our projections of changes in Rwanda’s economy, suggest an expanding unmet need for social protection among Rwanda’s older population. A universal social pension is one affordable way to respond to this gap in provision both now and in the future.
Introduction
Over the past decade, a growing number of sub-Saharan African (SSA) countries have forged new, or extended existing, social protection coverage for older people. For the most part, such programming has taken the form of social pensions or cash transfers, which now operate in 11 SSA countries (HelpAge International Citation2020). The rise in such schemes has been fuelled by evidence and advocacy highlighting older adults’ exposure to poverty, as well as possible redistributive effects of social pensions as recipients share their benefits with younger generations. In addition to a range of global commitments, a number of which rely explicitly on the provision of social protection (e.g. the UN 2030 Agenda for Sustainable Development (United Nations (UN) Citation2015)), many African countries have committed to global accords on ageing, such as the UN Madrid International Plan of Action on Ageing (United Nations (UN) Citation2002) and the Global Strategy and Action Plan on Ageing and Health (World Health Organization (WHO) Citation2016). Regional instruments include the African Union (AU) Policy Framework and Plan of Action on Ageing (HelpAge International/African Union (HelpAge/AU) Citation2003), the Common Africa Position on the Human Rights of Older Persons (Union Citation2012), and, most recently, the Protocol to the African Charter on Human and People’s Rights on the Rights of Older Persons (African Union (AU) Citation2016).
Despite these commitments, excepting a limited number of countries, regional and national policy and budget priorities have not focused on older people. An obvious reason for this has been a dominant focus on Africa’s huge population of young people, specifically in relation to work and economic growth (Union Citation2017). Yet, while SSA is projected to remain the demographically youngest region globally, with currently about 60 per cent of its population aged below 25 years, the population share and the absolute number of older adults (aged 60 years and over) will rise sharply in coming decades, reflecting increasing life expectancy and reducing fertility (UNPD Citation2019a). The proportion of older adults in SSA’s total population is expected to rise from 4.8 per cent today to around 7 per cent by 2050, while their number will triple from 52 million to 158 million – a more rapid rise than anywhere else or for any other age group (UNPD Citation2019a).
Consideration of the implications of such trends for future old-age social protection needs has been patchy. Reasons include widely held assumptions that (i) ‘informal’ social protection is in place – essentially transfers from children or own savings; (ii) older people living alone are less poor than households with children; and (iii) formal social protection (private pensions and healthcare will grow as economies formalise and urbanise.
Using Rwanda as a case study and drawing on a range of data, our purpose in this paper is to interrogate these assumptions. A more nuanced understanding of the consumption of older people points to high levels of poverty amongst this group. Furthermore, informal, relational-based social protection for this group is negligible in practice and formal social protection is very limited (and will continue to be so for many decades to come). In other words, we show that older people are indeed poor now and their numbers will grow substantially over the next 30 years, while at the same time both private and informal social protection will become even less adequate. Under these projections, there is a clear need for policy action. Our analysis illustrates that a modest social pension would significantly reduce poverty amongst older people and would be fiscally feasible and realistic to implement.Footnote1
Rwanda is an interesting case study: while it broadly conforms to regional trends, a number of distinctive features suggest the country could provide useful lessons for other SSA nations. On the one hand, Rwanda has implicitly advanced government-led social protection provision to vulnerable older adults as part of targeted social assistance for the poorest households. On the other hand, however, the country has yet to develop a comprehensive approach to policy for older people. Also, Rwanda’s demographic transition is interesting in that it combines very rapid improvements in life expectancy and falling total fertility as a result of significant health system investments and reductions in poverty. This means that Rwanda, if the right investments are made, can expect a potential first ‘demographic dividend’ in the near future (Groth and May 2017). This first dividend results from a period when the labour force temporarily grows more rapidly than the population dependent on it, freeing up resources for investment in economic development and family welfare. Other things being equal, per capita income grows more rapidly too (Bloom, Canning, and Sevilla Citation2003). The concomitant growth in the country’s already considerable number of older people (aged 60 years and over), however, poses an additional challenge to be addressed as part of Rwanda’s positioning both for a first and for a possible second demographic dividend.Footnote2 Other structural and contextual shifts, for example, in household structures and family support networks, are occurring in pace with rapid urbanisation and an expanding formal labour market. Such shifts have implications for how the Government of Rwanda will need to harness an ageing population and a changing demographic profile, including through social protection provision.
Given Rwanda’s relatively advanced demographic transition – and its ‘role-model status’ in terms of progress on inclusive growth and poverty reduction – an investigation of the nature, drivers and policy implications of expected trends in poverty and vulnerability in its older population is instructive. The paper is organised as follows. After an overview of key literature on ageing, vulnerability and social protection in SSA and a description of the methodologies employed, we present the results of our analyses in four parts. First, an overview of Rwanda’s current demography and projections on the pace of its population ageing as well as evidence on the family circumstances and living arrangements of Rwanda’s present older population. Second, an in-depth look at poverty and vulnerability in older age. Third, an examination of existing social protection provision for older Rwandans and key underlying policy perspectives. Fourth, an analysis of the present and future scope of unmet need for social protection in the older population, and an exploration of potential medium-term policy options to address an evolving need. The paper concludes with a discussion on the potential relevance of its findings for policy debates on ageing, social protection and development in SSA more widely.
Ageing, vulnerability and social protection in SSA
Understanding vulnerability in older age
A focus on the vulnerability of older adults within the context of rapid social and economic change has been central to the expanding research debate on issues of ageing in SSA (Aboderin Citation2010, Citation2017). The accumulated body of evidence brings into focus a particular vulnerability of older persons to poverty, social exclusion and abuse (Kakwani and Subbarao Citation2005; Ferreira and Lindgren Citation2008), as well as physical and mental ill-health and disability from non-communicable diseases (NCD) (Aboderin and Beard Citation2015). Such vulnerability may be understood as reflecting harmful exposures over the lifecourse as well as structural, family and individual-level deficits in later life (Lloyd-Sherlock and Barrientos Citation2002). The former may include a lack of schooling and consequent illiteracy, absent opportunities for gainful work, savings or investments during younger years, or earlier life exposure to malnutrition or chronic sickness (Tollman, Norris, and Berkman Citation2016).
Structural deprivations in later life include a lack of responsiveness of health systems (Aboderin and Beard Citation2015) and a low coverage of formal old-age pensions, with only 29 per cent of older Africans estimated to receive any kind of pension (23 per cent for those in SSA) (ILO Citation2017). This number is biased upwards, moreover, by countries in southern Africa that have near-universal social pensions in place; figures for other SSA nations are much lower, with the median for the rest of the region at less than 10 per cent (ILO Citation2017). Beyond the low coverage, large variations and deficits exist in the adequacy of pensions. Many recipients of contributory schemes have insufficient qualifying years of employment to receive full benefits; and there is considerable price risk, with only around a quarter of countries in the region having explicit price indexation rules. Longevity risks for members of provident funds and those in defined contribution systems are significant, as these are often paid as lump sums. Finally, while those covered by non-contributory systems are generally protected against poverty as (measured against international poverty lines of 1.25 USD/day in 2015), as a share of GDP/capita these payments are often quite low (Dorfman Citation2015).
Family-level deficits faced by older adults include (i) strains in the adequacy of ‘customary’ intergenerational support mechanisms across rural and urban settings (Aboderin, Citation2004; Berthé et al. Citation2013; Schatz and Seeley Citation2015) as well as (ii) new later-life support roles and burdens such as caregiving to orphaned grandchildren or sick adult children (Schatz and Seeley Citation2015; Tollman, Norris, and Berkman Citation2016). However, it is important to move beyond the often dichotomous ‘vulnerability’ and ‘positive contributors’ views to appreciate the full range of older adults’ key roles, circumstances and influences – whether positive or negative, active or latent. Findings from National Transfer Accounts analyses underscore this, showing economic flows across age groups to be two-way and to vary over the entire course of a life cycle: not only do parents receive support from their children in older age but they provide bequests and assets as well (Lee, Mason, and Cotlear Citation2010).
At the individual level, older adults may face constrained capacities for income generation. While a majority of older men and women in most SSA countries remain in the labour force whether formal or informal they are predominantly engaged in smallholder agriculture, where functional limitations combined with limited education and assets likely constrain their productivity (Aboderin and Beard Citation2015; Payne, Mkandawire, and Kohler Citation2013).
A salient notion in discourses on ageing in SSA is that older females are systematically disadvantaged compared to older males (Aboderin Citation2010; Knodel and Ofstedal Citation2003). Older women’s greater longevity itself is often construed as a detriment – as it implies a greater risk of widowhood or living alone (Knodel and Ofstedal Citation2003). Resonating with a ‘double jeopardy’ notion, a female disadvantage in later life is seen as the confluence of two negative statuses: being a woman and being an older person (Knodel and Ofstedal Citation2003). On the other hand, emerging evidence points to areas, such as closer ties with younger-generation kin, where older women may be favoured, thus having a bearing on risks of poverty and other forms of vulnerability (Aboderin Citation2010). Blanket assumptions of a greater female vulnerability in older age need to be carefully considered, therefore.
Social protection in the form of social pensions is becoming an increasingly preferred option for addressing vulnerability and poverty specific to old age. A considerable body of research now exists on the operation, governance, or effects of old-age social protection in SSA settings. Studies on social pensions have focused mainly on South Africa’s Older Persons Grant. Findings show positive impacts of benefits on the poverty status and food-security of pensioner households (Barrientos et al. Citation2003; Lloyd-Sherlock et al. Citation2012) as well as on various dimensions of beneficiaries’ well-being, including self-esteem (Schatz et al. Citation2012; Sagner and Mtati Citation1999) and self-reported health status (although effects on clinical health status are considerably less clear) (Lloyd-Sherlock and Agrawal Citation2014). The recent expansion of old age-focused social protection programming in SSA has primarily taken the form of social pensions or cash transfers.
Data and methods
We draw on evidence generated through a series of data collection and analysis activities, undertaken between March and December 2017, beginning with stakeholder consultations employing face-to-face interviews with key actors in Rwanda’s social protection sector; quantitative secondary analysis of national survey data; a community-based qualitative investigation in four research sites and, finally, a combined demographic, micro-, and macroeconomic modelling of future trends over the medium- to long-term.
The qualitative research was conducted in two provinces of Rwanda (City of Kigali, Southern Province), with one urban, and one rural district selected in each province (a total of four sites). Data collection comprised (i) semi-structured key informant interviews with district, sector, cell and village-level officers in charge of social affairs and social protection and other government representatives; and (ii) focus group discussions (FGD) with village communities.
Quantitative secondary analysis was performed on raw data from Round 4 (2013–14) of the Integrated Household Living Survey (EICV4); publicly available data from the 2012 Population and Housing Census; and population projections from the United Nations Population Division.Footnote3 In addition to analysing the current circumstances of older people, a micro-macro simulation model was developed to capture expected socio-economic changes over the next 30 years (2017–2047) and to estimate the ex ante potential impacts of policy options on poverty and vulnerability in the older population. The model involved a computerised general equilibrium (CGE) model of the macro economy linked in a top-down manner with a dynamic micro-simulation. A technical note is provided in the appendix. The CGE model was calibrated to a social accounting matrix (SAM), which reflected the input-output structure of production, the commodity composition of demand and the pattern of income distribution for Rwanda at a disaggregated level at the start of the simulation horizon 2011.Footnote4 The dynamic simulation model then allowed an exploration of the full heterogeneity of experiences of older people by ‘ageing’ the dataset based on a set of key life events for each individual. These events included mortality, marriage, household formation and land bequests, fertility, education, labour force participation, earnings, intra-generational transfers, and poverty.Footnote5
Results
Demography and demographic change in Rwanda
Projections indicate a rise in the share of older people in the Rwandan population from 4% in 2010 to 12% in 2050. The increase will be most pronounced for age groups 60–64 years and 65–69 years.Footnote6 The profile of Rwanda’s expanding older population will be shaped by enduring consequences of Rwanda’s genocide. Adult males were disproportionately targeted in the war, as reflected in the steadily declining male/female ratio in the older population from just below 85% in 1995 to under 65% in 2050: Rwanda’s older population will therefore be increasingly made up of women, many of them widows.
Urbanisation will progress at a rapid pace, with the percentage of the total population living in urban areas increasing from 20% currently to just under 40% by 2050.Footnote7 In the same period, the number of older Rwandans residing in towns and cities will quadruple, but only double in rural areas.Footnote8 This trend reflects both push and pull factors, with land scarcity a chief example of the former, and employment opportunities as well as active policies to promote urbanisation key examples of the latter.
Family circumstances and living arrangements of older Rwandans
Whilst a vast majority of older Rwandans have at some point been married, large gender differences exist in current marital status. Men are far more likely than women to be married even in their older years (85% of older men are married or cohabitating compared to just 31% of women), whereas women are more likely to be widowed (65% of women versus just 12% of men). The gender difference, which echoes patterns observed across many African countries (Marie Albertine and van de Walle Citation2018), reflects both women’s longer life expectancy and, thus, risk of widowhood as well as older men’s greater likelihood of remarrying after the death of a spouse.
Older people are often assumed to live in stereotypical ‘multi-generational’ households, where an adult married couple (who may have children themselves) ‘take care’ of their older parents. At first glance, our data on household age composition () appear to bear out this picture, with 63% of those aged 60–69 residing in households with working-age-adults (most of these with children as well). This percentage falls as average age increases and as older-person-only households become more common (the pattern is similar for older men and women).
Figure 1. Household composition of older people, by age and sex of the household head
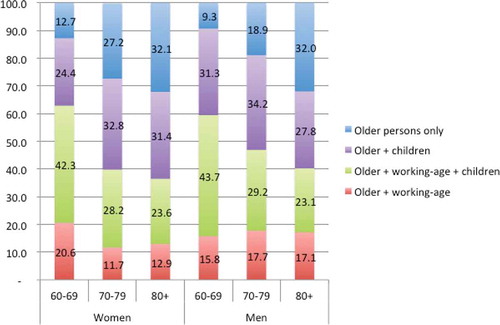
A more differentiated and gendered picture emerges, however, if one examines patterns of co-residence by relationship rather than merely by age (). Older women are far more likely than older men to live alone, and the proportion of older women in single-person households increases with age, reaching 26% of those aged 80 +. Women are, similarly, more likely than their male counterparts to reside in ‘skip generation’ households, consisting of just an older person and their grandchild. Among those aged 60–69; 20% of women live in such arrangements compared to only 7% of men. For the age group 80+, the corresponding figures are 33% for women and 20% for men. These findings suggest that, what appears to be a multi-generational household from aggregate data, is in fact a ‘skip generation’ household where older women likely carry care responsibilities for their grandchildren due to a ‘missing-middle’ of the children’s parents. Furthermore, women in such circumstances are more often the only adult in the household, whereas older men are more likely to be part of a married couple.Footnote9
Men are also more likely than women to live in a couple – only two-person household (whether both are over 60 or the spouse is working-age) and in nuclear families (comprising an older person/couple and their adult or underage children). This pattern reflects older men’s greater likelihood of being married, often to younger spouses with consequently younger children.
Figure 2. Household composition by relationship, by age and sex of older person
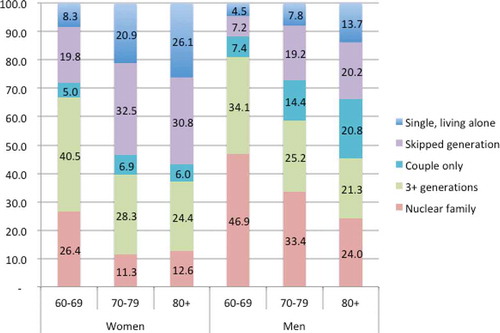
Clear gender differences emerge also in households with three or more generations, with those comprising older women much less likely to conform to the stereotypical idea of a couple ‘taking care’ of their mother/-in-law. Instead, adult children living with older women are much more likely to be female, and many of these are divorced, separated, or widowed, returning to live with their mother after the dissolution of their marriage. Far fewer divorced, separated, or widowed adult children move back in with their older fathers. Taken together the above findings point to highly gendered and age-specific vulnerabilities and dependencies that characterise older years. These suggest that (1) older women play a disproportionate role as supporters of their children (daughters in particular) and grandchildren, rather than as recipients of support from them; and (2) the stereotypical ‘multi-generational’ household is, in fact, very rare in the Rwandan context with only around 2% of older people living with their married children.
This has important implications for poverty among older people, especially women, with a large majority lacking support from co-resident working-age children. Even where older women do live with their adult children, support may be limited given the typical absence of a male working-age earner.Footnote10
Poverty and vulnerability amongst older people
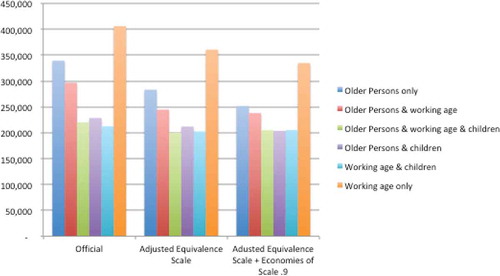
Directly determining levels of poverty among older people quantitatively is challenging, as data on consumption, income, transfers, and assets are all collected at the household rather than at the individual level. Poverty amongst older persons is, therefore, normally measured in terms of the incidence of poverty (in various dimensions) among households with older people compared to those without. Using the national poverty line,Footnote11 official statistics show households with only older people to be markedly less poor than households where older people live with working-age adults and children ().
However, it may be misleading to presume that older people living alone are less poor than those living with working-age adults and children based on these statistics alone. First, measures of relative consumption poverty are very sensitive to assumptions about economies of scale within households. Different assumptions about the relative consumption needs of children versus adults and the implications of household size on such needs (for ‘public’ goods like shared housing, utilities versus ‘private’ goods like food or education) yield different conclusions about the relative consumption of households.Footnote12 As shown in , once these economies of scales and equivalence scales are considered,Footnote13 the gap in average consumption between older people living alone and households with children disappears, and the gap in poverty incidence narrows considerably.Footnote14 Under official estimates, just 13% of households with older people only are considered poor, whereas under the adjusted assumptions the rate increases to 32%.
Figure 3. Average per-adult equivalent consumption, RwF/year
A second reason for caution in assuming lower poverty rates among single older person households emerges if one considers food consumption and dietary quality. Both are likely higher in households that are less poor. Our analysis finds, in fact, that older people who live alone are disadvantaged in terms of diet quality. Older person only households, moreover, spend more per-adult equivalent on rent (or imputed rent). While this may reflect choices of costlier accommodation, there is a need to consider the likely large economies of scale in imputed housing costs that co-residence with others, especially in rural areas, likely provides. Lastly, older adults living without working-age members emerge as disadvantaged compared to other household types in terms of the dwelling construction materials, lighting, latrine, and cooking fuel used. Such findings suggest that the additional housing consumption in older person single households does not reflect ‘luxury’ but rather a lack of economies of scale.
Earnings and assets over the lifecourse
Older people in Rwanda continue to work long into their old age. Labour force participation (in any productive activity, formal or informal) amongst older people is nearly universal for those aged 60–69 years, falling only gradually with age to remain well over 50% even for those aged 80–84 years. Work is especially common among older adults living without working-age adults. This may reflect a reduced necessity for earning income where working-age adults are present or a lessened physical or cognitive capacity for engaging in work among those requiring care from such household members.
Landholdings are key asset in older age. In the absence of formal pensions or significant savings, Rwanda’s older people depend on land for their livelihood. A majority, however, do not have large enough landholdings to be considered adequate. Parental bequests to, and division of land among, children only exacerbate this situation.
Older women are particularly vulnerable given traditional customs, which stipulated a bequeathing of land only to sons upon their marriage, while daughters were expected to join their husband’s households.Footnote15 Female children would not generally inherit land upon their parents’ deaths either, and, as qualitative respondents underscored in their accounts, widows might not remarry or be able to retain control or ownership of land when their husbands die.Footnote16 Efforts to improve women’s access to land through legal marriage and inheritance laws have been central to an extensive land registration process that was completed in 2015 (Ayelew Ali, Daniel, and Goldstein Citation2011). However, a full translation of the changed legislation into practice has not yet ensued given a lack of awareness of the new laws, persistent strong cultural preferences favouring sons with land bequests, and, crucially, the salience of common law unions (constituting a quarter of marriages), which are not covered by the regulations.Footnote17
Fragile social support from children to parents
Analysis of quantitative data highlights the limited scope of support provided to older people by family networks and the role of adult children’s proximity in shaping the extent of such assistance. For instance, financial or material support from non-resident adult children is fairly common, but tends to be negligible in terms of value.Footnote18 The median value of transfers (cash and in kind) from all sources is just 2–8% of household consumption, and only around 21% of older person only households. Twelve per cent of skip generation households receive annual transfers equal to at least two-thirds of the poverty line, or RwF 105,000 per year in 2013/14.Footnote19 Transfers from urban areas are greater in value, likely reflecting support from adult children who have migrated to sufficiently lucrative jobs to permit more significant financial remittances.
Traditional norms in Rwanda oblige younger generations to care for their elders (‘an old, slow rabbit must be fed by its children’ is a traditional saying). Our qualitative findings suggest, however, that the fulfilment of this duty is often undermined. Across all sites, older respondents highlighted the inadequacy of assistance received from their children. As causes, respondents pointed to the economic hardship faced by working-age adults and their difficulties in sustaining even their own livelihoods and in meeting obligations to their own offspring; to a modern culture of ‘selfishness’ that militated against family solidarity and to the premature death of children during the genocide.
While transfers from children in urban areas may, on average, be higher than from those remaining in rural areas, a majority of respondents perceived the rural-urban migration of working-age adults to have had a major, mostly negative, effect on the care provided for older people who stay back. While acknowledging that such migration was motivated by necessity, respondents believed it to engender both physical and emotional distance between older people and their children. Cases were highlighted in which migrants largely failed to visit or to support their parents financially, leading to a deterioration of relationships, while older adults’ ties with people in closer proximity, such as neighbours, were possibly strengthened. A Rwandan proverb ‘a neighbour around you is better than a brother abroad’ was commonly cited in this regard (Respondent, FGD 20–50 year old, Gisagara).
A further key factor seen by respondents as undermining family ties and support for older adults was the 1994 genocide and its decimation of whole generations. Apart from the loss of life, which left many older adults with no family members to rely on, respondents perceived the trauma and distrust sown by the genocide to have eroded ‘love’ and care for one another, including for older people, in society broadly.
Social protection for older Rwandans: current and future (under)coverage
Given current demographic trends and the profile of poverty and vulnerability in Rwanda’s older population, as described above, the importance of functioning formal and informal safety nets becomes apparent. Rwanda’s social protection sector has evolved rapidly over the last decade, characterised by a high degree of government ownership. The specific needs of older people, however, have received limited attention, likely reflecting assumptions (based in large part on official poverty consumption estimates) of a relatively lesser vulnerability among this group and expectations that processes of structural economic change will lead to an increasingly formalised economy with expanded private pension coverage. Instead of a focus on older age, current social protection policy considers older adults only as part of the population classified as living in extreme poverty.
A key social protection programme benefiting older people is the large-scale national programme, known as the Vision 2020 Umurenge Programme (VUP), which provides cash transfers and a range of other support, sometimes with public work requirements, to the poorest Rwandans. Extremely poor older people (defined as those in the lowest two socio-economic ubudehe categories) who live in households with no labour capacity (i.e. no working-age household members) receive VUP direct support cash transfers.Footnote20 Despite the perception that the VUP reaches 100% of the eligible extreme poor in the 416 sectors where it is implemented, large gaps in coverage of poor older people remain.Footnote21 Analysis of coverage data shows only 56% of older adults eligible for cash transfers to have been reached by such direct support in VUP sites. The remaining 44% were not covered at all, representing errors in VUP targeting. Similarly, analysis by consumption poverty status shows just 66% of extremely poor households with only older members to be included in the programme, and only 37% of households with only older persons and children. These figures point to significant errors of exclusion due to inaccuracies in the ubudehe categorisation, as one would expect consumption poverty to correlate significantly with the lowest two ubudehe categories. Among households with older people and working-age adults just 3% had ever benefited from VUP public works in areas where the programme was being implemented.
The present design of, and old age-related gaps in, Rwanda’s VUP programme, as the findings from qualitative consultations with policy and decision makers suggest, reflect (i) a prime emphasis on promoting beneficiaries’ ‘graduation’ from poverty – reflecting concerns about evolving ‘dependency mindsets’ and the longer-term financial sustainability of Rwanda’s social protection provisions and, (ii) a limited consideration of specific protection needs in later life. While an incipient endorsement of a rights-based and life-cycle oriented social protection approach emerged among some key players and is now reflected in a new social protection strategy for Rwanda, the focal life stages are almost exclusively childhood and youth, with little, if any, attention given to older age. This omission overlooks the high levels of poverty and minimal formal pension contribution within the older population. Just 5.8% of households with older people report any kind of formal pension income or other investment earnings.Footnote22 Coverage is particularly low among rural older adults and varies across household types as shown in .Footnote23
Unmet need for social protection: present and future
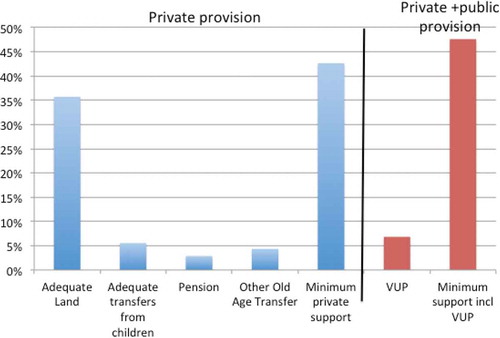
The limited coverage of poor older people by existing social protection schemes together with the minimal penetration of formal sector pensions point to a considerable unmet need for social protection in Rwanda’s older population. Our further analysis of the extent of such need – defined as a lack of private provision through sufficient land (defined as half a hectare), adequate income transfers from children (equivalent to half the poverty line per-adult equivalent), or pension income – suggests that nearly 60% of older people (or 110,000 in absolute numbers) currently require social protection, yet only 7% are receiving VUP support (). This estimate is fairly generous as many older adults who have a minimum level of private or public provision remain very poor, as their income is insufficient to lift them entirely above the poverty line. Similarly, pensions and other old-age transfers are often inadequate in value, even where they are in place.
The results of the macro-microsimulation model suggest that the current scope of ‘unmet need’ will evolve over time. While formal sector employment and thus participation in formal pension schemes are expected to rise, present working-age cohorts who will reach old age in coming decades are already largely left behind in terms of such coverage. Current pension participation peaks amongst 35–39 year-olds at only 6.8%. Thus, between 2015 and 2045 the share of older people with some kind of pension is estimated to remain fairly constant at 5–7%.
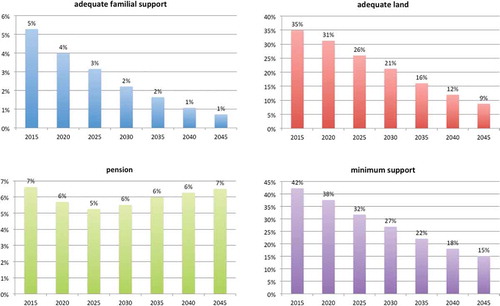
Figure 4. Per cent of older people having adequate private provision for old age
At the same time, simulation results reveal that expected trends in urbanisation and demographic change will lead to a fall in the percentage of older people with adequate landholdings from just under 35% to 9% over the period 2015–2045, as land is progressively subdivided across generations. Adequate familial support is estimated to decrease over the period, from an already negligible 5% to less than 1%. Overall, the percentage of older people with minimum private support is estimated to fall from 42% to 15% ().
Taken together, the socio-economic interactions and trends captured in the simulation model suggest strongly that, in the absence of expanded social protection provision, Rwanda’s growing older population will be increasingly at risk of poverty.
Figure 5. Macro-microsimulation estimates of financial support in old age for those age 60+
Looking ahead: feasibility and impact of a universal social pension
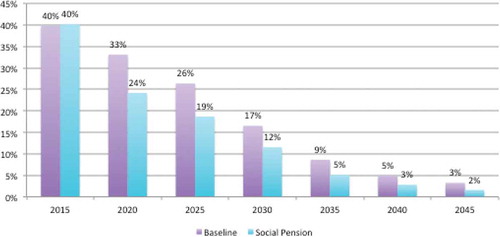
The above projections underscore a need for an adaptation of Rwanda’s social protection policy to address the needs of future generations of poor older people. Two major policy options exist in this regard, namely (i) the institution of a form of non-contributory social pension and (ii) the promotion of long-term savings for the informal sector. We consider the former. The microsimulation model allows an estimation of the projected impacts on old-age poverty of such a scheme. As shows, a non-contributory social pension would reduce poverty amongst older people significantly over the coming years, if transfers of the current VUP direct support value (7,500 RwF per month per person) went to all people aged 65 years and above and assuming a constant real poverty line.Footnote24 The difference in percentage points is largest in the early years, when poverty would fall from 33% to 24% amongst older people age 65 years and above who receive the transfer. However, as a percentage change, the impact on poverty incidence amongst older people would actually increase over time, growing from a 27% decrease in 2015 to 44% by 2040.
Even a modest social pension, therefore, would have large relative impacts on poverty reduction among older people. The value of 7,500 RwF per month is equivalent to just 56% of the general poverty line, so not large enough in itself to lift all households (particularly those with many members) over the poverty line. The impact in terms of poverty depth would be even larger, with many households lifted closer to the poverty line, even if not entirely above it; poverty depth would fall by 42% amongst beneficiaries by 2020 compared to the baseline, and by 65% by 2040. Clearly, a more generous transfer value would increase the impact on poverty reduction even further.
Figure 6. Impact of universal categorical social pension (for those aged 65+) on poverty amongst older people aged 65+
A major question, of course, concerns the affordability of such a categorical transfer, especially given the projected five-fold rise in the number of adults aged 65 years and above over the next 50 years. shows that despite the growth of the older population, the cost of a social pension as a share of total government expenditure would actually fall, from 2% in 2015 to just 1% in 2050. This is because real GDP and real government expenditure are expected to increase far more quickly than the number of older people, suggesting a greater fiscal space to accommodate social programmes.
Table 1. Percentage of households with older persons receiving pensions, by household type
Table 2. Projected number of beneficiaries and cost for a social pension for all 65 +
These forecasts assume a constant real value of the pension over 30 years. In practice, there may be political pressure to increase the real value of the transfer as real GDP per capita increases. However, even if the transfer was set at 20% of GDP/capita, by 2050 the share of total GoR expenditure would be just 6.4%. While this would not be insignificant, it would neither be unrealistic for a programme reaching nearly 10% of the total population at that point. Taken together, the estimates show that a non-contributory pension would be affordable both now and in the future.
Any plans to establish a social pension will take time to gain political and financial traction. In the immediate term, a number of steps could be considered. The VUP Direct Support component could be gradually expanded to reach more older people who are currently eligible (i.e. without able-bodied working-age adults), but not already enrolled in the programme. Second, the VUP could be extended in a phased manner to include those in the lowest poverty category (ubudehe 1) even with working-age adults, since it is unfair to penalise older people whose children need to live with them for whatever reason.
Important too, in the short term, is continued support for women’s land rights, with a particular focus on implementing the Inheritance Law and ensuring that older women are able to retain their land when their husbands die. Extending the law to include those in customary unions, currently a quarter of all married women, will be crucial.
Over the medium term, a shift towards a categorical targeting approach to social protection provision in the form of a universal social pension to meet the needs of current older people would be a sensible option. This could be helpfully complemented by the development of long-term savings promotion for the informal sector, to help meet the pension and asset protection needs of the next generation of older people.
Discussion
Resonating with evidence from existing research on older adults in SSA settings, our findings emphasise the currently high levels of poverty and vulnerability among current cohorts of older Rwandans. This is especially true for women and those in rural areas, driven by deficient social safety nets, including limited support from younger-generation family members, a lack of savings, and limited access to formal pension coverage and land. Furthermore, by presenting analysis disaggregated by household type, we show that aggregate national statistics mask many of the complex vulnerabilities that older people face.
Going beyond what has so far been reported in the literature, our results predict the likely persistence of poverty among future cohorts of elders even with current expectations of growth in agricultural production and employment over time. To effectively meet the substantial need for old-age social protection in Rwanda, our analysis identifies a set of feasible and affordable policy options: an expansion of targeted direct support in the immediate term, and a move towards a universal social pension. We show that a social pension is one affordable way to help respond to this gap in provision both now and in the future. The affordability of universal non-contributory pension schemes has been demonstrated across a range of low resource contexts, including in SSA countries.Footnote25
A realisation of the identified policy options would accord with and imply a progressive fulfilment of commitments made by Rwanda to regional and global ageing frameworks (UN Citation2002, WHO Citation2016; Union Citation2012) as well as to key targets and goals in the UN Agenda 2030 for sustainable development (UN Citation2015). Nonetheless, any future planning of such responses will need to be pursued and negotiated within the context of Rwanda’s broader social protection paradigms and longer-term ‘population and development’ agendas. The former will require navigating tensions between, on the one hand, persistently salient ‘safety nets’ perspectives, and underlying fiscal concerns, which emphasise narrowly targeted and temporary benefits for the poorest and, on the other hand, positions that are receiving increasing traction in national policy thinking and that espouse rights and lifecycle-based social protection floors (ILO Citation2017).
Negotiating an expansion of old-age social protection within the context of longer-term ‘population and development’ agendas will require, in particular, an assessment of how and where such expansion may conflict or cohere with strategic investments that Rwanda is seeking to make in its huge population of children and youth with a view to reaping a so-called demographic dividend . This is particularly pertinent given the substantial current funding and policy focus on children by international actors in Rwanda’s social protection sector.
Identifying intersections between an expansion of old-age social protection coverage and Rwanda’s child and youth-focused demographic dividend agenda will require careful analysis of (i) where and how planned demographic dividend investments might shape levels of vulnerability of future cohort of older adults, and (ii) conversely, how universal social transfers for older adults might hinder or promote the achievement of dividend-relevant outcomes for child and youth cohorts now and in the future.
Our findings signal the critical importance of further research to stimulate and establish a basis for future old-age social protection planning within Rwanda. For other SSA countries, our investigation underscores the need to consider more closely the social protection implications of social, demographic and ageing trends.
Funder
Funding for this study was provided by the East Africa Research Hub (EARH) of DFID, UK. The findings, interpretations and conclusions expressed in this paper are those of the authors and do not necessarily reflect the policies or views of DFID.
Acknowledgments
We are extremely grateful for the support provided by Jeannette Bayisenge and Albert Irambeshya in the fieldwork and early literature review. Dirk Willenbockel provided very useful guidance and support for the microsimulation model construction and estimations.
Rachel Sabates-Wheeler has been a Research Fellow at the Institute of Development Studies since 2001, and the Director of the Centre for Social Protection between 2006 and 2012. Rachel spent 2.5 years as Chief Social Policy and Research for UNICEF Rwanda before re-joining IDS in 2015. Whilst at IDS she has worked on areas of poverty analysis relating to PRSPs, social protection, rural livelihoods and migration in many countries (including over 8 African countries) and been centrally involved in numerous large research programmes that explore understandings of risk and vulnerability both conceptually and empirically. These programmes include the Productive Safety Net Programme (PSNP), Ethiopia; the Hunger Safety Net Programme (HSNP), Kenya; the Child Support Grant (CSG), South Africa; and a number of studies on home-grown school feeding programmes in Africa. Rachel’s work continues to cover areas of poverty and vulnerability research and social safety nets for vulnerable groups, with a focus on the rural sector. She has published on issues of rural institutions, graduation in the context of social protection, social protection in Africa, migration and poverty, and has worked for numerous international agencies.
Emily Wylde is an economist who has worked on poverty and social policy across a range of countries in sub-Saharan Africa and South Asia. Her expertise includes quantitative and qualitative analysis and support to the development of social protection policies and programmes. She has been providing technical support to the Rwandan social protection sector for over a decade, and has been the lead author of many of the major diagnostic studies for the sector. Emily also specializes in the development and application of microsimulation methods for ex ante evaluation of social protection programmes as well as other social policy areas.
Isabella Aboderin is Chair in Africa Research and Partnerships and Professor Gerontology at the University of Bristol, UK, where she directs the Perivoli Africa Research Centre. Prior to joining Bristol University, Isabella held positions as Senior Research Scientist at the African Population and Health Research Center (APHRC) in Nairobi (2012-2019) and as Associate Professor of Gerontology at the University of Southampton, UK. Isabella currently serves as Regional Chair for Africa of the International Association of Gerontology and Geriatrics (IAGG); Member of the Global Commission on creating a Roadmap for Healthy Longevity; and of the World Economic Forum Global Future Council on Human Enhancement and Longevity; and Trustee on the boards of the United Nations International Institute on Ageing (INIA) and the Population Reference Bureau (PRB). Isabella is also an Extraordinary Professor at North-West University, South Africa. Isabella holds a PhD from the School for Policy Studies from the University of Bristol, UK, an MSc in Health Promotion Sciences from the London School of Hygiene and Tropical Medicine, and a BSc in Cellular and Molecular Pathology from the University of Bristol.
Martina Ulrichs is a Program Officer at the Pathy Family Foundation (PFF), which is based in Montreal and focuses on supporting community-based organizations to provide programming in the areas of education, health and social protection. Her portfolio of partners consists mainly of organizations working with Canada’s Indigenous Peoples on finding community-driven solutions to physical and mental health issues, as well as youth empowerment. Prior to this, Martina worked for several years in policy-focused research for the Overseas Development Institute and the Institute of Development Studies (IDS). During that time she managed and conducted research projects on social protection policy and programming in Mexico and East Africa for a range of UN agencies and bilateral donors, with a focus on social vulnerability and climate risks. She has also delivered a range of lectures, seminars and capacity building trainings on social protection, including as part of the MA programs at IDS and the University of Bonn-Rein-Sieg.
Disclosure statement
No potential conflict of interest was reported by the authors.
Additional information
Funding
Notes on contributors
Rachel Sabates-Wheeler
Rachel Sabates-Wheeler has been a Research Fellow at the Institute of Development Studies since 2001, and the Director of the Centre for Social Protection between 2006 and 2012. Rachel spent 2.5 years as Chief Social Policy and Research for UNICEF Rwanda before re-joining IDS in 2015. Whilst at IDS she has worked on areas of poverty analysis relating to PRSPs, social protection, rural livelihoods and migration in many countries (including over 8 African countries) and been centrally involved in numerous large research programmes that explore understandings of risk and vulnerability both conceptually and empirically. These programmes include the Productive Safety Net Programme (PSNP), Ethiopia; the Hunger Safety Net Programme (HSNP), Kenya; the Child Support Grant (CSG), South Africa; and a number of studies on home-grown school feeding programmes in Africa. Rachel’s work continues to cover areas of poverty and vulnerability research and social safety nets for vulnerable groups, with a focus on the rural sector. She has published on issues of rural institutions, graduation in the context of social protection, social protection in Africa, migration and poverty, and has worked for numerous international agencies.
Emily Wylde
Emily Wylde is an economist who has worked on poverty and social policy across a range of countries in sub-Saharan Africa and South Asia. Her expertise includes quantitative and qualitative analysis and support to the development of social protection policies and programmes. She has been providing technical support to the Rwandan social protection sector for over a decade, and has been the lead author of many of the major diagnostic studies for the sector. Emily also specializes in the development and application of microsimulation methods for ex ante evaluation of social protection programmes as well as other social policy areas.
Isabella Aboderin
Isabella Aboderin is Chair in Africa Research and Partnerships and Professor Gerontology at the University of Bristol, UK, where she directs the Perivoli Africa Research Centre. Prior to joining Bristol University, Isabella held positions as Senior Research Scientist at the African Population and Health Research Center (APHRC) in Nairobi (2012-2019) and as Associate Professor of Gerontology at the University of Southampton, UK. Isabella currently serves as Regional Chair for Africa of the International Association of Gerontology and Geriatrics (IAGG); Member of the Global Commission on creating a Roadmap for Healthy Longevity; and of the World Economic Forum Global Future Council on Human Enhancement and Longevity; and Trustee on the boards of the United Nations International Institute on Ageing (INIA) and the Population Reference Bureau (PRB). Isabella is also an Extraordinary Professor at North-West University, South Africa. Isabella holds a PhD from the School for Policy Studies from the University of Bristol, UK, an MSc in Health Promotion Sciences from the London School of Hygiene and Tropical Medicine, and a BSc in Cellular and Molecular Pathology from the University of Bristol.
Martina Ulrichs
Martina Ulrichs is a Program Officer at the Pathy Family Foundation (PFF), which is based in Montreal and focuses on supporting community-based organizations to provide programming in the areas of education, health and social protection. Her portfolio of partners consists mainly of organizations working with Canada’s Indigenous Peoples on finding community-driven solutions to physical and mental health issues, as well as youth empowerment. Prior to this, Martina worked for several years in policy-focused research for the Overseas Development Institute and the Institute of Development Studies (IDS). During that time she managed and conducted research projects on social protection policy and programming in Mexico and East Africa for a range of UN agencies and bilateral donors, with a focus on social vulnerability and climate risks. She has also delivered a range of lectures, seminars and capacity building trainings on social protection, including as part of the MA programs at IDS and the University of Bonn-Rein- Sieg.
Notes
1. ‘Social pension’ is equivalent to a non-contributory pension.
2. The first demographic dividend arises when the age structures of populations become older, with a rise in per-capita consumption due to a temporary shift in the ratio of workers to consumers. Where the concomitant social and economic changes motivate people to accumulate greater personal wealth, a process known as the second demographic dividend can be unleashed, leading to a period of rapid growth in per capita assets and income. Whereas the first demographic dividend is transitory (lasting only as long as the working-age population is greater than the dependent population), the second is persistent. However, it is also much more dependent on having policies in place early on to encourage the requisite increase in savings; where the consumption of older people is funded instead through inter-generational transfers, this second dividend will not materialise (Mason and Lee Citation2006).
3. The dataset is the EICV4 main sample of 14,735 households, representative to the district level.
4. The SAM has recently been constructed at the International Food Policy Research Institute Pradesha and Diao (Citation2014) provide details of data sources and describe the SAM compilation process.
5. For technical annex detailing specifications of the model contact the authors.
6. Source: United Nations, Department of Economic and Social Affairs, Population Division (2015). World Population Prospects: The 2015 Revision, custom data acquired via website. For these purposes, we use the 2015 Revision even though more recent World Population Prospect projections are available, because the 2017 and 2019 Revisions for Rwanda are highly problematic, as the adjustments made by the UN to the raw census data effectively erase the real effects of the genocide in terms of the mortality amongst working-age adult men who were a particular target. The 2015 revision is more in line with the findings of the 2002 and 2012 censuses.
7. There is a large discrepancy between the estimates in the World Urbanisation Prospects 2015 revision and the estimates from EICV4, with the former at 28% for 2014 and the latter showing 20%. We resolve this in the microsimulation model by using the NISR’s EICV4 estimate as the starting point for 2014, and then use the rate of change from the World Urbanisation Prospects.
8. NISR (Citation2012)
9. These findings are consistent with UNPD (Citation2019b)
10. Ezemanari and Wu (2005) found a significant gender gap in both wages and earnings in Rwanda. While the data are old, we would expect to see fairly similar trends today based on their findings.
11. Rwanda’s national poverty line is based on a cost of basic needs approach. For the full methodology, see NISR (2012)
12. Per-adult equivalent consumption is estimated using the following equation for adult equivalents: , where A is the number of adults, C is the number of children, α is the share attributed to children, and θ the parameter for economies of scale. α and θ lie between 0 and 1. When α and θ are both equal to 1, the equivalence scale is a per capita measure, and the closer θ is to one, the fewer economies of scale there are.
13. Unfortunately, there is no one correct way to handle equivalence scales in the theoretical or empirical literature (See Deaton (Citation1997, 241–268) and Deaton and Paxson (Citation1998) for a discussion). Here we adjust the equivalence scales to account for age and gender in a more detailed manner than the official statistics, and assume an economies of scale parameter θ of 0.9.
14. Sensitivity analysis was undertaken to test the implications of different assumptions for the parameters in the equivalence scale assumption, including θ of 1 (no economies of scale) and 0.75. Here we show the results of θ = 0.9, recognising some economies of scale but taking a conservative value. See Sabates-Wheeler et al (Citation2015) for further detail,
15. Although there were traditional mechanisms to transfer land to girl children in certain circumstances, these have not been in use in recent times due to land scarcity (Pottier Citation2002).
16. Abbott and Malunda (Citation2015), Musahara (Citation2006) and Polavarapu (Citation2011)
17. 76% of couples in the survey by Ayelew Ali, Daniel, and Goldstein (Citation2011) were in non-formal unions.
18. 78% of households with no working-age adults (i.e. the only adults are older people) receive transfers from their children, and 96% receive a transfer from someone.
19. This is equal to the extreme or food poverty line per person.
20. Here we are using an age cut-off of 65 rather than 60 when assessing VUP coverage. VUP eligibility has changed since the time of the EICV4 data collection, with new ubudehe classifications and a different ubudehe cut-off so that only the lowest category is now eligible. The analysis here uses the older system because that was what was in place when the data was collected.
21. Sectors are the third tier of the administrative structure, below provinces and districts.
22. This goes up to just 7.2% if we restrict it to households with older people aged 65 and above.
23. Reported in the EICV4 as either RSSB/Caisse Sociale, private pensions or ‘Old Age Grant’ income source.
24. In Rwf 2014 real terms, in other words, assuming the real value is maintained by increasing the nominal value in line with inflation.
25. There have been recent calls for the provision of universal non-contributory pensions that are not means-tested. These have already been introduced in Zanzibar and currently under discussion in other SSA countries. See: Guven and Leite (Citation2016). Benefits and costs of social pensions in Sub-Saharan Africa. World Bank.
i Which is not uncommon in moving from micro-level phenomenon in the context of a sample survey to aggregated figures. This can be the result of the nature of the sample dataset used in the micro model, whereby each individual record in the sample ‘represents’ a certain number of individuals in the population, and therefore the micro model can be ‘lumpy’ in its estimates of rare phenomena and require correction when aggregated.
ii For all earnings estimations, unobserved heterogeneity is incorporated through the use of the individual residuals (household for agriculture).
iii One limitation of this approach is that even incorporating individual heterogeneity through residuals, the predicted values are systematically higher than actuals, which would make it appear as though poverty has fallen overnight. We therefore calibrate the poverty estimates with the official poverty line by adjusting the poverty line (setting the poverty line at the level of consumption of the 39th percentile, i.e. ensuring the incidence of poverty is the same).
iv Growth rates up to 2015 are reported actual growth rates (World Bank Group, 2015, 2017) and the expert projections up to 2019 are taken from World Bank Group (2017). From 2020 onwards, OECD ‘Shared Socioeconomic Pathway 2’ (SSP2 aka ‘middle of the road’) GDP projections are used (Rosegrant et al 2017).
References
- Abbott, P., and D. Malunda 2015 “Promise and the Reality: Women’s Rights in Rwanda.” Rwanda Working Paper, Institute of Policy Analysis and Research (IPAR). No. 5, January.
- Aboderin, I. 2004. “Decline in Material Family Support for Older People in Urban Ghana, Africa: Understanding Processes and Causes of Change.” Journal of Gerontology: Psychological Sciences, Social Sciences 59: S128–S137.
- Aboderin, I. 2010. “Poverty in Old Age in Sub-Saharan Africa: Examining the Impacts of Gender with Particular Reference to Ghana.” In International Handbook of Gender and Poverty, edited by S. Chant, 32. Chapter. London: Elgar.
- Aboderin, I. 2017. “Coming into Its Own? Developments and Challenges for Research on Ageing in Africa.” Journal of Gerontology: Series B 72 (4): 643 645. doi:10.1093/geronb/gbw017.
- Aboderin, I., and J. Beard. 2015. “Older People’s Health in sub-Saharan Africa.” Lancet 385 (9968): e9–e11. doi:10.1016/S0140-6736(14)61602-0.
- African Union (AU). 2016. Protocol to the African Charter on Human and People’s Rights on the Rights of Older Persons in Africa. Addis Ababa: African Union.
- Ali, A., K. D. Daniel, and M. Goldstein 2011. “Environmental and Gender Impacts of Land Tenure Regularization in Africa: Pilot Evidence from Rwanda.” Policy Research Working Paper 5765, World Bank.
- Barrientos, A., M. Ferreira, M. Gorman, A. Heslop, et al. 2003. Non-contributory Pensions and Poverty Prevention: A Comparative Study of Brazil and South Africa. Manchester & London: Institute of Development and Policy Management and HelpAge International.
- Barrientos, A., and P. Lloyd-Sherlock. 2003. Non-contributory Pensions and Social Protection. Issues in Social Protection. Geneva: International Labour Organization.
- Berthé, A., L. Berthé-Sanou, B. Konaté, H. Hien, F. Tou, S. Somda, I. Bamba, M. Drabo, F. Badini-Kinda, and J. Macq. 2013. “‘The Unmet Needs of the Elderly Living with Functional Disabilities in Bobo-Dioulasso (Burkina Faso)’.” Revue d’Epidemiologie et de Sante Publique 6 (6): 531–537. doi:10.1016/j.respe.2013.07.682.
- Bloom, D. E., D. Canning, and J. Sevilla. 2003. “The Demographic Dividend.” RAND
- Database on the Households and Living Arrangements of Older People. 2019b. Rwanda. https://population.un.org/LivingArrangements/index.html#x00!/countries/646
- Deaton, A. 1997. The Analysis of Household Surveys. Washington DC: World Bank.
- Deaton, A., and C. Paxson. 1998. “Economies of Scale, Household Size, and the Demand for Food.” Journal of Political Economy 106 (5): 5. doi:10.1086/250035.
- Dorfman, M. 2015. “Pension Patterns in Sub-Saharan Africa” Social Protection and Labor Discussion Paper.” Number 1503, Washington DC: World Bank.
- Ferreira. M., and P. Lindgren. 2008. Elder Abuse and Neglect in South Africa: A Case of Marginalization, Disrespect, Exploitation and Violence. Journal of Elder Abuse & Neglect 20 (2): 91–107. doi: 10.1080/08946560801974497
- Groth, H., and J. May, eds. 2017. Africa’s Population: In Search of a Demographic Dividend. Cham: Springer.
- Guven, M., and P. Liete. 2016. “Benefits and Costs of Social Pensions in Sub-Saharan Africa”. Social Protection and Labour Discussion Paper No. 1607. Washington, DC: World Bank.
- HelpAge International. 2020. “Pension Watch.” http://www.pension-watch.net/country-fact-file/
- HelpAge International/African Union (HelpAge/AU). 2003. AU Policy Framework and Plan of Action on Ageing. Nairobi: HelpAge International Africa Regional Development Centre.
- International Labour Organization (ILO). 2017. World Social Protection Report 2017–2019. Geneva: ILO.
- Kakwani, N., and K. Subbarao. 2005. Ageing and Poverty in Africa and the Role of Social Pensions. United Nations Development Fund (UNDP) International Poverty Centre, Working Paper. Vol. 8. New York: UNDP.
- Knodel, J., and M. B. Ofstedal. 2003. “Gender and Aging in the Developing World: Where are the Men?” Population and Development Review 29 (4): 677–698. doi:10.1111/j.1728-4457.2003.00677.x.
- Lee, R., A. Mason, and D. Cotlear. 2010. “Some Economic Consequences of Global Aging: A Discussion Note for the World Bank.” HNP Discussion Paper, Washington, DC: World Bank.
- Lloyd-Sherlock, P., M. McKee, S. Ebrahim, M. Gorman, S. Greengross, M. Prince, and R. Pruchno et al. 2012 “Population ageing and health.” The Lancet 379 (9823): 1295–1296.
- Lloyd-Sherlock, P., and A. Barrientos. 2002. “Nussbaum, Capabilities and Older People.” Journal of International Development 14 (8): 1163–1173. doi:10.1002/jid.958.
- Lloyd-Sherlock, P., and S. Agrawal. 2014. “Pensions and the Health of Older People in South Africa. Is There an Effect?” Journal of Development Studies 50 (11): 1570–1586. doi:10.1080/00220388.2014.936399.
- Marie Albertine, D., and D. Van de Walle. 2018. “Marital Shocks and Women’s Welfare in Africa.” World Bank Policy Research Working Paper 8306.
- Mason, A., and R. Lee. 2006. “Reform and Support Systems for the Elderly in Developing Countries: Capturing the Second Demographic Dividend.” Genus 62 (2): 11–35.
- Musahara, H. 2006. “Improving Tenure Security For The Rural Poor. Rwanda – Country Case Study” FAO Support to the Legal Empowerment of the Poor (LEP) Working Paper #x007.
- NISR and MINECOFIN. 2012. National Institute of Statistics of Rwanda (NISR), Ministry of Finance and Economic Planning (MINECOFIN) [Rwanda], 2012. Rwanda Fourth Population and Housing Census. Kigali, Rwanda: NISR and MINECOFIN.
- NISR. 2012. Evolution of Poverty in Rwanda 2000-2011: Results from the Household Surveys (EICV). Kigali, Rwanda: NISR. https://www.statistics.gov.rw/publication/evolution-poverty-rwanda-2000-2011-results-household-surveys-eicv
- Payne, C. F., J. Mkandawire, and H. P. Kohler. 2013. “Disability Transitions and Health Expectancies among Adults 45 Years and Older in Malawi: A Cohort-based Model.” PLoS Medicine 10 (5): e1001435. doi:10.1371/journal.pmed.1001435.
- Polavarapu, A. 2011. “Procuring Meaningful Land Rights for the Women of Rwanda.” Yale Human Rights and Development Journal Vol. 14 (Iss. 1): 3. Article.
- Pottier, J. 2002. `italicbRe-Imagining Rwanda: Conflict, Survival and Disinformation in the Late Twentieth Century (African Studies).`/italicb Cambridge: Cambridge University Press. doi:10.1017/CBO9780511491092
- Pradesha, A., and X. Diao. 2014. “A 2011 Social Accounting Matrix.” SAM for Rwanda. Washington, DC: International Food Policy Research Institute (IFPRI). http://ebrary.ifpri.org/utils/getfile/collection/p15738coll2/id/128890/filename/129101.pdf
- Sabates-Wheeler, R., S. Yates, E. Wylde and J. Gatsinzi. 2015. ‘Challenges of Measuring Graduation in Rwanda?’. IDS Bulletin 46 (2): 103–114.
- Sagner, A., and R. Z. Mtati. (1999). “Politics of pension sharing in urban South Africa.„ Ageing and Society 4: 393–416.
- Schatz, E., and J. Seeley. 2015. “‘Gender, Ageing and Carework in East and Southern Africa.” A Review’ Global Public Health 10 (10): 1185–1200. doi:10.1080/17441692.2015.1035664.
- Schatz, E., X. Gómez-Olivé, M. Ralston, J. Menken, and S. Tollman. 2012. “‘The Impact of Pensions on Health and Wellbeing in Rural South Africa: Does Gender Matter?’.” Social Science & Medicine 75 (10): 1864–1873. doi:10.1016/j.socscimed.2012.07.004.
- Tollman, S. M., S. A. Norris, and L. F. Berkman. 2016. “Commentary: The Value of Life Course Epidemiology in Low- and Middle-income Countries: An Ageing Perspective.” International Journal of Epidemiology 45 (4): 997–999. doi:10.1093/ije/dyw109.
- Union, A. 2012. Common Africa Position on the Human Rights of Older Persons. Addis Ababa: African Union.
- Union, A. 2017. AU Roadmap on Harnessing the Demographic Dividend through Investments in Youth. Addis Ababa: African Union.
- United Nations (UN). 2002. Madrid International Plan of Action on Ageing. New York: UN.
- United Nations (UN). 2015. Transforming Our World: The 2030 Agenda for Sustainable Development. New York: UN.
- United Nations Department of Economic and Social Affairs Population Division (UNPD). 2019a. World Population Prospects: The 2019 Revision. New York: United Nations Department of Economic and Social Affairs.
- United Nations Department of Economic and Social Affairs Population Division (UNPD). 2015. World Population Prospects 2015 Revision. New York: United Nations.
- United Nations Population Division (UNPD). 2019. World Population Prospects. The 2019 Revision. New York: United Nations.
- World Health Organization (WHO). 2016. Global strategy and plan of action on ageing and health. Geneva: WHO. https://www.who.int/ageing/global-strategy/en/
Appendix
Microsimulation Model Technical Appendix
Dynamic micro-simulation methodology
Dynamic simulation models ‘age’ the dataset based on a set of key life events for each individual: mortality, marriage, household formation, fertility, education, labour force participation, earnings, savings, etc. These micro processes are calibrated with national-level parameters related to population size and urban/rural shares, so that individual estimates aggregate to realistic values. The macro model is then integrated with the micro model in a ‘top down’ manner: the macro model produces estimates for the share of labour by sector as well as an index of real factor earnings for labour (low- and high- skilled), land, and capital. In our model the base unit is the individual, although within the context of a specific household. It is a discrete time model, with each period equal to one year, extending for 30 years. To address inevitable differences in the population estimates in the sample survey compared to the census, we do a one-off calibration, whereby population weights are adjusted so that there is alignment between the EICV4 and the census by age group and sex.
The modules unfold in a sequenced order, as described below.
Mortality: Age-specific mortality assumptions come from the UN Population division estimates, which provide the number of deaths for each sex and age group for each five-year period in the model. We adjust these to annual values, and then apply stochastically to the dataset (meaning individuals in each age/gender group are selected randomly). If the aggregation of individual mortality is not in line with the expected aggregate valuesFootnotei, the model adjusts (again stochastically) to ensure overall calibration with the estimated trends.
Marriage: We first model the probability of entering the marriage market in each year using a logistic regression of currently married status on age, age squared, education level, and sex. Individuals then actually enter the market based on a Monte Carlo lottery, based on a binomial distribution with their predicted probability as the argument. The next step is then to match all those entering the marriage market with a spouse. In practice, we know that there is a high degree of homogamy, with spouses tending to have similar characteristics such as age, education levels, earnings, etc. Here we model our stochastic approach based on the one outlined by Perese (2002). The results from this process are then recalibrated with national-level age-specific marriage rates to ensure that the matching algorithm yields the expected results.
Household formation and land bequests: Given the very high rates of headship amongst married men, we assume that all children leave to form their own unit upon marriage. Women join their husband in their husband’s location, if this is different to the wife’s. We assume that parental land bequests to children are made only to male sons upon marriage, since this is currently the most common practice.
Fertility: Age- specific fertility rates are modelled based on estimates from the UN Population Division, with new births modelled stochastically based on the probability of giving birth, which is estimated using a logistic regression on age, education, and number of existing children.
Education: For individuals of school-going age (7 through 25), we model the probability of continuing education in each year. This is based on a logistic regression of age, sex, location, number of children, whether parents are present and household characteristics (consumption, head age, head female, head education). We assume that current trends prevail in terms of primary and secondary completion.
Urbanisation/migration: The rate of internal migration is given by the World Urbanization Prospects (UN Population Division), and households to migrate are selected stochastically based on estimated probabilities using a logistic regression of age and education of the household head and location (estimated coefficients are based on households who have migrated internally in the last ten years before the EICV4 survey).
Employment and earnings: Labour market participation is based on a logistic regression of employment, estimated separately for men and women, and for three different age groups. The estimated probability of participation is then used in a Monte Carlo lottery, with the total number of workers in each year selected to be consistent with labour force participation rates generated by the macro model. The model of occupational choice is then based on the structural model in Heckman & Sedlacek (1985) used in the microsimulations of Cogneau and Robilliard (2004) and Grimm (2004). In these models, individuals have a choice between (i) family work in agriculture (for those with land), (ii) self-employment; or (iii) wage work, and they choose between them based on which offers the highest potential earnings, subject to the reservation wage constraint. This standard model is adapted somewhat here to the Rwandan context, so that self-employment earnings are additional to other work (as this is often done in addition to own-account farming), and therefore the main choice is basically between household agricultural work and wage labour.
In order to incorporate constraints on the demand side, individuals first join a ‘queue’ for each sector based on their estimated likelihood of participation, and then they are allocated using a Monte Carlo lottery based on this probability, with the total number selected based on the overall share of the sector predicted by the macro CGE model. Potential earnings are estimated using a Heckman 2-stage regression to account for selection bias in sectoral participationFootnoteii. Additionally, real earnings increase for all three market segments are determined in line with the CGE model’s estimates of factor earnings for land and labour, calibrated every five years.
Consumption and poverty: Ideally, both consumption per adult equivalent (and therefore poverty) would be determined by household earnings, based on the estimated earnings and marginal propensity to consume. Unfortunately, however, earnings are estimated with a high degree of uncertainty in the EICV4 data, because wage data is not precise enough to allow a full estimation of annual earnings. Attempting to estimate poverty directly from estimated earnings would therefore be problematic. Instead, we predict both total household consumption based on a regression, and then calculate predicted per-adult equivalent consumption and povertyFootnoteiii.
Transfers to parents: Parents receive transfers from their children if their child is the head of their own household. (The model is able to maintain relationships across generations, even after children form their own household upon marriage). Transfers are estimated on the basis of a Heckman 2-stage model, to account for the fact that not all children will provide transfers, and that the value is dependent on the level of consumption of the child.
The CGE Macro Model
In terms of theoretical pedigree, the computable general equilibrium (CGE) model for Rwanda employed in this study can be characterized as a dynamic extension of a standard comparative-static single-country CGE model for a developing country in the tradition of Dervis, de Melo and Robinson (1982), Robinson et al (1999) and Lofgren et al (2002).
Benchmark Data: The model is calibrated to a social accounting matrix (SAM) which reflects the input-output structure of production, the commodity composition of demand and the pattern of income distribution for Rwanda at a disaggregated level at the start of the simulation horizon 2011. The SAM has recently been constructed at the International Food Policy Research Institute (IFPRI, 2014). Pradesha and Diao (2014) provide details of data sources and describe the SAM compilation process.
Model Calibration: The numerical calibration process involves the determination of the initial model parameters in such a way that the equilibrium solution for the benchmark year 2011 exactly replicates the benchmark SAM. The selection of values for the sectoral factor elasticities of substitution, and the target income elasticities of household demand is informed by available econometric evidence from secondary sources and uses estimates provided by the GTAP behavioral parameter database (Hertel and van der Mensbrugghe, 2016). The region-specific income elasticity estimates reported in that source for a representative single aggregated household are further differentiated across the lower and higher income households in the model. Moreover, the income elasticities are gradually shifted over time as per-capita income of households grow. Values for the elasticities of substitution between imports and domestically produced output by commodity group are drawn from Diao et al (2010: Tab. C2).
Model mechanics and assumptions: The construction of the baseline scenario starts from the 2011 benchmark equilibrium. Population and labour force growth is based on the UN DESA (2015) medium-variant projections commonly used in contemporary long-run scenario studies. The urban population share is assumed to grow in line with UN DESA (2016) projections.
The second main exogenous driver of economic growth besides labour supply growth in the model is the economy-wide total factor productivity (TFP) growth rate, which reflects the speed of autonomous technical progress. The time path for the annual TFP growth rate is determined indirectly by imposing a target growth path for Rwanda’s real gross domestic product (GDP) and by calibrating the TFP parameter of the model dynamically to match this target growth path.Footnoteiv Broadly in line with the median projections across a range of global models reported in Wiebe et al (2015) for an SSP2 scenario, the model also assumes a gradual rise in world market agricultural prices (by 20%) and processed food prices (by 5%) relative to other world market prices over the simulation horizon.
With respect to government activity, it is assumed that with rising real GDP the share of government spending in domestic absorption gradually increases from 11.8% in the initial benchmark equilibrium to 20% in 2050, and direct tax rates on capital and labour income are gradually raised correspondingly.
It is further assumed that with rising per-capita income the average propensity to save of rural households gradually rises from its initial low level of 3.5% to 10% by 2050, while the saving propensity of urban households (which is already comparatively high in the initial benchmark equilibrium) stays put at 14.8%.
References
- Dervis, K., de Melo, J. and Robinson, S. (1982) General Equilibrium Models for Development Policy. New York: Cambridge University Press. <!--${if: isGetFTREnabled}--><!--${/if:}--> <!--${ifNot: isGetFTREnabled}--><!--${/ifNot:}--><!--${if: isGetFTREnabled}--><!--${/if:}--><!--${googleScholarLinkReplacer: %00empty%00 book General+Equilibrium+Models+for+Development+Policy author%3DK.+Dervis%26author%3DJ.+de+Melo%26author%3DS.+Robinson 1982 Dervis%2C+K.%2C+de+Melo%2C+J.+and+Robinson%2C+S.+%281982%29+General+Equilibrium+Models+for+Development+Policy.+New+York%3A+Cambridge+University+Press. %00empty%00 %00null%00 %00empty%00 %00empty%00 %00empty%00 %00empty%00 %00empty%00 getFTREnabled FULL_TEXT %00empty%00}--><!--${sfxLinkReplacer: e_1_3_6_1_3_1_2_1 %00empty%00 url_ver%3DZ39.88-2004%26rft.genre%3Dbook%26rfr_id%3Dinfo%3Asid%2Fliteratum%253Atandf%26rft.aulast%3DDervis%26rft.aufirst%3DK.%26rft.date%3D1982%26rft.btitle%3DGeneral%2520Equilibrium%2520Models%2520for%2520Development%2520Policy%26rft.pub%3DCambridge%2520University%2520Press %00empty%00}-->
- Diao, X., S. Fan, S. Kanyarukiga and B. Yu (2010) Agricultural Growth and Investment Options for Poverty Reduction in Rwanda. Washington, DC: International Food Policy Research Institute. <!--${if: isGetFTREnabled}--><!--${/if:}--> <!--${ifNot: isGetFTREnabled}--><!--${/ifNot:}--><!--${if: isGetFTREnabled}--><!--${/if:}--><!--${googleScholarLinkReplacer: %00empty%00 book Agricultural+Growth+and+Investment+Options+for+Poverty+Reduction+in+Rwanda author%3DX.+Diao%26author%3DS.+Fan%26author%3DS.+Kanyarukiga%26author%3DB.+Yu 2010 Diao%2C+X.%2C+S.+Fan%2C+S.+Kanyarukiga+and+B.+Yu+%282010%29+Agricultural+Growth+and+Investment+Options+for+Poverty+Reduction+in+Rwanda.+Washington%2C+DC%3A+International+Food+Policy+Research+Institute. %00empty%00 %00null%00 %00empty%00 %00empty%00 %00empty%00 %00empty%00 %00empty%00 getFTREnabled FULL_TEXT %00empty%00}--><!--${sfxLinkReplacer: e_1_3_6_1_3_1_3_1 %00empty%00 url_ver%3DZ39.88-2004%26rft.genre%3Dbook%26rfr_id%3Dinfo%3Asid%2Fliteratum%253Atandf%26rft.aulast%3DDiao%26rft.aufirst%3DX.%26rft.date%3D2010%26rft.btitle%3DAgricultural%2520Growth%2520and%2520Investment%2520Options%2520for%2520Poverty%2520Reduction%2520in%2520Rwanda%26rft.pub%3DInternational%2520Food%2520Policy%2520Research%2520Institute %00empty%00}-->
- Hertel, T.W. and D. van der Mensbrugghe (2016) Behavioral Parameters. GTAP Resource #x005138. https://www.gtap.agecon.purdue.edu/resources/res_display.asp?RecordID=5138 <!--${if: isGetFTREnabled}--><!--${/if:}--> <!--${ifNot: isGetFTREnabled}--><!--${/ifNot:}--><!--${if: isGetFTREnabled}--><!--${/if:}--><!--${googleScholarLinkReplacer: %00empty%00 web Behavioral+Parameters.+GTAP+Resource+%23x005138. author%3DT.W.+Hertel%26author%3DD.+van+der+Mensbrugghe 2016 Hertel%2C+T.W.+and+D.+van+der+Mensbrugghe+%282016%29+Behavioral+Parameters.+GTAP+Resource+%23x005138.+5138 %00empty%00 %00empty%00 %00empty%00 %00empty%00 %00empty%00 %00empty%00 %00empty%00 getFTREnabled FULL_TEXT %00empty%00}--><!--${sfxLinkReplacer: e_1_3_6_1_3_1_4_1 %00empty%00 url_ver%3DZ39.88-2004%26rft.genre%3Dweb%26rfr_id%3Dinfo%3Asid%2Fliteratum%253Atandf%26rft.aulast%3DHertel%26rft.aufirst%3DT.W.%26rft.date%3D2016%26rft.spage%3D5138 %00empty%00}-->
- Grimm Michael (2004) “The Medium- and Long-Term Effects of an Expansion of Education on Poverty in Côte D’Ivoire: A Dynamic Microsimulation Study”. </R>UNU-WIDER Research PaperNo. 2004/32., <!--${if: isGetFTREnabled}--><!--${/if:}--> <!--${ifNot: isGetFTREnabled}--><!--${/ifNot:}--><!--${if: isGetFTREnabled}--><!--${/if:}--><!--${googleScholarLinkReplacer: %00empty%00 book %E2%80%9CThe+Medium-+and+Long-Term+Effects+of+an+Expansion+of+Education+on+Poverty+in+C%C3%B4te+D%E2%80%99Ivoire%3A author%3DGrimm+Michael 2004 Grimm+Michael+%282004%29+%E2%80%9CThe+Medium-+and+Long-Term+Effects+of+an+Expansion+of+Education+on+Poverty+in+C%C3%B4te+D%E2%80%99Ivoire%3A+A+Dynamic+Microsimulation+Study%E2%80%9D.+%3C%2FR%3EUNU-WIDER+Research+PaperNo.+2004%2F32.%2C %00empty%00 %00null%00 %00empty%00 %00empty%00 %00empty%00 %00empty%00 %00empty%00 getFTREnabled FULL_TEXT %00empty%00}--><!--${sfxLinkReplacer: e_1_3_6_1_3_1_5_1 %00empty%00 url_ver%3DZ39.88-2004%26rft.genre%3Dbook%26rfr_id%3Dinfo%3Asid%2Fliteratum%253Atandf%26rft.aulast%3DMichael%26rft.aufirst%3DGrimm%26rft.date%3D2004%26rft.atitle%3D%25E2%2580%259CThe%2520Medium-%2520and%2520Long-Term%2520Effects%2520of%2520an%2520Expansion%2520of%2520Education%2520on%2520Poverty%2520in%2520C%25C3%25B4te%2520D%25E2%2580%2599Ivoire%253A%26rft.btitle%3DA%2520Dynamic%2520Microsimulation%2520Study%25E2%2580%259D.%2520%253C%252FR%253EUNU-WIDER%2520Research%2520PaperNo.%25202004%252F32. %00empty%00}-->
- Heckman and Sedlacek (1985) “Heterogeneity, Aggregation, and Market Wage Functions: An Empirical Model of Self-Selection in the Labor Market”. Journal of Political Economy, 93:1077–25. <!--${if: isGetFTREnabled}-->
- IFPRI (2014) Rwanda Social Accounting Matrix (SAM), 2011. Washington, DC: International Food Policy Research Institute. [dataset]. (accessed 23 May 2017)http://dx.doi.org/10.7910/DVN/28532. <!--${if: isGetFTREnabled}--><!--${/if:}--> <!--${ifNot: isGetFTREnabled}--><!--${/ifNot:}--><!--${if: isGetFTREnabled}--><!--${/if:}--><!--${googleScholarLinkReplacer: %00empty%00 web Rwanda+Social+Accounting+Matrix+%28SAM%29%2C+2011.+Washington%2C+DC%3A+International+Food+Policy+Research+Institute.+%5Bdataset%5D.+%28accessed+23+May+2017%29 %00empty%00 2014 IFPRI+%282014%29+Rwanda+Social+Accounting+Matrix+%28SAM%29%2C+2011.+Washington%2C+DC%3A+International+Food+Policy+Research+Institute.+%5Bdataset%5D.+%28accessed+23+May+2017%29. %00empty%00 %00empty%00 %00empty%00 %00empty%00 %00empty%00 %00empty%00 %00empty%00 getFTREnabled FULL_TEXT %00empty%00}--><!--${sfxLinkReplacer: e_1_3_6_1_3_1_7_1 %00empty%00 url_ver%3DZ39.88-2004%26rft.genre%3Dweb%26rfr_id%3Dinfo%3Asid%2Fliteratum%253Atandf%26rft.aucorp%3DIFPRI%26rft.date%3D2014 %00empty%00}-->
- Lofgren, H., R.L. Harris, S. Robinson with M. Thomas and M. El-Said (2002) A Standard Computable General Equilibrium (CGE) Model in GAMS. Microcomputers in Policy Research 5. Washington, DC: International Food Policy Research Institute. <!--${if: isGetFTREnabled}--><!--${/if:}--> <!--${ifNot: isGetFTREnabled}--><!--${/ifNot:}--><!--${if: isGetFTREnabled}--><!--${/if:}--><!--${googleScholarLinkReplacer: %00empty%00 book A+Standard+Computable+General+Equilibrium+%28CGE%29+Model+in+GAMS author%3DH.+Lofgren%26author%3DR.L.+Harris%26author%3DS.+Robinson+with%26author%3DM.+Thomas%26author%3DM.+El-Said 2002 Lofgren%2C+H.%2C+R.L.+Harris%2C+S.+Robinson+with+M.+Thomas+and+M.+El-Said+%282002%29+A+Standard+Computable+General+Equilibrium+%28CGE%29+Model+in+GAMS.+Microcomputers+in+Policy+Research+5.+Washington%2C+DC%3A+International+Food+Policy+Research+Institute. %00empty%00 %00null%00 %00empty%00 %00empty%00 %00empty%00 %00empty%00 %00empty%00 getFTREnabled FULL_TEXT %00empty%00}--><!--${sfxLinkReplacer: e_1_3_6_1_3_1_8_1 %00empty%00 url_ver%3DZ39.88-2004%26rft.genre%3Dbook%26rfr_id%3Dinfo%3Asid%2Fliteratum%253Atandf%26rft.aulast%3DLofgren%26rft.aufirst%3DH.%26rft.date%3D2002%26rft.atitle%3DA%2520Standard%2520Computable%2520General%2520Equilibrium%2520%2528CGE%2529%2520Model%2520in%2520GAMS%26rft.btitle%3DMicrocomputers%2520in%2520Policy%2520Research%26rft.volume%3D5%26rft.pub%3DInternational%2520Food%2520Policy%2520Research%2520Institute %00empty%00}-->
- Pradesha, A. and X. Diao (2014)2011 A Social Accounting Matrix (SAM) for Rwanda. Washington, DC: International Food Policy Research Institute. http://ebrary.ifpri.org/utils/getfile/collection/p15738coll2/id/128890/filename/129101.pdf (accessed 23 May2017). <!--${if: isGetFTREnabled}--><!--${/if:}--> <!--${ifNot: isGetFTREnabled}--><!--${/ifNot:}--><!--${if: isGetFTREnabled}--><!--${/if:}--><!--${googleScholarLinkReplacer: %00empty%00 journal 2011+A+Social+Accounting+Matrix+%28SAM%29+for+Rwanda author%3DA.+Pradesha%26author%3DX.+Diao 2014 Pradesha%2C+A.+and+X.+Diao+%282014%292011+A+Social+Accounting+Matrix+%28SAM%29+for+Rwanda.+Washington%2C+DC%3A+International+Food+Policy+Research+Institute.+http%3A%2F%2Febrary.ifpri.org%2Futils%2Fgetfile%2Fcollection%2Fp15738coll2%2Fid%2F128890%2Ffilename%2F129101.pdf+%28accessed+23+May2017%29. %00empty%00 Washington%2C+DC%3A+International+Food+Policy+Research+Institute.+http%3A%2F%2Febrary.ifpri.org%2Futils%2Fgetfile%2Fcollection%2Fp15738coll2%2Fid%2F128890%2Ffilename%2F129101.pdf+%28accessed+23+May2017 %00empty%00 %00null%00 %00empty%00 %00empty%00 %00null%00 getFTREnabled FULL_TEXT %00empty%00}--><!--${sfxLinkReplacer: e_1_3_6_1_3_1_9_1 %00empty%00 url_ver%3DZ39.88-2004%26rft.genre%3Darticle%26rfr_id%3Dinfo%3Asid%2Fliteratum%253Atandf%26rft.aulast%3DPradesha%26rft.aufirst%3DA.%26rft.date%3D2014%26rft.atitle%3D2011%2520A%2520Social%2520Accounting%2520Matrix%2520%2528SAM%2529%2520for%2520Rwanda%26rft.jtitle%3DWashington%252C%2520DC%253A%2520International%2520Food%2520Policy%2520Research%2520Institute.%2520http%253A%252F%252Febrary.ifpri.org%252Futils%252Fgetfile%252Fcollection%252Fp15738coll2%252Fid%252F128890%252Ffilename%252F129101.pdf%2520%2528accessed%252023%2520May2017 %00empty%00}-->
- Robinson, S., A. Yunez-Naude, R. Hinojosa-Ojeda, J.D. Lewis and S. Devarajan (1999) From Stylized to Applied Models: Building Multisectoral CGE Models for Policy Analysis. North American Journal of Economics and Finance 10, 5–38. <!--${if: isGetFTREnabled}-->
- United Nations Department of Economic,and Social Affairs Population Division (UNPD) (2015) World Population Prospects: The2015 Revision. United Nations Department of Economic and Social Affairs. <!--${if: isGetFTREnabled}--><!--${/if:}--> <!--${ifNot: isGetFTREnabled}--><!--${/ifNot:}--><!--${if: isGetFTREnabled}--><!--${/if:}--><!--${googleScholarLinkReplacer: %00empty%00 book %3A+The2015+Revision.+United+Nations+Department+of+Economic+and+Social+Affairs %00empty%00 2015 United+Nations+Department+of+Economic%2Cand+Social+Affairs+Population+Division+%28UNPD%29+%282015%29+World+Population+Prospects%3A+The2015+Revision.+United+Nations+Department+of+Economic+and+Social+Affairs. %00empty%00 %00null%00 %00empty%00 %00empty%00 %00empty%00 %00empty%00 %00empty%00 getFTREnabled FULL_TEXT %00empty%00}--><!--${sfxLinkReplacer: e_1_3_6_1_3_1_11_1 %00empty%00 url_ver%3DZ39.88-2004%26rft.genre%3Dbook%26rfr_id%3Dinfo%3Asid%2Fliteratum%253Atandf%26rft.aucorp%3DUnited%2520Nations%2520Department%2520of%2520Economic%252Cand%2520Social%2520Affairs%2520Population%2520Division%2520%2528UNPD%2529%26rft.date%3D2015%26rft.btitle%3D%253A%2520The2015%2520Revision.%2520United%2520Nations%2520Department%2520of%2520Economic%2520and%2520Social%2520Affairs %00empty%00}-->