
 ?Mathematical formulae have been encoded as MathML and are displayed in this HTML version using MathJax in order to improve their display. Uncheck the box to turn MathJax off. This feature requires Javascript. Click on a formula to zoom.
Abstract
With increasing traffic demand in urban areas of metropolises, many tunnels have been constructed to improve road capacity and traffic mobility. The distance between two consecutive tunnels is relatively short which usually forms a weaving section, leading to considerable traffic conflicts. The objective of this study is to evaluate the safety performance of such inter-tunnel sections. Conflict prediction models based on negative binomial regression were developed to identify influential factors. Field data were collected at ten selected sites in Nanjing, China, and used for calibrating and validating the proposed models. Two types of inter-tunnel weaving sections (type 1 and type 2) were found in the field with distinct lane markings and operation rules. The unique lane markings in type 1 weaving sections are designed to isolate weaving traffic flows and thus reduce conflicts, but in practice, contradictory to its design intention, lead to more traffic conflicts compared with type 2 weaving sections. In addition, the length of the diverging section, merging section, and whole weaving section are found to be significant influencing factors on the conflict occurrence. The findings in the present study are expected to help engineer better design inter-tunnel sections.
1. Introduction
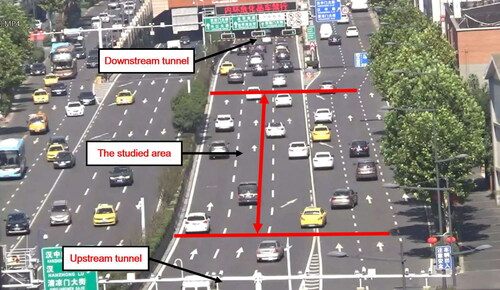
Numerous tunnels have been constructed in metropolises for various reasons, such as navigational and construction expenses considerations (Beard, Citation2010; PIARC Technical Committee C3.3 Road Tunnel Operation, Citation2008). The closed form of tunnels enables smooth and uninterrupted traffic flows but also has to be broken regularly for entrance and exit needs, especially in long tunnels. In current practice, such entrance and exit sections are usually integrated and relatively short that in-tunnel and off-tunnel vehicles may interact heavily, as shown in . Traffic movements in those inter-tunnel sections are quite similar to their counterparts in highway weaving sections and, therefore, will be referred to as “inter-tunnel weaving sections” in the following paper. One common feature in both inter-tunnel and highway weaving sections is that they are bottlenecks in road networks and thus have higher likelihood of viewing traffic conflicts and accidents, compared with basic road segments (Abdel-Aty, Uddin, & Pande, Citation2005; Chen & Ahn, Citation2018; Lee & Cassidy, Citation2009; Zhao & Liu, Citation2016), but the former has its own uniqueness in geometric design, driver behavior, etc. However, the traffic safety performance and influencing factors at inter-tunnel weaving sections are rarely investigated in existing studies. To this end, this paper will focus on evaluating the traffic safety performance of inter-tunnel weaving sections with the purpose of understanding traffic safety mechanisms and proposing better design strategies. Existing studies in related areas can be generally divided into three categories: driving behavior modeling, geometric design strategies, and safety performance evaluation.
Figure 1. Field picture of the studied area.
Driving behaviors in weaving sections are found to be quite different from that of basic highway sections due to interactions between weaving and non-weaving vehicles (Hidas, Citation2005; Laval & Daganzo, Citation2006; Laval & Leclercq, Citation2008). To better understand behavior patterns, many studies have been conducted to model driving behaviors at merging, diverging, and weaving area sections (Ahammed, Hassan, & Sayed, Citation2008; Chen, Zhou, Zhao, & Hsu, Citation2011; Liu, Chen, Lu, & Cao, Citation2010; Zhang, Yan, An, & Zhao, Citation2015). Sarvi (Citation2013) applied a theoretical framework using the stimuli-response psychophysical concept to mode the acceleration-deceleration behavior of weaving vehicles under heaving traffic conditions. It was found that surrounding vehicles significantly affect the acceleration behavior of weaving vehicles during passing through the weaving section. Yun, Zhao, Zhao, Weng, and Yang (Citation2017) studied the influence of in-vehicle navigation information on lane-changing behaviors at urban expressway diverging sections and compared with that of traditional road signs. Six indexes of lane-change behaviors were used to analyze lane changing characteristics, which were merging gap, position, delay, steering angle, and safe distance. The results showed that the in-vehicle navigation information had significant positive effects on lane-changing behaviors under medium to high-density conditions but less effective under light density conditions. The study of van Beinum, Farah, Wegman, and Hoogendoorn (Citation2018) showed that lane changes caused by merging and diverging vehicles create most turbulence – an increase in the amount of traffic leads to a higher level of turbulence, and larger available space for merging and diverging results in the lower level of turbulence. Tilg, Yang, and Menendez (Citation2018) further considered the automated vehicle (AV) and proposed a multiclass hybrid model and a simulation-based optimization framework to study how AV technology can improve the stability of the operation and increase the capacity of weaving sections.
Other researchers compared the traffic safety performance between various weaving sections with different geometric designs (Liu, Lu, & Chen, Citation2008; Qi, Chen, & Liu, Citation2015; Xu, Liu, Wang, & Li, Citation2014; Xu, Tarko, Wang, & Liu, Citation2013). According to Highway Capacity Manual (HCM, Citation2010), there are three types of highway weaving sections, named type A, B, and C, in terms of the minimum lane change of weaving vehicles. Each vehicle of merging or diverging streams in type A weaving sections only needs to perform one lane change to reach their target lanes, which is similar to inter-tunnel weaving sections. In type B weaving sections, either merging or diverging can be done without changing lanes or when a weaving stream only changes one lane. In type C weaving sections, a weaving maneuver needs at least two lane changes. Golob, Recker, and Alvarez (Citation2004) found that the crash severity does not have a huge disparity between highway basic segments and weaving areas, but there are differences between the three types of weaving sections. They found that traffic accidents happened in type A weaving section is the least serious, while that in type B weaving section is the worst. Pulugurtha and Bhatt (Citation2010) found that type A weaving section tends to be relatively safer compared with other types because there are less improper lane changes and less influence from non-weaving vehicles. The results also showed that the number of crashes tends to decrease with the increase of the length of the weaving section and traffic demand. De Blasiis, Diana, and Veraldi (Citation2018) conducted a risk assessment from the drivers’ perspective using the driving simulator to study the influence of the different length of weaving lanes under various traffic flow conditions on traffic safety. It was found that a highly developed weaving lane could induce risk conditions. Drivers that prefer to brake in each weaving action under high volume condition also results in more conflicts. A weaving lane design method was also proposed based on drivers’ perception.
Meanwhile, substantial efforts have also been made in evaluating the safety performance of the whole weaving section with statistical methods (Caliendo, Guida, & Parisi, Citation2007; El-Basyouny & Sayed, Citation2009; Zhu, Xu, Yan, & Luo, Citation2008). Hossain and Muromachi (Citation2013) used the Bayesian belief net to develop a real-time crash prediction model for the ramp vicinities of urban expressways. Four models were built for upstream and downstream of the entrance and exit ramp separately. The precision of predicting future crashes under 10% false rate was around 50%. Wang, Abdel-Aty, Shi, and Park (Citation2015) applied a multilevel Bayesian logistic regression model for predicting crashes at weaving sections using crash, geometric, Microwave Vehicle Detection System, and weather data. The findings show that the mainline speed at the start of the weaving section, the speed difference between the beginning and end of the weaving section, and the logarithm of volume have significant impacts on the crash risk of the following 5–10 min. Kim and Park (Citation2018) investigated the crash distribution in freeway weaving sections with a buffer-separated HOV lane. They found that the weaving area with an access point on the buffer lane shows lower crash rates than that without one. Mao, Yuan, Gan, and Zhang (Citation2019) explored the risk factors affecting the traffic safety of interchange weaving sections. They developed crash prediction models using the multinomial logistic regression approach. The results showed that the drivers’ gender and age, weather, traffic density, weaving ratio, speed, and lane-change behavior have significant influences on accident occurrences. Li, Xu, Xing, and Wang (Citation2017) evaluated the impacts of four types of car following situations on rear-end crash risks at the freeway weaving section using trajectory data and logistic regression models. The results showed that the crash risks of different car-following situations varied when setting different time-to-collision thresholds.
As traffic accidents are rare and the reported data is not accurate enough, there are also studies investigating whether surrogate safety analysis methods can reflect traffic safety to a reliable extent. Therefore, driving simulators and conflict methods have gained much popularity in evaluating safety in the weaving area (Abdel-Aty & Wang, Citation2017; Gettman & Head, Citation2003; Sayed, Zaki, & Autey, Citation2013; Zheng & Ismail, Citation2017). In pioneering works, time-to-collision (TTC) (Hayward, Citation1971) and post encroachment time (PET) (Cooper, Citation1984) were proposed to set a threshold for defining conflicts. Cai, Saad, Abdel-Aty, Yuan, and Lee (Citation2018) used a microsimulation and driving simulator to investigate the safety impact of weaving distance on freeway facilities with managed lanes. Yuan, Abdel-Aty, Cai, and Lee (Citation2019) investigated the mandatory lane-changing behaviors during consecutive lane changes at the entrance and exit weaving sections in a driving simulator. The results suggested the preferable weaving length per lane change for ingress and egress of the managed lane in the highway weaving area. It also indicated that peak traffic conditions could significantly increase the difficulty of lane change and speed harmonization would considerably improve the safety of changing lane at the entrance of the weaving section. Pan, Lam, Sumalee, and Zhong (Citation2016) developed a mesoscopic multilane model, which could simulate mandatory and discretionary lane-changing behaviors simultaneously and capture realistic multilane traffic dynamics. The model considered lane-specific fundamental diagrams to simulate dynamic heterogeneous lane flow distributions on the expressway. The model can be deployed as a simple simulation tool when accessing lane change behaviors and predicting the impact of traffic incidents in the weaving section.
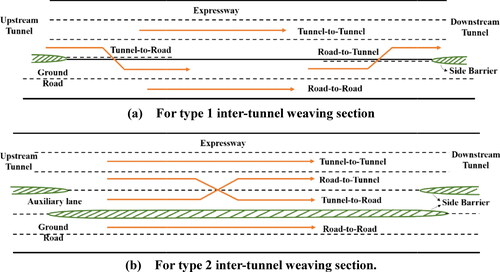
Inter-tunnel weaving sections, even with great similarities to highway weaving sections, have their own uniqueness in terms of geometric design, driving behavior, traffic movements, etc. Specifically, in highway weaving sections, weaving vehicles can change lanes at any location, but in certain inter-tunnel sections, the weaving section is segregated into three subsections to spatially separate merging and diverging vehicles, as shown in . Therefore, existing studies on highway weaving sections cannot be directly applied in inter-tunnel weaving sections.
Figure 2. Traffic movements of two kinds of inter-tunnel weaving section.
As for tunnels, most studies concentrated on safety performance in interior tunnel areas (Amundsen & Ranes, Citation2000; Caliendo, De Guglielmo, & Russo, Citation2019; Caliendo & De Guglielmo, Citation2012). Caliendo, De Guglielmo, and Guida (Citation2013) used monitoring traffic data from 2006 to 2009 in Italy and corresponding crash data to develop a crash prediction model for road tunnels. Meng, Qu, Wang, Yuanita, and Wong (Citation2011) and Meng, Qu, Yong, and Wong (2011) conducted research on the quantitative risk assessment (QRA) model for urban tunnels. Meng and Qu (Citation2012) studied how to use time-to-collision (TTC) data for estimating the frequency of rear-end crashes in urban road tunnels. Other researchers also studied the driving behavior in tunnels (Calvi, De Blasiis, & Guattari, Citation2012; Calvi and D’amico, 2013). In conclusion, the traffic safety performance and influencing factors were barely addressed in existing studies.
To this end, this paper aims to evaluate the safety of the inter-tunnel weaving section by estimating the conflicts as a predictive function of influencing variables, such as traffic flow and geometric data. Field data were collected in 10 inter-tunnel weaving sections in Nanjing, China. Conflict predictive models were built for different types of weaving sections with Bayesian Negative Binomial regression methods, respectively.
The remainder of this paper will be organized as follows. The second section shows how the field data were collected and descriptive analysis. The third section introduces the methodology used for traffic conflict modeling. The fourth section presents the results of four crash prediction models. The conclusion is provided in the last section.
2. Data collection and statistics analysis
Field data were collected in Nanjing, China. Two types of inter-tunnel weaving sections were found, as shown in , which will be referred to as type 1 and type 2, respectively. In total, 10 inter-tunnel weaving sections were selected for field data collection, consisting of 8 type 1 weaving sections and 2 type 2 weaving sections. In all selected sites, three types of data including geometric design, traffic flow, and traffic conflicts are collected, which will be elaborated in the following subsections.
2.1. Geometric design and traffic flow data
The geometric structure for both types of weaving sections is illustrated in . One main difference between the two kinds of inter-tunnel weaving sections is that type 2 inter-tunnel weaving section has a side barrier separating the expressway and ground road, along with an auxiliary lane on the expressway. For simplification, the mainline connecting upstream and downstream tunnels will be entitled to the tunnel expressway, while the surface road connecting to tunnels will be referred to the ground road. There are four traffic movements in the inter-tunnel weaving section, where two weaving traffic streams, i.e., Road-to-Tunnel flow and Tunnel-to-Road flow, will be denoted as merging flow and diverging flow, respectively.
To better analyzing heterogeneous driving behaviors in different weaving sections, we divided type 1 inter-tunnel weaving section into three sections (two sub-sections in each section) due to different lane markings and traffic operations, as shown in . The blue lines are transects indicating the beginning and end of each sub-section. In the diverging section and the merging section, only lane changes from the dashed line side are allowed; in the middle section, lane changes from both sides are forbidden. For the type 2 inter-tunnel weaving section, as shown in , the single dashed line over the whole length indicates that weaving vehicles can change lanes at any location. Thus, traffic data were collected at three transects in type 2 inter-tunnel weaving sections, which are located at the beginning, middle, and end of the weaving section, denoted with blue lines in .
Figure 3. Subsection division of two types of inter-tunnel weaving section.
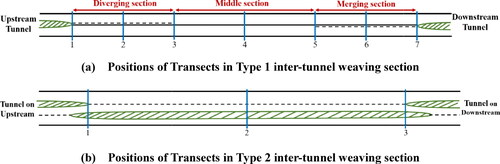
The geometric data for all selected sites were presented in , including the length, width, number of lanes, lane marking types, and whether the weaving section is curved or straight. The length of all selected weaving sections, which is measured as the distance from transect 1 to transect 7 in type 1 inter-tunnel weaving sections and the distance from transect 1 to transect 3 in type 2 inter-tunnel weaving section, is denoted as Lw, varying from 120 m to 318 m with a mean of 202.5 m and a standard deviation of 76.27 m. All weaving sections have similar pavement conditions and all videos were taken under good weather conditions. Video cameras were placed on the top of a roadside building with a clear view of the studied area. Videos were taken during weekdays containing peak and non-peak hours in July 2017. A total of ten hours of videos was used in the study.
Table 1. Selected weaving sections and geometric characteristics.
The traffic data include traffic volume, speed, headway, and are aggregated in a 5-min interval. For traffic volume, the number of vehicles passing each of the seven transects were collected and marked as the upstream and downstream volume of each subsection. The weaving volume is considered as the total number of diverging and merging vehicles in each subsection. The space-mean speed is used as the average speed of sample vehicles in each subsection. Sample vehicles were randomly selected from the total traffic volume, with a sample size of 50 vehicles over 5mins. Headway is calculated as the absolute time difference of the first vehicle and the immediate following vehicle crossing the same transect. The average headway at each transect is the mean value of all sample vehicles on three lanes on the main road.
2.2. Data for conflict
A traffic conflict is an event involving two or more road users, in which the action of one road user causes others to make an evasive maneuver to avoid a collision (Traffic conflict techniques for safety and operations – observers manual). According to the manual and Bai, Liu, Chen, Zhang, and Wang (Citation2013), there are two types of conflict in same-direction traffic flows, i.e., same-direction conflicts and lane-change conflicts. A same-direction conflict occurs when the first vehicle slows and or changes direction and places the following vehicle in danger of a rear-end collision. A lane-change conflict occurs when the first vehicle changes its lane, thus placing the following vehicle in the new lane in danger of a rear-end or sideswipe collision. On both occasions, the second vehicle brakes or swerves to avoid the collision then continues to proceed with its original path.
Those two kinds of conflicts could be subdivided into six types of conflicts according to the direction of the leading vehicles’ head, as shown in . For same-direction conflicts, they are (1) slow-vehicle, same-direction conflicts, (2) left-turn, same-direction conflict, and (3) right-turn, same-direction conflict. For lane-change conflicts, three sub-types are (1) left lane change conflict, (2) right lane change, and (3) opposite lane change conflict. All conflict types are named according to the manual. There were also secondary conflicts observed when investigating videos. A secondary conflict occurs in a foregoing conflict situation when the second vehicle makes an evasive maneuver, which may place another road user (a third vehicle) in danger of a collision. This paper did not address the second conflict particularly and classified it into slow-vehicle, same-direction conflicts. presents the description and amount of each type of conflict.
Figure 4. Types of conflicts.
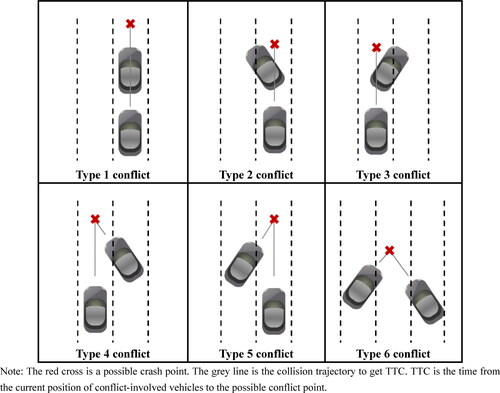
Table 2. Six conflicts types.
Observed evasive actions, such as braking, swerving, and deceleration, are considered as identifications of traffic conflicts. Swerving usually occurs when the first car suddenly decelerates, and the distance between the first and the immediate following car is very short. Braking light is a natural sign of deceleration. It should be noted that if there is congestion, i.e., almost all vehicles are moving slowly with braking lights on, only the earliest conflict of each lane and the corresponding secondary conflict would be recorded.
Conflict data include the conflict location, time to collision (TTC), and traffic flow data. The method of identifying traffic conflicts proposed in the HCM and Bai et al. (Citation2013) was applied when identifying traffic conflicts. To ensure consistency of conflict data, only one trained student was designated to review all videos from the beginning to the end. Videos were reviewed several times to avoid errors brought by the human examiner. Conflict data were also aggregated in a 5-min interval in each subsection. The TTC of conflicts varied from 0.1 to 3.2 s with an average of 1.2 s.
2.3. Descriptive analysis
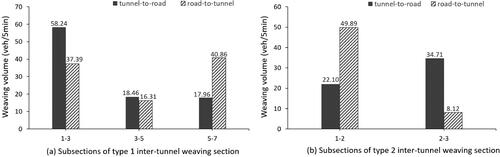
Data of 28,717 vehicles containing 17,505 weaving vehicles were recorded. The traffic volume of one subsection ranges from 126 to 401 with a mean of 259.36 and a standard deviation of 51.84 vehicles per 5 min. As can be seen from , in type 1 inter-tunnel weaving section, the traffic volume in the tunnel expressway decreased in the diverging section, remained constant in the middle section and increased in the merging section. This indicates that most drivers complied with the rules regulated by lane markings. In type 2 inter-tunnel weaving section, the trend was inverse, which informs us that those two types of weaving sections have different operational features, and thus need different models. further demonstrates our conclusion with detailed weaving volume in various positions. It is also noticeable that in type 1 weaving section, even the majority of drivers followed the lane marking rules, the number of violating ones is still considerable.
Figure 5. Distribution of total traffic volume over the inter-tunnel weaving section.
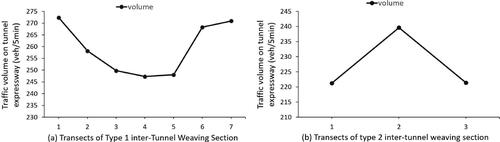
Figure 6. Distribution of weaving traffic volume over the inter-tunnel weaving section.
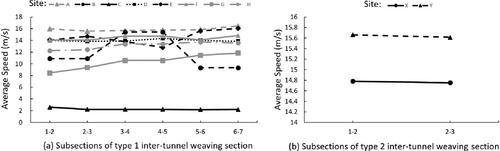
shows the average speed of vehicles on tunnel expressway at all selected sites. As shown in the figure, the average speed at most sites, even though with some fluctuations, are in a reasonable range from 8.43 m/s to 16.44 m/s. One exception exists at Site C, where the average speed is considerably low, ranging from 2.18 m/s to 2.60 m/s. This is because Site C was in congestion during the field data collection. More specifically, the average speed in type 1 inter-tunnel weaving sections varies significantly from one site to another. The average vehicle speed at Site B firstly rises from the diverging section to the middle section and subsequently decreases from the middle section to the merging section. The trend of average speed at Site E is opposite to that at Site B, with a slight difference in fluctuation range. For all the other 5 sites (type 1 inter-tunnel weaving sections), vehicles tend to slightly increase their speed when driving downstream. For type 2 inter-tunnel weaving sections, the average speed in both sites is almost the same between the upstream and the downstream section. Since the trends of average speed are not consistent in all selected sites, the relationship between speed and conflict is not conclusive and needs further analysis.
Figure 7. The speed variation along the inter-tunnel weaving section.
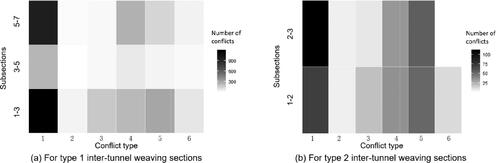
shows the occurrence summary of different types of conflict observed in all selected sites. Slow-vehicle, same-direction conflicts (type-1 conflict) are dominant, followed by type-5 conflict (right lane change), and type-2 conflicts (left-turn, same-direction conflicts) were most rarely observed. These trends were identical in both types of inter-tunnel weaving sections. As for spatial distribution, conflict mainly occurred in the diverging and merging section of type 1 inter-tunnel weaving section, and the number of conflicts in the former was slightly more than that of the latter. The number of traffic conflicts in the middle section of the type 1 weaving section was rarely. A possible reason is that there is a solid line between the tunnel and ground road, indicating that lane changes are not allowed. Thus, ineffective lane changes are greatly reduced, and so does the occurrence of conflicts.
Figure 8. Spatial distribution of different types of conflicts in type 1 and type 2 inter-tunnel weaving section.
3. Methodology
Generalized linear regression along with Bayesian data analysis was applied when developing conflict prediction models. Section 3.1 and 3.2 will introduce the formulation of the conflict prediction model and Bayesian regression.
3.1. Conflict prediction model
Conflict prediction models have been extensively used for traffic safety performance evaluation. The prediction models investigate the relationship between influencing factors, such as traffic volume, speed, and geometric design characteristics, and traffic conflicts. In the present study, candidate variables considered were presented in . Since traffic conflict is a discrete variable, the generalized linear regression model is adopted in this study, as shown in EquationEquations (1)–(3) (Bayesian data analysis, the third edition, 2013).
(1)
(1)
(2)
(2)
(3)
(3)
where, X is the matrix of explanatory variables with n × p dimensions, in which n is the number of data points and p is the number of units of variable. β is the coefficient of explanatory variable matrix X. η is the linear predictor; the link function is denoted by g(*) which relates the linear predictor to the variable matrix X; and μ is the mean value of the number of conflicts, y.
Table 3. Candidate variables in the model.
However, the conventional regression model has the inherent limitation of fixed coefficient values, which cannot fully reflect the dynamic impacts of influencing factors on traffic conflicts under different traffic conditions and cannot reveal the differences between various sites. To this end, the Bayesian approach and hierarchical models are adopted for the model formulation, where coefficients are presented with distributions instead of constant values. Besides, to better demonstrate the random effect of different weaving sections, fixed- and random-intercept models are developed, respectively, to identify whether different sites have diverse influences on conflict occurrence. The fixed-effect model assumes that all sites in the same type of inter-tunnel weaving section have similar effects on traffic conflicts, while the random-effect model considers that the mechanism could be different across different sites of the same type.
In total, eight conflict prediction models were developed to investigate traffic safety performances at different locations of inter-tunnel weaving sections; four are fixed-effect models and four are random-effect models. Firstly, due to the huge geometric difference between type 1 and type 2 weaving section, their conflict prediction models are developed, respectively, which will be referred to Model I and Model II in the ensuing paper. In these two models, all conflicts occurred over the whole inner-tunnel area are considered, regardless of the specific location. Further, in type 1 inter-tunnel weaving section, another two conflict prediction models are built for the diverging and merging section, respectively, due to their unique lane markings and thus distinct traffic flow operations. The diverging model will be entitled Model III, and the merging model will be entitled Model VI in the following paper. In type 2 weaving sections, the geometric designs and traffic operations are similar across different subsections, and therefore a uniform model is used instead of separate models.
3.2. Bayesian negative binomial regression
A generalized linear model was applied to extend the idea of linear modeling to cases where linear and normal distribution assumptions are not satisfied. The negative binomial regression, as one type of generalized linear models, is usually used for developing conflict prediction models.
In negative binomial distribution, the likelihood function can be formulated as EquationEquation (4)(4)
(4) , where ϕ denotes the variance or dispersion parameter.
(4)
(4)
where i indicates each inter-tunnel weaving section.
The distribution of the number of conflicts yi is as follow:
(5)
(5)
where μ = exp(Xβ) and lnϕ∼N(0,10000). The equation of μ indicates that the link function g(*) in EquationEquation (2)
(2)
(2) is in exponential form.
Furthermore, the likelihood function of negative binomial regression in Bayesian inference can be formulated as follow:
(6)
(6)
The non-informative prior distribution for the parameter vector β is (Bayesian data analysis, the third edition, 2013):
(7)
(7)
(8)
(8)
Therefore, the posterior distribution for β is:
(9)
(9)
where:
(10)
(10)
3.3. Fixed- and random-effects for different sites
As there are many sites in two types of inter-tunnel weaving sections and time difference is not a concern in this study, the data collected can be categorized as cross-section data. Different sites in various types may impose diverse impacts on conflict occurrence in practice. In this area, both fixed- and random-effects models were developed in traffic safety studies. For example, Caliendo et al. (Citation2019) developed unrelated and correlated- random parameters models to investigate the crash frequency in tunnels and meant to find which one is better to account for the cross correlation among parameters. Chin and Quddus (Citation2003) developed the random effect negative binomial model to deal with the spatial and temporal effects in data. Both the studies found that the random-effect model performs better that the fixed-effect one, especially when treating samples with vary characteristics. Other studies also applied Bayesian inference methods when developing random-effect crash prediction models (Huang & Abdel-Aty, Citation2010; Yu, Abdel-Aty, & Ahmed, Citation2013).
Many studies assume that different types of road segments are heterogeneous in geometric design but the various sites of the same type (group) have similar characteristics. The aforementioned studies also indicated that random-effect models along with Bayesian Inference approach could account for heterogeneity better than traditional fixed-effect crash prediction models. Therefore, in the present paper we applied both fixed- and random-effect models to investigate patterns of conflicts in inter-tunnel weaving sections, and Deviance Information Criterion were utilized to compare the performance of models. Since the inter-tunnel weaving sections in this paper are divided into two groups with respective conflict prediction models for each group, we here assume that all sites have same coefficients but with different intercepts in random-effect models with a preset hyperprior distribution for “id,” where id ∼ N(0, σ) and σ∼Gamma(0.01, 0.01). While for the fixed-effect model, it is assumed that all sites have the same coefficients and intercepts.
4. Results
All conflicts data, along with traffic flow and geometric design data, were used for calibrating and validating the proposed models. presents the descriptive statistics of candidate variables in four types of models. The fixed- and random-effect conflict prediction models for type 1 and 2 inter-tunnel weaving sections were presented in and respectively. The other two conflict prediction models for the diverging and merging section of type 1 weaving section were presented in and , respectively. Deviance Information Criterion (DIC) values for different models are also provided in the tables. In this study, the density plots of variables are utilized to examine the model convergence. In specific, the model is considered to be convergent when the posterior distribution density curves of parameters are smooth.
Table 4. Descriptive statistics of variables.
Table 5. Fixed-effect conflict prediction models for the whole weaving section.
Table 6. Random-effect conflict prediction models for the whole weaving section.
Table 7. Fixed-effect conflict prediction models for sub-sections of type 1 weaving section.
Table 8. Random-effect conflict prediction models for sub-sections of type 1 weaving section.
In all fixed- and random-effect models, the coefficients of significant variables in two types of models are very similar. The only notable difference is that the number of significant variables in the fixed-effect model is less. A possible reason is that the fixed-effect model ignores the difference among various inter-tunnel weaving sections and then discards some variables. Specifically, the fixed-effect model is slightly better than the random-effect model in type 1 inter-tunnel weaving sections, in terms of DIC performance. While the opposite is true for the two models of the merging section of type 1 inter-tunnel weaving section. For type 2 inter-tunnel weaving sections, the random-effect model is significantly better than the fixed-effect model based on DIC values. Other detailed performance evaluation can be found in .
For conflict prediction models of type 1 and type 2 inter-tunnel weaving sections, it can be seen from both and that the upstream and downstream volume have opposite effects on conflict occurrence in different types of weaving sections. Other variables, such as the average and standard deviation of speed, also have opposite influences on the conflicts in type 1 and type 2 inter-tunnel weaving sections. One remarkable finding is that the coefficients of RtoEnV2 in type 1 and type 2 weaving sections are quite different, equaling to 73.002 and −2.7652, respectively. A possible explanation is that the more road-to-tunnel volume there are, the more vehicles in the connected section between two tunnels there possibly will be, which have to drive across the whole weaving section because there is a side-barrier between connected road and ground road. Therefore, the road-to-tunnel volume is more influential on conflicts in type 2 inter-tunnel weaving section than that in type 1 inter-tunnel weaving section.
Specifically, in type 1 weaving sections, a longer weaving section (Lw) may induce more traffic conflicts; while, in type 2 weaving sections, the length is not a significant variable. A possible explanation is that the weaving operations in type 1 inner-tunnel sections are regulated by lane-markings with isolated diverging zone, no lane-changing zone, and merging zone. Drivers, who are not familiar with such rules or anxious for not being able to merge/diverge to their desired lanes, would be more inclined to make lane-changings at the first lane-changing zone, i.e., the diverging zone in type 1 weaving section. This can be also demonstrated by field data shown in and that the diverging zone has dominant weaving volumes and conflicts. However, in type 2 inter-tunnel weaving section, where vehicles are allowed to change lanes anywhere in the whole weaving section, such problems do not appear to exist. Besides, the ratio of the length of diverging/merging section over the length of the whole weaving section has a huge influence on traffic conflict.
The fixed- and random- effect models in and for the diverging and the merging model of type 1 weaving sections explore the safety mechanism in these two sections. Similar to the models in , the geometric design along with traffic flow characteristics were significant influencing factors to conflict occurrences. It should be noted that the variable “id” is not contained in the model for the merging section. Therefore, we can conclude that the fixed-effect for the merging section model is sufficient to describe the conflict mechanism for type 1 weaving sections. It also can be found that increasing the length of diverging/merging sections can reduce conflicts because drivers could have more space for lane-changing maneuvers. Moreover, the upstream and downstream volumes have opposite influences on conflict occurrence in merging and diverging sections, which is intuitive because upstream and downstream volumes are highly correlated to weaving volume. Besides, the traffic volume factor (RtoEnV2) have more influence on conflict in the diverging section than in the merging section. While the road design factor (LD/LW and LE/LW) have more effects on conflict in the merging section than in the diverging section.
Compared with traffic conflict models for other similar infrastructures in existing studies, the proposed model in this paper found some uniqueness in inter-tunnel weaving sections. For example, the crash prediction model for ramp vicinities of the urban expressway in Hossain and Muromachi (Citation2013) only considered mainline volume, average speed, and ramp volume. While models in found that design variables are also crucial influencing factors. The real-time crash prediction models for expressway weaving sections proposed by Wang et al. (Citation2015) found that the weaving section length is positively related to the crash risk, but this paper provides more details at various locations in different types of weaving sections.
5. Conclusion and discussion
This paper studied how traffic flow and geometric characteristics of the inter-tunnel weaving section could influence safety performance. Eight conflict prediction models with four fixed-effect models and four random-effect models were developed for type 1 and type 2 inter-tunnel weaving sections, the diverging and merging subsection for type 1 inter-tunnel weaving section, respectively. Field data were collected at ten selected sites in Nanjing, China and used for model calibration and validation. In type 1 inter-tunnel weaving sections, unique lane markings are designed to isolating merging and diverging vehicles, with the purpose of reducing traffic conflicts. However, the models' results indicate that due to possible reasons such as unfamiliar or unwilling to comply with the lane markings, violations commonly exist, leading to severer traffic conflicts compared with type 2 weaving sections. In addition, the results indicate that the isolated weaving/diverging sections in type 1 weaving sections are not sufficiently long for the weaving demand at the selected sites. This informs us that when isolating merging and diverging sections, the length of such sections should be carefully designed, which otherwise may induce more conflicts.
The model results also showed that the length of the diverging section, the merging section, the whole weaving section, and their ratios had great influences on the conflict occurrence in type 1 inter-tunnel weaving sections. To better understand the influence of length on the safety performance of the inter-tunnel weaving section, more studies are needed to reveal the underlying mechanism. In addition, aggregated field data are used in this paper collected from selected transects on roads. The fixed-point data has inherent limitations in reflecting driving behavior dynamics. High-resolution trajectory data, which are increasingly available, may help better evaluate the safety performance of such inter-tunnel sections.
Additional information
Funding
References
- Abdel-Aty, M., Uddin, N., & Pande, A. (2005). Split models for predicting multivehicle crashes during high-speed and low-speed operating conditions on freeways. Transportation Research Record: Journal of the Transportation Research Board, 1908(1), 51–58. doi:https://doi.org/10.1177/0361198105190800107
- Abdel-Aty, M., & Wang, L. (2017). Implementation of variable speed limits to improve safety of congested expressway weaving segments in microsimulation. Transportation Research Procedia, 27, 577–584. doi:https://doi.org/10.1016/j.trpro.2017.12.061
- Ahammed, M. A., Hassan, Y., & Sayed, T. A. (2008). Modeling driver behavior and safety on freeway merging areas. Journal of Transportation Engineering, 134(9), 370–377. doi:https://doi.org/10.1061/(ASCE)0733-947X(2008)134:9(370)
- American Association of State Highway and Transportation Officials. (2001). A policy on geometric design of highways and streets. Washington, DC. American Association of State Highway and Transportation Officials.
- Amundsen, F. H., & Ranes, G. (2000). Studies on traffic accidents in Norwegian road tunnels. Tunnelling and Underground Space Technology, 15(1), 3–11. doi:https://doi.org/10.1016/S0886-7798(00)00024-9
- Bai, L., Liu, P., Chen, Y., Zhang, X., & Wang, W. (2013). Comparative analysis of the safety effects of electric bikes at signalized intersections. Transportation Research Part D: Transport and Environment, 20, 48–54. doi:https://doi.org/10.1016/j.trd.2013.02.001
- Beard, A. N. (2010). Tunnel safety, risk assessment and decision-making. Tunnelling and Underground Space Technology, 25(1), 91–94. doi:https://doi.org/10.1016/j.tust.2009.07.006
- Cai, Q., Saad, M., Abdel-Aty, M., Yuan, J., & Lee, J. (2018). Safety impact of weaving distance on freeway facilities with managed lanes using both microscopic traffic and driving simulations. Transportation Research Record: Journal of the Transportation Research Board, 2672(39), 130–141. doi:https://doi.org/10.1177/0361198118780884
- Caliendo, C., & De Guglielmo, M. L. (2012). Accident rates in road tunnels and social cost evaluation. Procedia - Social and Behavioral Sciences, 53, 166–177. doi:https://doi.org/10.1016/j.sbspro.2012.09.870
- Caliendo, C., De Guglielmo, M. L., & Guida, M. (2013). A crash-prediction model for road tunnels. Accident Analysis and Prevention, 55, 107–115. doi:https://doi.org/10.1016/j.aap.2013.02.024
- Caliendo, C., De Guglielmo, M. L., & Russo, I. (2019). Analysis of crash frequency in motorway tunnels based on a correlated random-parameters approach. Tunnelling and Underground Space Technology, 85, 243–251. doi:https://doi.org/10.1016/j.tust.2018.12.012
- Caliendo, C., Guida, M., & Parisi, A. (2007). A crash-prediction model for multilane roads. Accident Analysis and Prevention, 39(4), 657–670. doi:https://doi.org/10.1016/j.aap.2006.10.012
- Calvi, A., & D’amico, F. (2013). A study of the effects of road tunnel on driver behavior and road safety using driving simulator. Advances in Transportation Studies Jul 1(30).
- Calvi, A., De Blasiis, M. R., & Guattari, C. (2012). An empirical study of the effects of road tunnel on driving performance. Procedia - Social and Behavioral Sciences, 53, 1098–1108. doi:https://doi.org/10.1016/j.sbspro.2012.09.959
- Chen, D., & Ahn, S. (2018). Capacity-drop at extended bottlenecks: Merge, diverge, and weave. Transportation Research Part B: Methodological, 108, 1–20. doi:https://doi.org/10.1016/j.trb.2017.12.006
- Chen, H., Zhou, H., Zhao, J., & Hsu, P. (2011). Safety performance evaluation of left-side off-ramps at freeway diverge areas. Accident Analysis and Prevention, 43(3), 605–612. doi:https://doi.org/10.1016/j.aap.2010.08.019
- Chin, H. C., & Quddus, M. A. (2003). Applying the random effect negative binomial model to examine traffic accident occurrence at signalized intersections. Accident Analysis and Prevention, 35(2), 253–259. doi:https://doi.org/10.1016/s0001-4575(02)00003-9
- Cooper, P. J. (1984). Experience with traffic conflicts in Canada with emphasis on “post encroachment time” techniques. In International calibration study of traffic conflict techniques (pp. 75–96). Berlin: Springer. Erik Asmussen.
- De Blasiis, M. R., Diana, S., & Veraldi, V. (2018). Safety audit for weaving maneuver: A driver simulation safety analysis. Journal of Transportation Safety & Security, 10(1-2), 159–175. doi:https://doi.org/10.1080/19439962.2017.1323060
- El-Basyouny, K., & Sayed, T. (2009). Accident prediction models with random corridor parameters. Accident Analysis and Prevention, 41(5), 1118–1123. doi:https://doi.org/10.1016/j.aap.2009.06.025
- Gelman, A., Carlin, J. B., Stern, H. S., Dunson, D. B., Vehtari, A., & Rubin, D. B. (2013). Bayesian data analysis. Chapman and Hall/CRC. London.
- Gettman, D., & Head, L. (2003). Surrogate safety measures from traffic simulation models. Transportation Research Record: Journal of the Transportation Research Board, 1840(1), 104–115. doi:https://doi.org/10.3141/1840-12
- Golob, T. F., Recker, W. W., & Alvarez, V. M. (2004). Safety aspects of freeway weaving sections. Transportation Research Part A: Policy and Practice, 38(1), 35–51. doi:https://doi.org/10.1016/j.tra.2003.08.001
- Hayward, J. (1971). Near misses as a measure of safety at urban intersections. Doctoral Thesis, The Pensilvania State University, Department of Civil Engineering, Pennsylvania Transportation and Traffic Safety Center.
- Hidas, P. (2005). Modelling vehicle interactions in microscopic simulation of merging and weaving. Transportation Research Part C: Emerging Technologies, 13(1), 37–62. doi:https://doi.org/10.1016/j.trc.2004.12.003
- Highway Capacity Manual. (2010). HCM2010. Washington, DC: Transportation Research Board, National Research Council, 1207 p.
- Hossain, M., & Muromachi, Y. (2013). A real-time crash prediction model for the ramp vicinities of urban expressways. IATSS Research, 37(1), 68–79. doi:https://doi.org/10.1016/j.iatssr.2013.05.001
- Huang, H., & Abdel-Aty, M. (2010). Multilevel data and Bayesian analysis in traffic safety. Accident Analysis and Prevention, 42(6), 1556–1565. doi:https://doi.org/10.1016/j.aap.2010.03.013
- Kim, K., & Park, B. J. (2018). Safety features of freeway weaving segments with a buffer-separated high-occupancy-vehicle (HOV) lane. International Journal of Injury Control and Safety Promotion, 25(3), 284–292. doi:https://doi.org/10.1080/17457300.2018.1431943
- Laval, J. A., & Daganzo, C. F. (2006). Lane-changing in traffic streams. Transportation Research Part B: Methodological, 40(3), 251–264. doi:https://doi.org/10.1016/j.trb.2005.04.003
- Laval, J. A., & Leclercq, L. (2008). Microscopic modeling of the relaxation phenomenon using a macroscopic lane-changing model. Transportation Research Part B: Methodological, 42(6), 511–522. doi:https://doi.org/10.1016/j.trb.2007.10.004
- Lee, J., & Cassidy, M. J. (2009). An empirical and theoretical study of freeway weave bottlenecks. California PATH Program, University of California, Berkeley, 70 p.
- Li, Y., Xu, C., Xing, L., & Wang, W. (2017). Evaluation of impacts of different car-following types on rear-end crash risk at freeway weaving sections using vehicle trajectory data (No. 17-01540). In Proceedings of the Transportation Research Board 96th Annual Meeting. Washington DC. pp. 1–13.
- Liu, P., Chen, H., Lu, J. J., & Cao, B. (2010). How lane arrangements on freeway mainlines and ramps affect safety of freeways with closely spaced entrance and exit ramps. Journal of Transportation Engineering, 136(7), 614–622. doi:https://doi.org/10.1061/(ASCE)TE.1943-5436.0000127
- Liu, P., Lu, J. J., & Chen, H. (2008). Safety effects of the separation distances between driveway exits and downstream U-turn locations. Accident Analysis and Prevention, 40(2), 760–767. doi:https://doi.org/10.1016/j.aap.2007.09.011
- Mao, X., Yuan, C., Gan, J., & Zhang, S. (2019). Risk factors affecting traffic accidents at urban weaving sections: Evidence from China. International Journal of Environmental Research and Public Health, 16(9), 1542. doi:https://doi.org/10.3390/ijerph16091542
- Meng, Q., & Qu, X. (2012). Estimation of rear-end vehicle crash frequencies in urban road tunnels. Accident Analysis and Prevention, 48, 254–263. doi:https://doi.org/10.1016/j.aap.2012.01.025
- Meng, Q., Qu, X., Wang, X., Yuanita, V., & Wong, S. C. (2011). Quantitative risk assessment modeling for nonhomogeneous urban road tunnels. Risk Analysis, 31(3), 382–403. doi:https://doi.org/10.1111/j.1539-6924.2010.01503.x
- Meng, Q., Qu, X., Yong, K. T., & Wong, Y. H. (2011). QRA model-based risk impact analysis of traffic flow in urban road tunnels . Risk Analysis, 31(12), 1872–1882. doi:https://doi.org/10.1111/j.1539-6924.2011.01624.x
- Pan, T. L., Lam, W. H., Sumalee, A., & Zhong, R. X. (2016). Modeling the impacts of mandatory and discretionary lane-changing maneuvers. Transportation Research Part C: Emerging Technologies, 68, 403–424. doi:https://doi.org/10.1016/j.trc.2016.05.002
- Parker, M. R., Jr., & Zegeer, C. V. (1989). Traffic conflict techniques for safety and operations: Observers manual (No. FHWA-IP-88-027, NCP 3A9C0093). Federal Highway Administration, U.S. Department of Transportation.
- PIARC Technical Committee C3.3 Road Tunnel Operation. (2008). Risk analysis for road tunnels, May 2008. Retrieved from http://publications.piarc.org/ressources/publicationsfiles/4/2234,TM2008R02-WEB.pdf
- Pulugurtha, S. S., & Bhatt, J. (2010). Evaluating the role of weaving section characteristics and traffic on crashes in weaving areas. Traffic Injury Prevention, 11(1), 104–113. doi:https://doi.org/10.1080/15389580903370039
- Qi, Y., Chen, X., & Liu, J. (2015). Safety performance of freeway weaving sections (No. 15-1271). In Proceedings of the Transportation Research Board 94th Annual Meeting. Washington, DC. pp. 1–15.
- Sarvi, M. (2013). Freeway weaving phenomena observed during congested traffic. Transportmetrica A: Transport Science, 9(4), 299–315. doi:https://doi.org/10.1080/18128602.2011.574649
- Sayed, T., Zaki, M. H., & Autey, J. (2013). Automated safety diagnosis of vehicle–bicycle interactions using computer vision analysis. Safety Science, 59, 163–172. doi:https://doi.org/10.1016/j.ssci.2013.05.009
- Tilg, G., Yang, K., & Menendez, M. (2018). Evaluating the effects of automated vehicle technology on the capacity of freeway weaving sections. Transportation Research Part C: Emerging Technologies, 96, 3–21. doi:https://doi.org/10.1016/j.trc.2018.09.014
- van Beinum, A., Farah, H., Wegman, F., & Hoogendoorn, S. (2018). Driving behaviour at motorway ramps and weaving segments based on empirical trajectory data. Transportation Research Part C: Emerging Technologies, 92, 426–441. doi:https://doi.org/10.1016/j.trc.2018.05.018
- Wang, L., Abdel-Aty, M., Shi, Q., & Park, J. (2015). Real-time crash prediction for expressway weaving segments. Transportation Research Part C: Emerging Technologies, 61, 1–10. doi:https://doi.org/10.1016/j.trc.2015.10.008
- Xu, C., Liu, P., Wang, W., & Li, Z. (2014). Identification of freeway crash-prone traffic conditions for traffic flow at different levels of service. Transportation Research Part A: Policy and Practice, 69, 58–70. doi:https://doi.org/10.1016/j.tra.2014.08.011
- Xu, C., Tarko, A. P., Wang, W., & Liu, P. (2013). Predicting crash likelihood and severity on freeways with real-time loop detector data. Accident; Analysis and Prevention, 57, 30–39. doi:https://doi.org/10.1016/j.aap.2013.03.035
- Xu, C., Wang, W., & Liu, P. (2013). A genetic programming model for real-time crash prediction on freeways. IEEE Transactions on Intelligent Transportation Systems, 14(2), 574–586. doi:https://doi.org/10.1109/TITS.2012.2226240
- Yu, R., Abdel-Aty, M., & Ahmed, M. (2013). Bayesian random effect models incorporating real-time weather and traffic data to investigate mountainous freeway hazardous factors. Accident Analysis and Prevention, 50, 371–376. doi:https://doi.org/10.1016/j.aap.2012.05.011
- Yuan, J., Abdel-Aty, M., Cai, Q., & Lee, J. (2019). Investigating drivers' mandatory lane change behavior on the weaving section of freeway with managed lanes: A driving simulator study. Transportation Research Part F: Traffic Psychology and Behaviour, 62, 11–32. doi:https://doi.org/10.1016/j.trf.2018.12.007
- Yun, M., Zhao, J., Zhao, J., Weng, X., & Yang, X. (2017). Impact of in-vehicle navigation information on lane-change behavior in urban expressway diverge segments. Accident Analysis and Prevention, 106, 53–66. doi:https://doi.org/10.1016/j.aap.2017.05.025
- Zhang, C., Yan, X., An, M., & Zhao, H. (2015). Spatial influence analysis of traffic safety in diverging areas between freeway segments and off ramps. Discrete Dynamics in Nature and Society, 2015, 1–9. doi:https://doi.org/10.1155/2015/357579
- Zhao, J., & Liu, Y. (2016). Integrated signal optimization and non-traditional lane assignment for urban freeway off-ramp congestion mitigation. Transportation Research Part C: Emerging Technologies, 73, 219–238. doi:https://doi.org/10.1016/j.trc.2016.11.003
- Zheng, L., & Ismail, K. (2017). A generalized exponential link function to map a conflict indicator into severity index within safety continuum framework. Accident Analysis and Prevention, 102, 23–30. doi:https://doi.org/10.1016/j.aap.2017.02.013
- Zhu, S., Xu, Y., Yan, Y., & Luo, S. (2008, October). Study on traffic safety, efficiency and intervention in weaving area. Paper presented at the 2008 IEEE International Conference on Service Operations and Logistics, and Informatics (Vol. 2, pp. 2806–2809). IEEE. Beijing, China.