
 ?Mathematical formulae have been encoded as MathML and are displayed in this HTML version using MathJax in order to improve their display. Uncheck the box to turn MathJax off. This feature requires Javascript. Click on a formula to zoom.
Abstract
Road safety is a crucial aspect of global policies and management. Surrogate Safety Measures (SSMs) have gained attention in the study of pedestrian safety. This study aims to establish an effective SSM methodology to analyze driver-pedestrian interactions. The analysis relies on SSM indicators, without the need for an initial classification of driver-pedestrian interactions into specific interaction patterns. The proposed methodology offers several advantages, including the accurate identification of conflicts through an affordable approach making it easily accessible for public administrations and authorities to assess pedestrian safety at road intersections. A dataset comprising 270 driver-pedestrian interactions, observed at three road intersections in Rome, Italy, was examined. The severity level of each event was assessed through a preliminary classification of each interaction into three patterns: high, low, and none. Subsequently, the severity levels were evaluated using three methods, employing Time-to-Collision (TTC), Post-Encroachment Time (PET), and a combination of TTC and PET. A comparison between the severity levels identified by the two approaches was conducted. The findings reveal that Method 2, utilizing PET, consistently identifies conflicts. Additionally, a binomial logistic regression analysis was performed to identify the variables that influence the likelihood of an interaction escalating into a conflict. The results demonstrate that the probability of conflict increases with the duration of a red signal, particularly for younger pedestrians.
1. Introduction
Nowadays, road accidents are one of the primary causes of global mortality, and pedestrians are undoubtedly the most vulnerable participants among road users, facing significant risks of severe consequences when involved in such incidents. In recent years, pedestrian safety has become a matter of great concern for public administrations and authorities, with a particular emphasis on pedestrian injuries and fatalities that carry social and economic implications. International organizations, including the World Health Organization (WHO) and the European Union, recognize the safety of Vulnerable Road Users (VRU) as a pressing issue, leading to the development of traffic safety programs and national campaigns (Olszewski et al., Citation2019; WHO, Citation2018; ITF, Citation2022). Specifically, VRU encompass non-motorized road users, pedestrians, cyclists, motorcyclists, and individuals with disabilities or limited mobility (European Parliament & Council, Citation2010). According to the latest statistics from the European Commission’s Transport and Mobility Report (European Commission Road Safety Statistics, 2018), pedestrian fatalities accounted for approximately 21% of all road traffic accident-related deaths in 2018. In this regard, recent studies on risk behaviors and accident locations, as well as statistical findings involving pedestrians, have highlighted the critical role of road intersections within road networks (Zhang et al., Citation2020; Ammar et al., Citation2022; Kathuria & Vedagiri, Citation2020; Salamati et al., Citation2011; Ren et al., Citation2012).
According to the Italian Institute of Statistics (ISTAT), Italy witnessed approximately 18400 pedestrian accidents annually from 2011 to 2021, of which 5300 (29%) occurred at road intersections. Over the same decade, an average of 550 pedestrian fatalities occurred each year, with around 20% of them happening at road intersections (ACI-ISTAT, Citation2021). Notably, the city of Rome experienced a significant number of incidents, with around 50 pedestrian fatalities and over 2000 injuries occurring annually at road intersections from 2011 to 2021. Furthermore, in 2021, Rome accounted for about 10% of all pedestrian fatalities recorded in Italy. These alarming figures underscore the urgent need to enhance pedestrian safety, particularly at road intersections, in order to reduce the number of deaths and injuries. Due to the complexity of this subject, numerous researchers emphasize the necessity of conducting in-depth investigations using innovative methods for evaluating road safety and identifying factors that affect driver-pedestrian interactions at road intersections (Kumar et al., Citation2019; Zhang et al., Citation2020; Ammar et al., Citation2022; Kathuria & Vedagiri, Citation2020). Most studies for road safety analysis have relied on statistical analyses based on accident reports to address various safety-related concerns. However, these methods often prove ineffective due to several limitations, including the reliance on the availability and quality of accident reports, as well as the lack of regularly updated data. To overcome these limitations, Traffic Conflict Techniques (TCT) have been progressively adopted by researchers for analyzing driver-pedestrian conflicts (Ni Y. et al., 2016; Zhang et al., Citation2020). Such techniques focus on analyzing traffic conflicts rather than road accidents (Ismail et al., Citation2009; Laureshyn et al., Citation2009). The traffic conflict technique involves analyzing near-accident events and measuring spatial and/or temporal indicators that describe the interactions between the road users involved in the conflict (Riser, Citation1985). These indicators are used to assess the severity of the conflicts in terms of spatial or temporal proximity (Tourinho & Pietrantonio, Citation2003; Archer, Citation2005; Tarko et al., Citation2009; Ismail et al., Citation2011; Saunier, Citation2013). This approach enhances the safety analysis of investigated sites, particularly signalized intersections, by examining conflicts, which are frequent occurrences, without relying only on accident observations. In recent applications, Ni et al. (Citation2016) introduced an interesting approach for evaluating pedestrian safety at traffic-light intersections, selecting the most appropriate Surrogate Safety Measure (SSM) to be identified. Other recent approaches evaluate the use of computer vision techniques and conflict models for conflict analysis (Amini et al., Citation2022, Zhang et al., Citation2020, Zaki et al., Citation2013, Brunetti et al., Citation2018).
2. Literature review
2.1. Traffic conflict techniques and surrogate safety measures
According to the literature, the Traffic Conflict Technique (TCT) is a method used for road safety analysis, aimed at identifying and evaluating hazardous locations on roads and intersections. These TCT methods analyze near-accident situations, which may not necessarily involve actual accidents between road users. TCT primarily focuses on assessing interactions between road users, such as vehicles, cyclists, and pedestrians, with a focus on events that have a high potential to result in accidents, considering their severity and frequency. The initial proposal for this approach was made by Perkins and Harris in the 1960s (Perkins & Harris, Citation1967). Later, the concept of the "safety pyramid" was introduced by Hyden, (Citation1975) ().
Figure 1. The safety pyramid - interactions between road users as a continuum of events.
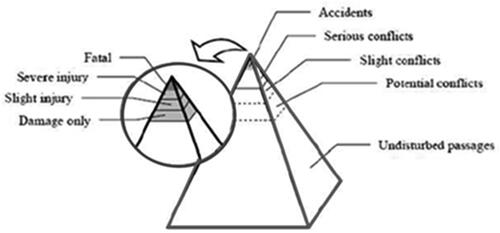
This method involves safer and more frequent undisturbed passages situated at the base of the pyramid, while the most serious events (e.g. conflicts), which are less frequent, are located at the top. The method recognizes that accidents, being rare events, have low frequencies but high levels of severity. Consequently, the concept of a "conflict point" was introduced to analyze near-accident events. A conflict point is defined as a potential situation where two or more road users approach a point in both time and space, and without changes in their dynamic characteristics, a collision would occur (Hyden, Citation1987). Conflicts are categorized as serious, slight, or potential and occupy the space between safe passages and accidents in the safety pyramid (Hyden & Linderholm, Citation1984) as depicted in . By considering the relationship between severity and frequency, the frequency of accidents can be estimated based on the frequency of conflicts.
Referring to driver-pedestrian interactions at traffic-light intersections, turning maneuvers, in addition to illegal crossings (i.e. during the red-light phase), can generate severe conflicts between drivers and pedestrians during the common phase of green:
the right-turn maneuvers of vehicles, which occur if drivers do not properly notice pedestrians crossing;
the left-turn maneuvers of the vehicles, which arise if drivers, engaged in the search for an adequate gap to perform the maneuver, do not promptly detect pedestrians crossing.
In the last decade, several studies have addressed the developments of the TCT technique proposing indicators of temporal proximity and spatial indicators (SSMs), in order to classify the severity of interactions (Zhang et al., Citation2020, Kathuria & Vedagiri, Citation2020, Svensson, Citation1998; Svensson & Hydén, Citation2006, Guttinger, Citation1982, Sayed et al., Citation2013). Several applications have widely demonstrated the high suitability of SSMs methods for analyzing traffic conflicts and driver-pedestrian interactions (Tarko et al., Citation2009, Tarko, Citation2012, Citation2018, Saunier, Citation2013, Ismail et al., Citation2009, Citation2011).
The most acknowledged SSMs time-based indicators are described below:
Time to Collision (TTC), defined as the time for which two users would collide if they continued with the same speed and trajectory (Hayward, Citation1971, Ismail et al., Citation2009; Tarko, Citation2018);
Post-Encroachment Time (PET): time interval between the first road user leaves the spatial conflict zone and the second user reaches the path of the first (Peesapati et al., Citation2018, Cooper, Citation1984, Ismail et al., Citation2011);
Gap Time (GAP), which is the time difference between when the first road user leaves and the second arrives at the corresponding conflict zone (Vogel, Citation2002; Archer, Citation2005);
Amongst the SSMs spatial indicators, the Potential Index for Collision with Urgent Deceleration (PICUD) and the Proportion of Stopping Distance (PSD), are the most implemented in the literature (Lu et al., Citation2021).
2.2. Pedestrian-vehicle interactions analysis
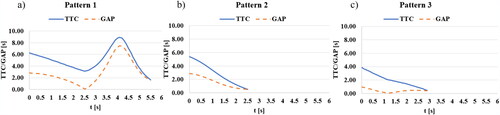
The analysis of the interactions between drivers and pedestrians at road intersections is a complex task due to the rapid changes in trajectories and crossing speeds (Govinda & Ravishankar,Citation2022, Quaye et al., Citation1993, Lord, Citation1996). In the last decade, several effective applications of SSMs, for evaluating pedestrians’ safety at road intersections, were presented. Several applications are based on analyzed interactions collected by video-inspections, including also comparison between simulated and field-measured conflicts (Guo et al., Citation2017, Guo et al., Citation2019). In this context, time-based Surrogate Safety Measures (i.e. TTC, GAP, PET), or a combination of them, were progressively implemented by researchers to successfully analyze the driver-pedestrian interactions and evaluate their severity (Arun et al., Citation2021, Guido et al., Citation2011, Kaparias et al., Citation2010). However, there is not a general consensus about the optimal SSMs to be applied for the analysis of driver-pedestrian interactions, as well as on SSMs threshold values to be used for the classification of their severity. (Zaidel & Hocherman, Citation1987; Zhang et al., Citation2020, Laureshyn et al., Citation2009; Ren et al., Citation2012). For instance, the Dutch Manual for Conflict Observation specifies that a minimum TTC value less than 1.5s is associated with dangerous situations in urban areas, and PET values lower than 1.0s indicate possibly critical traffic situations (Van der Horst & Kraay, Citation1986). Ismail et al. (Citation2011) classified vehicle-pedestrian interactions in traffic conflicts, important events, and uninterrupted passages, according to their severity, choosing PET as the most reliable parameter to detect conflicts and important events (with a threshold varying from 2.8 and 2.2 s). In (Zhang et al., Citation2020), the authors implement PET and TTC to predict near-accident events between drivers and pedestrians at signalized intersections, by means of automated computer vision techniques. Several indicators to analyze the driver-pedestrian conflicts were implemented by Kumar et al. (Citation2019), including PET, Time to Vehicle (TTV), Deceleration to Safety Time of pedestrians (DSTp), and Time to Accident (TTA). More specifically, the threshold value of PET to classify hard interactions was 2.32 s. A similar PET threshold (2.64 s) was found by Xin et al. (Citation2016) to classify the same interactions. However, these PET threshold values are almost half of the value (4.87 s) found by Gang et al. to classify hard interactions. Other researchers, such as (Almodfer et al., Citation2016), found a higher threshold value (5 s) of PET, to identify a safe interaction. Many studies classify a driver-pedestrian interaction as safe if TTC values are greater than 3s (Hussein et al., Citation2015; Ni et al., Citation2016; Jahandideh et al., Citation2017). More recently, (Ni et al., Citation2016) presented a novel procedure to analyze driver-pedestrian interactions at traffic-light intersections by identifying the appropriate SSMs, on the basis of interaction patterns, considering the behavioral connotations of drivers and pedestrians. Three interaction patterns were defined, namely “hard interaction”, “no interaction” and “soft interaction”, respectively. TTC, PET, and a combination of them (TTC and PET) were used to classify the interactions in terms of severity (safe, critical, and conflict events), following each interaction pattern. According to Ni et al., Citation2016, the values of SSM (i.e. TTC and GAP) for Pattern 1 (hard interactions), have similar trends and reach their minimum values concurrently, in the middle of the interaction. This is verified for both cases in which drivers or pedestrians pass first, respectively. Pattern 2 includes all the cases where “no interactions” occur. In this case, both the SSMs reach the minimum values at the end of the process (no interaction), where the major risk occurs (Ni et al., Citation2016). In these cases, the SSMs have similar decreasing trends during the whole interaction process. In other cases, the interaction belongs to Pattern 3, corresponding to a “soft interaction”. Three examples of experimental TTC and GAP profiles of a driver-pedestrian interaction, classified in patterns, are reported in .
Figure 2. Examples of TTC/GAP vs time related to the driver-pedestrian in a) hard-interaction; b) no interaction and c) soft-interaction.
The following SSM thresholds were implemented to evaluate the severity of each interaction, after the pattern classification (Ni et al., Citation2016):
For Pattern 1(hard interaction), TTC was used and the interaction was categorized as safe, when TTC > 3.0 s, critical if 1.5 s < TTC ≤ 3.0 s, and a conflict if TTC ≤ 1.5 s;
For Pattern 2 (no interaction), PET was used and the event was classified as safe if PET > 3.0 s, a critical passage if 1.0 s < PET ≤ 3.0 s and a conflict if PET ≤ 1.0 s;
For Pattern 3 (soft interaction), TTC and PET were adopted concurrently. The event was defined as a safe event if TTC > 3.0 s and PET > 3.0 s, a conflict if TTC ≤ 1.5 s and PET ≤ 1.0 s, and a critical event in other cases.
However, the advanced method proposed by Ni et al. (Citation2016) appears to be complex to be performed, due to the high-computational load for the identification and classification of each interaction into the proper pattern. Furthermore, potential errors could be introduced in the process, if the pattern classification is not properly assigned.
3. Objectives
This research aims to define a methodology for the investigation of driver-pedestrian interactions based on SSMs. More specifically, the proposed methodology is oriented to the effective detection of interactions of higher severity (conflicts), without the need to conduct a preliminary characterization of driver-pedestrian interaction patterns. Therefore, the main objective of this research is to provide an effective methodology, readily employable by public administrations and authorities, for evaluating pedestrian safety at road intersections. This approach is designed to accommodate an affordable computational load, ensuring seamless execution. Moreover, a binomial logistic regression was proposed in order to identify the variables affecting the probability that a driver-pedestrian interaction becomes a conflict.
4. Methodology
The implemented methodology of this research is based on the following steps:
Three intersections of the city of Rome were selected as case-studies (section 4.1);
For these intersections, the video recordings of the driver-pedestrian interactions were processed by image processing algorithms (section 4.2);
The driver-pedestrian interactions have been extracted and several SSMs indicators during the whole interactive process were calculated (section 4.3). This allows to classify each interaction into a pattern of interaction (section 4.3.1);
The level of severity (safe, critical, conflicts events) was evaluated for each interaction, based on the preliminary classification into three patterns (section 4.3.2);
The levels of severity were evaluated without a preliminary pattern classification, using three SSMs-based methods based on: TTC values, PET values, TTC and PET values, respectively (section 4.3.3);
The levels of severity of the interactions identified through the two approaches, were compared to determine the most reliable SSMs method for identifying the most serious interactions (conflicts). To this purpose, the results obtained applying three SSM-based methods, without a pattern classification, were compared to the literature method based on the preliminary classification of interactions in patterns;
Lastly, for the right-turn maneuvers, composed of a consistent dataset to be analyzed, a binomial logistic regression analysis was carried out, to identify the variables which affect the probability that a driver-pedestrian interaction becomes a conflict, identified by the most effective SSM-based method (section 5).
4.1. Case studies
Three road intersections, located in Rome (Italy), were selected as case-studies and investigated. For this purpose, several surveillance video recordings collected at road intersections were acquired and processed. These videos, provided by “Agenzia della Mobilità” of the Municipality of Rome, were collected for six consecutive hours, (ranging from 10:00 to 4:00 pm), in the proximity of the analyzed intersections. The intersections’ features, including vehicle and pedestrian flows, are reported in , while the layouts of the inspected intersections are shown in .
Figure 3. Layout of three intersections selected as case-studies and the analyzed turning maneuvers.
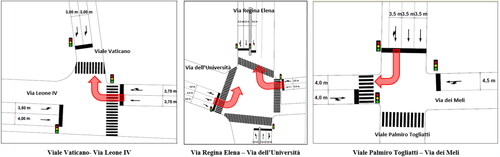
Table 1. Intersection description.
The selection of the intersections has allowed the investigation of the SSM-based methods in different conditions in terms of geometry, intersection configuration, and traffic flows. The peculiarity of each intersection, made it possible to perform several investigations about the driver-pedestrian interactions, providing a more comprehensive and complete representation of the outcomes. Accordingly, the following turning maneuvers were analyzed for each intersection, as reported in ():
right-turn maneuvers from Via Leone IV to Viale Vaticano;
right-turn maneuvers from Via dell’Università to Via Regina Elena;
left-turn maneuvers from Via dell’Università to Via Regina Elena;
right-turn maneuvers from Viale Palmiro Togliatti to Via dei Meli.
4.2. Video processing and image analysis
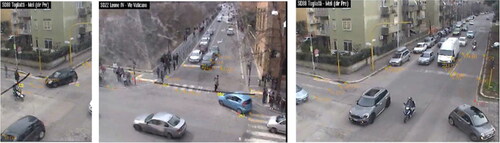
The processing phases of the video recordings were implemented using the software “Traffic Analyzer - v. 3.4” (Suzuki & Nakamura, Citation2006). This tool integrates a video processing system for traffic flow analysis including several image processing functions (i.e. projection transformations), for the evaluation of the trajectory data from the video. In addition, in order to estimate the position, speed, and acceleration of drivers and pedestrians, the Kalman filter, a well-known data filtering technique, has been implemented. Amongst the main advantages of the software, the user-friendly interface and the possibility to be implemented in workstations characterized by medium computational loads equipment, can be mentioned. The tracking of moving objects was performed by determining their position within the video for each frame, by considering several reference points (). A calibration phase was implemented by including several details related to the geometry of the intersection, retrieved by satellite imageries, through the Google Earth© platform. Specifically, the surfaces of the objects in the foreground, were identified using the background subtraction technique and the centroid of each region was considered as a reference point for the movement of the object. The tracking speed was corrected by matching the recognized position of the object with the position of the consecutive frame, which is predicted by interpolation through the Kalman filter. The tracking processes were carried out considering the geographical coordinates of several points located in the area of interest. The trajectories were recorded between the driver approaches the intersection, with a comprehensive view of the crossing area, until the first user leaves the conflict area ().
Figure 4. Reference points at intersections and trajectory extraction using the Software Traffic Analyzer.
Only pairs of users, which are not influenced by external conditions (i.e. the presence of other drivers or pedestrians) were considered. In the case of pedestrian platoons, the first and last pedestrian were considered.
4.3. Data collection, processing and results
4.3.1. Interaction patterns classification
The total number of recorded interactions for each intersection is reported in .
Table 2. Sample of driver-pedestrian interactions of the intersections.
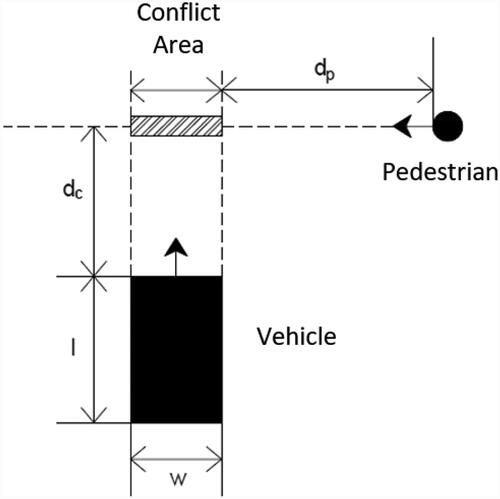
According to Ni et al. (Citation2016), all the interactions were initially classified in patterns. The measurements of TTC and GAP were performed using a theoretical model based on the distances and the speed values of both drivers and pedestrians during their interaction (). Two possible cases were identified related to the user who proceeded first (i.e. vehicle or pedestrian). These indicators were evaluated considering the external wheel at the back of the vehicle as the reference point ().
Figure 5. Theoretical scheme of driver-pedestrian interaction. The conflict area is represented by the hatched zone.
TTC and GAP indicators are calculated as follows (EquationEqs. 1(1)
(1) and Equation2
(2)
(2) ):
Case 1: Vehicle passes first
(1)
(1)
Case 2: Pedestrian passes first
(2)
(2)
Where:
l is the length of the conflicting vehicle;
w is the width of a vehicle;
dc(i) is the distance from the front of the vehicle to the extrapolated outline of the conflicting pedestrian at the time i;
dp (i) is the distance from the pedestrian to the extrapolated outline of the conflicting vehicle at the time i;
vc(i) is the speeds of the conflicting vehicle at the time i;
vp (i) is the speeds of the conflicting pedestrian at the time i.
The Pattern classification is performed for each intersection.
4.3.1.1. Pattern classification of the selected intersections
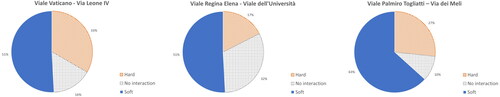
Regarding the first intersection (Viale Vaticano - via Leone IV), the majority of interactions fall into Pattern 3 (soft interaction), corresponding to 51% of the total interactions (61 interactions). In addition, 33% of the interactions (40 events), have been classified into Pattern 1 (hard interaction), which can be most likely related to the elevated presence of pedestrian platoons (19 events). The interactions classified into Pattern 2 (no interaction), are 16% of the cases (19 events), as shown in . For the second intersection (Viale Regina Elena - Viale dell’Università), 61 events, corresponding to 51% of the driver-pedestrian interactions, were classified in Pattern 3 (soft interaction). In addition, 32% of interactions, (38 events), result in Pattern 2 (no interaction). Lastly, 17% of interactions, corresponding to 21 examined maneuvers, belong to Pattern 1 (hard interactions), as reported in . For the third intersection (Viale Palmiro Togliatti - via dei Meli), the highest percentage of interactions results in Pattern 3 (soft interaction), corresponding to 63% (19 interactions). In addition, 27% of interactions were classified into Pattern 1 (hard interaction), corresponding to 8 interactions. A minor presence of interactions (10%) was classified into Pattern 2 ().
Figure 6. Interaction patterns for intersection “Viale Vaticano - via Leone IV”, “Viale Regina Elena – Viale dell’Università”, and “via Palmiro Togliatti – via dei Meli”.
4.3.2. Severity levels of the interactions under the different patterns
After the classification of each driver-pedestrian interaction into the proper pattern (i.e. hard, soft, no interaction), the level of severity was evaluated and each interaction was classified as a safe, critical or conflict event. The threshold values of the SSMs implemented for the identification of the severity, were assumed according to Ni et al. (Citation2016), as reported in Section 2.2. The outcomes of the analysis are reported in .
Table 3. Interaction severity level of the investigated intersections for right and left maneuvers.
The results show a high level of severity for the majority of the analyzed interactions, with a predominant presence of critical events, corresponding to more than 50% of the totality of driver-pedestrian interactions for each analyzed intersection. More specifically, considering the right-turn maneuvers, the percentage of driver-pedestrian interactions classified as critical events are: 59% for the first intersection (“Viale Vaticano - via Leone IV”), 54% for the second one (“Viale Regina Elena - Viale dell’Università”) and 67% for the third intersection (“Viale Palmiro Togliatti - via dei Meli”) respectively. Furthermore, a consistent number of conflicts was detected, corresponding to a percentage of 37%, 42% and 23% for the three intersections, respectively. All the safe events are in a limited number. Considering the left-turn maneuvers of the second intersection (Viale Regina Elena - Viale dell’Università”), 56% of the interactions are critical events, while 42% are conflicts.
4.3.3. Severity level of the interactions without the preliminary pattern classification
The severity of each interaction was evaluated without a preliminary classification in patterns of the driver-pedestrian interactions, considering three SSMs methods based on: TTC, PET, TTC and PET combination, respectively. For these three methods, the severity of each interaction (safe, critical event and conflict) was evaluated using the threshold values proposed by Ni et al. (Citation2016) and reported in Section 2.2, without considering a preliminary patterns classification. The results of the analysis referred to the right-turn and left-turn maneuvers are presented in .
Table 4. Severity assessment for right-turn/left-turn maneuvers.
4.3.4. Comparison of the SSMs approaches
The severity of the interactions evaluated through the two approaches identifying the safe, critical and most serious interactions (conflicts), were then compared with the literature-based method, (founded on the preliminary classification into patterns), in order to identify the SSMs method with the most consistent results. More specifically, the percentage of the events correctly classified by the methods in comparison to the literature-based method, the percentage of false positives (the event listed as conflicts, critical or safe by the SSM-based method, and not by the literature-based model), and false negatives, (the events wrongly not listed as conflicts, critical or safe events in comparison with the literature-based method), have been determined. The outcomes of the analysis for all the methods, considering the right maneuvers, are reported in .
Table 5. Comparison of the two approaches - right-turn maneuvers.
Considering the conflicts, Method 1 returns a percentage of corrected events of 62.1%, with moderate false negatives (0.8%), but numerous false positives (37.9%). This implies that Method 1 overestimates the number of conflicts, identifying, in most cases, the critical events as conflicts. The critical events were correctly identified in most cases (98.7%), with a low rate of false positives (1.3%). However, Method 1 returns a very high rate of false negatives (69.7%). Accordingly, Method 1 underestimates the critical events. In addition, 12 safe passages were detected by the method, against the 9 events detected by the literature method.
Method n. 2 (based on PET), identifies conflicts correctly in most cases (83.3%), with very few false negatives (3.1%) and a moderate number of false positives (16.7%), as reported in . Furthermore, 92.5% of the critical events were correctly identified, with a relatively low percentage of false negatives (14.2%) and false positives (7.5%). The number of safe passages is very limited (4 events of which only 2 corrected). Considering Method n.3, all the conflicts (100%) were correctly identified and no false positives were detected. However, a higher percentage of false negatives (10.7%), were detected by Method 3, than Method 2 (3.1%). The critical events were correctly detected in most cases by Method 3 (89.5%), without false negatives. However, a higher percentage of false positives were detected by Method 3 (10.5%). The comparison of the two approaches was limited to conflicts, since they were considered the more reliable accident precursors, than other interactions which are characterized by lower levels of severity. Considering the conflicts, Method 1 showed a relevant overestimation than the literature-based method (132 against 83), with 37.9% of false positives. A slight overestimation was found by Method n.2 (96 conflicts against 83), with very limited cases of false negatives (3.1%), compared Method 3 (10.7%). Lastly, Method 3 failed in the recognition of conflicts with a rate of false negatives of 10.7%, (indentifying 75 conflicts against 83), which is more than three times higher than Method 2 (3.1%). Amongst the proposed methods, Method 2 (based on PET) identifies the conflicts more consistently and closely to the detection of conflicts by the literature-based method.
The same analysis was conducted considering the left-turn maneuvers. The results are reported in .
Table 6. Comparison of the two approaches - left-turn maneuvers.
Considering the conflicts, 68% of the interactions were correctly identified by Method 1, with the absence of false negatives, but a significant high percentage of false positives (32%). The critical events were correctly identified (100%), with no false positives, but with a high percentage of false negatives (64.7%).
The conflicts were correctly identified by Method n.2 in 85% of the cases, with the absence of false negatives and a slight rate of false positives (15%). The critical events were correctly identified in most cases (90%), with a low rate of false positives (10.0%) and false negatives (3.33%). Referring to Method 3, the conflicts were correctly recognized, but with a very significant rate of false negatives (41.67%). Otherwise, the critical events were correctly identified in most cases (73.68%) by Method 3, with no false negatives, but a higher rate of false positives (26.32%), compared to Method 2 (10.0%). Consequenlty, also for the left-turn maneuvers, the more suitable method to identify the interactions with major risk (conflicts) is Method 2, with a slight overestimation of the conflicts (20 conflicts against 17 detected by the literature-based method), with no false negatives and a limited number of false positives (3.1%). Accordingly, the binomial logistic regression analysis was based on Method 2, analyzing the sample collected with a more consistent quantity of driver-pedestrian interactions (220 events), thus referring to right-turn maneuvers.
5. Binomial logistic regression
A binomial logistic regression has been carried out on the sample of 220 events of right-turn maneuvers, classified in terms of severity by using Method 2 (based on PET). This analysis was carried out with the aim of proposing a model that can predict the probability that an interaction result in a conflict or not. To this purpose, the values of the dependent variable Y (i.e. Conflict) were equal to 1 for conflicts events (Y = 1) and 0 in other cases (Y = 0). The logistic regression model which returns the log odds ((P(Y = 1)/(1-P(Y = 1))) of conflicts is given by:
(3)
(3)
Where βi are the coefficients of m predictor xi and β0 is the constant term.
The probability value for the conflict was provided by the following equation:
(4)
(4)
The model reported in EquationEq. (3)(3)
(3) allows to determine the effect of each predictor on the odds of Y. More specifically, the value of the odds ratio (OR) represents the multiplicative factor of the odds of Y, when the independent variable Xi increases by one unit, with all other factors remaining constant. In other words, the Odds Ratio indicates the relative amount by which the odds of the outcome increase (OR > 1) or decrease (OR < 1) when the value of the corresponding independent variable increases by 1 unit (Washington et al., Citation2020).
Firstly, a correlation analysis between the potential explanatory variables has been conducted. The potential explanatory variables were grouped into three categories: i) driver-related; ii) pedestrian-related; iii) intersection related, as reported in .
Table 7. Variables implemented in the binomial-logistic regression model.
The matrix of the correlation variables expresses the Pearson ratio (). All the variables with a value of Pearson higher than 0.8 (in bold), imply a high correlation. More specifically, high values of the Pearson correlation coefficient were found for the variables “Pedestrian flow” and “Vehicular flow” (0.91), “Pedestrian flow” and “Distance of pedestrian crossing” (0.97), as well as the “Inclination of road segments” and the “Duration of red phase” (-0.93). Therefore, these correlated variables were not used as independent variables in the same model.
Table 8. Correlation matrix.
Several binomial regression models have been proposed and tested. The significance of the variables and the consistency of the signs of the β coefficients, were evaluated. The developed procedure provided the following best-fitting model ().
Table 9. Binomial logit model.
The model uses as variables the age of pedestrians, divided into age classes, and the duration of red. Both variables are acceptable from a statistical point of view, such as p-value < 0.05. The coefficient signs show that the probability to have a conflict decreases, when the age increases (-0.511), and increases with the duration of red (+0.226). The first aspect is most probably related and could be explained by a higher level of prudence adopted by older pedestrians, while the second could be related to the phenomena of impatience of users that occur by increasing the duration of red (Dr). The values of the odds ratio for the independent variables show that the Dr has the strongest influence, followed by age. More specifically, the odds of conflicts are increased 0.6 times if the age class of pedestrians increases (i.e. young, adult, old), and are increased 1.026 times for an increase of 1 s of the Dr. Therefore, the logit model is:
(5)
(5)
The effects of the variables on the probability of conflict are reported in , showing the trends of the probability to have a conflict in relation to the Dr, associated with the age classes of pedestrians (i.e. young, adult, old). The values of probability of conflicts were obtained from EquationEq. (5)(5)
(5) , varying the values of the variable Dr from 0 to 120s. The process has been conducted for each class of age of pedestrians (young, adult and old), as reported in .
Figure 7. Probability of conflict related to the duration of red and age classes of pedestrians.
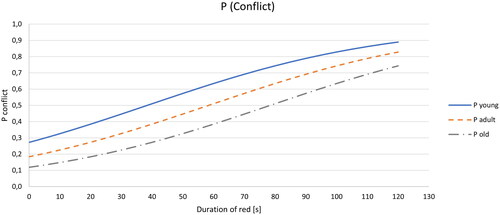
The age of pedestrians has an impact on the probability of conflict. This is clear by analyzing the probability values associated with juveniles (blue curve). The likelihood of conflict increases with the duration of red, and for the same duration of red, reaches higher values for younger road users, than adult and older pedestrians.
6. Conclusions and future perspectives
This study focuses on signalized road intersections, which represent critical points with regard to pedestrian safety. The analysis encompasses three distinct case studies with varying geometric layouts, configurations, and traffic volumes. Within these intersections, a dataset of 270 driver-pedestrian interactions was examined, specifically focusing on different turning maneuvers. The objective of this research was to investigate and develop an innovative methodological approach for the effective analysis of driver-pedestrian interactions and the assignment of severity levels using Surrogate Safety Measures, all while ensuring a manageable computational load. This approach is designed to be easily utilized by public administrations and authorities for assessing pedestrian safety at road intersections. Utilizing video recordings from the three intersections, a model derived from existing literature was implemented to define severity levels based on three fundamental interaction patterns: hard, no, and soft. Additionally, three SSM-based methods were explored to evaluate interaction severity without prior classification into patterns. This approach facilitated the identification of an efficient method for assessing the severity of driver-pedestrian interactions. Method 2, based on PET, closely aligned with the literature-based pattern classification approach and effectively identified interactions with a higher risk level (i.e. conflicts) compared to other SSM-based methods (such as TTC or the simultaneous use of PET and TTC). Notably, the proposed methods offer a high level of simplicity and efficiency in implementation, distinguishing them from previous approaches. These findings corroborate prior research that employed PET values to evaluate the severity of driver-pedestrian interactions (Alhajyaseen et al., Citation2012; Marisamynathan & Vedagiri, Citation2020; Ni et al., Citation2016). Furthermore, the derived binomial logistic model enables the quantification of conflict probability based on pedestrian age and signal duration. The likelihood of conflict increases with longer signal durations, with younger road users exhibiting higher probabilities compared to adult and older pedestrians. As a future extension of this research, expanding the database of driver-pedestrian interactions through the collection of additional in-situ data is envisioned to investigate intersections with different characteristics and traffic conditions. This study lays the foundation for applying the described methodology to further explore driver-pedestrian interactions in the context of signalized intersections. Subsequently, future applications can incorporate computer vision and machine learning techniques to automate conflict analysis.
Author contributions
Valerio Gagliardi: Methodology, Investigation, Software, Data curation, Formal analysis, Writing – original draft, Writing - Review & Editing. Chiara Ferrante: Investigation, Software, Formal analysis, Writing – original draft. Francesco Bella: Conceptualization, Methodology, Investigation, Formal analysis, Writing - Review & Editing, Supervision, Funding acquisition.
Acknowledgments
The authors would like to thank “Agenzia della Mobilità”, Roma Capitale, for providing the video recordings at road intersections. The research was conducted at the Disseminate Laboratory of the Dpt. of Civil, Computer Science, and Aeronautical Technologies Engineering (DICITA) at Roma Tre University. The authors acknowledge funding from the DICITA, Roma Tre University for open-access publication.
Correction Statement
This article has been corrected with minor changes. These changes do not impact the academic content of the article.
Additional information
Funding
Notes on contributors
Valerio Gagliardi
Valerio Gagliardi is a Postdoctoral Researcher in Civil Engineering and Adjunct Professor of Geomatics at the Department of Civil, Computer Science and Aeronautical Technologies Engineering at Roma Tre University. He holds a PhD in Civil Engineering and received his M.Sc. (cum laude) and B.Sc. in Infrastructure and Transportation Engineering from Roma Tre University. He is involved as Principal Investigator and participant in several international and national research projects funded by ESA, ASI, MIUR, Regione Lazio. He has authored/coauthored over 40 papers published in international peer-reviewed journal and conference proceedings. His main research interests include the development of new algorithms, methodologies, and models in road infrastructures monitoring, road safety, and asset maintenance. He is a Chair and Program Committee of a Special Session at the “SPIE Remote Sensing International Conference” and recipient of international awards, including the Best Paper Award at the IEEE AGERS 2021.
Chiara Ferrante
Chiara Ferrante holds a Ph.D. in Civil Engineering, and is serving as a Postdoctoral Researcher at the Department of Civil, Computer Science and Aeronautical Technologies Engineering at Roma Tre University. With a background in Civil Engineering, her research endeavors encompass road safety and human factors, with a specific emphasis on analyzing drivers’ behavior through driving simulators and surrogate safety measures. Chiara’s contributions to this field are centered around comprehending driver reactions and offering valuable insights to improve road safety measures.
Francesco Bella
Francesco Bella is Full Professor of Roads, Railways and Airports at the Department of Civil, Computer Science and Aeronautical Technologies Engineering of Roma Tre University. He holds a Master’s degree in Civil Engineering summa cum laude and a PhD in Environmental Design of Transport Infrastructures. His main research interests include safety of vulnerable road users, implications of autonomous vehicles on traffic safety and road geometric design, optimization of road design taking into account human factors and drivers behavior by mean driving simulation and field investigation, road geometric design consistency and its relation to traffic safety, road pavement defects diagnosis. He took part to several international and national research projects and is currently Principal Investigator for the Project of Relevant National Interest (PRIN 2022) “Accident risk reduction of vulnerable road users: an interdisciplinary – multiperspective approach (ARCADE)”. He has authored more than 150 papers in peer-reviewed journals and conference proceedings and he has been included, since 2019, among the top 2% - cited scientists in the world in the scientific sub- field “logistic and Transportation” (https://elsevier.digitalcommonsdata.com/datasets/btchxktzyw/6).
References
- ACI-ISTAT (2021). Report road accidents.
- Alhajyaseen, W. K. M., Asano, M., & Nakamura, H. (2012). Estimation of left-turning vehicle maneuvers for the assessment of pedestrian safety at intersections. IATSS Research, 36(1), 66–74. doi:10.1016/j.iatssr.2012.03.002
- Almodfer, R., Xiong, S., Fang, Z., Kong, X., & Zheng, S. (2016). Quantitative analysis of lane-based pedestrian-vehicle conflict at a nonsignalized marked crosswalk. Transportation Research Part F: Traffic Psychology and Behaviour, 42(3), 468–478. doi:10.1016/j.trf.2015.07.004
- Amini, R. E., Yang, K., & Antoniou, C. (2022). Development of a conflict risk evaluation model to assess pedestrian safety in interaction with vehicles. Accident; Analysis and Prevention, 175, 106773. doi:10.1016/j.aap.2022.106773
- Ammar, D., Xu, Y., Jia, B., & Bao, S. (2022). Examination of recent pedestrian safety patterns at intersections through crash data analysis. Transportation Research Record: Journal of the Transportation Research Board, 2676(12), 331–341. doi:10.1177/03611981221095513
- Archer, J. (2005). Indicators for traffic safety assessment and prediction and their application in micro-simulation modelling: A study of urban and suburbanintersections [Dissertation]. Lund University.
- Arun, A., Haque Md, M., Bhaskar, A., Washington, S., & Sayed, T. (2021). A systematic mapping review of surrogate safety assessment using traffic conflict techniques. Accident; Analysis and Prevention, 153, 106016. doi:10.1016/j.aap.2021.106016
- Brunetti, A., Buongiorno, D., Trotta, G. F., & Bevilacqua, V. (2018). Computer vision and deep learning techniques for pedestrian detection and tracking: A survey. Neurocomputing, 300, 17–33. doi:10.1016/j.neucom.2018.01.092
- Cooper, P. J. (1984). Experience with traffic conflicts in Canada with emphasis on “post encroachment time” techniques. International calibration study of traffic conflict techniques. Springer.
- European Commission, Road Safety Statistics. (2018).
- European Parliament and Council. (2010). Directive on the framework of deployment of ITS in the field of road transport and for interfaces with other modes of transport.
- Govinda, L., & Ravishankar, K. V. R. (2022). A critical review on pedestrian crossing behaviour and pedestrian-vehicle interactions. Innovative Infrastructure Solutions, 7(5), 313. doi:10.1007/s41062-022-00917-6
- Guido, G., Saccomanno, F., Vitale, A., Astarita, V., & Festa, D. (2011). Comparing safety performance measures obtained from video capture data. Journal of Transportation Engineering, 137(7), 481–491. doi:10.1061/(ASCE)TE.1943-5436.0000230
- Guo, Y., Essa, M., Sayed, T., Haque, M. M., & Washington, S. (2019). A comparison between simulated and field-measured conflicts for safety assessment of signalized intersections in Australia. Transportation Research Part C: Emerging Technologies, 101, 96–110. doi:10.1016/j.trc.2019.02.009
- Guo, Y., Sayed, T., & Zaki, M. H. (2017). Automated analysis of pedestrian walking behaviour at a signalised intersection in China. IET Intelligent Transport Systems, 11(1), 28–36. doi:10.1049/iet-its.2016.0090
- Guttinger, V. A. (1982). From accidents to conflicts: Alternative safety measurement [paper presntation] . Proceedings, Third International Workshop on Traffic Conflicts Techniques, Leidschendam, The Netherlands (pp. 14–26).
- Hayward, J. C. (1971). Near misses as a measure of safety at urban intersections [doctoral thesis]. The Pensilvania State University, Department of Civil Engineering.
- Hussein, M., Sayed, T., Reyad, P., & Kim, L. (2015). Automated pedestrian safety analysis at a signalized intersection in New York City: Automated data extraction for safety diagnosis and behavioral study. Transportation Research Record: Journal of the Transportation Research Board, 2519(1), 17–27. doi:10.3141/2519-03
- Hyden, C. (1975). Relations between conflicts and traffic accidents. Lund Institute of Technology.
- Hyden, C. (1987). The development of a method for traffic safety evaluation: The Swedish traffic conflicts technique (p. 70). Bulletin Lund Institute of Technology, Department.
- Hyden, C., & Linderholm, L. (1984). The Swedish traffic-conflicts technique (pp. 133–139 ) . International Calibration Study of Traffic Conflict Techniques.
- ITF (2022). Road safety annual report 2022. OECD Publishing. doi:10.1787/badaa1a4-en
- Ismail, K., Sayed, T., & Saunier, N. (2011). Methodologies for aggregating indicators oftraffic conflict. Transportation Research Record: Journal of the Transportation Research Board, 2237(1), 10–19. doi:10.3141/2237-02
- Ismail, K., Sayed, T., Saunier, N., & Lim, C. (2009). Automated analysis ofpedestrian-vehicle conflicts using video data. Transportation Research Record: Journal of the Transportation Research Board, 2140(1), 44–54. doi:10.3141/2140-05
- Jahandideh, Z., Mirbaha, B., & Rassafi, A. A. (2017). Modeling the risk intensity of crossing pedestrians in intersections based on selected critical time to collision: A case study of Qazvin City [Paperpresentation] . Proc., 96th Annual Meeting on Transportation Research Board. Transportation Research Board.
- Kaparias, I., Bell, M. G. H., Greensted, J., Cheng, S., Miri, A., Taylor, C., & Mount, B. (2010). Development and Implementation of a Vehicle–Pedestrian Conflict Analysis Method. Transportation Research Record: Journal of the Transportation Research Board, 2198(1), 75–82. doi:10.3141/2198-09
- Kathuria, A., & Vedagiri, P. (2020). Evaluating pedestrian vehicle interaction dynamics at un-signalized intersections: A proactive approach for safety analysis. Accident; Analysis and Prevention, 134, 105316. doi:10.1016/j.aap.2019.105316
- Kumar, A., Paul, M., & Ghosh, I. (2019). Analysis of pedestrian conflict with right-turning vehicles at signalized intersections in India. Journal of Transportation Engineering, Part A: Systems, 145(6), 1–12. doi:10.1061/JTEPBS.0000239
- Laureshyn, A., Ardo, H., Jonsson, T., & Svensson, A. (2009). Application of automatedvideo analysis for behavioural studies: Concept and experience. IET Intelligent Transport Systems, 3(3), 345–357. doi:10.1049/iet-its.2008.0077
- Lord, D. (1996). Analysis of pedestrian conflicts with left-turning traffic. Transportation Research Record: Journal of the Transportation Research Board, 1538(1), 61–67. doi:10.1177/0361198196153800108
- Lu, C., He, X., van Lint, H., Tu, H., Happee, R., & Wang, M. (2021). Performance evaluation of surrogate measures of safety with naturalistic driving data. Accident; Analysis and Prevention, 162, 106403. doi:10.1016/j.aap.2021.106403
- Marisamynathan, S., & Vedagiri, P. (2020). Pedestrian safety evaluation of signalized intersections using surrogate safety measures. Transport, 35(1), 48–56. doi:10.3846/transport.2020.12157
- Ni, Y., Wang, M., Sun, J., & Li, K. (2016). Evaluation of pedestrian safety at intersections: A theoretical framework based on pedestrian-vehicle interaction patterns. Accident; Analysis and Prevention, 96, 118–129. doi:10.1016/j.aap.2016.07.030
- Olszewski, P., Szagała, P., Rabczenko, D., & Zielińska, A. (2019). Investigating safety of vulnerable road users in selected EU countries. Journal of Safety Research, 68, 49–57. doi:10.1016/j.jsr.2018.12.001
- Peesapati, L. N., Hunter, M. P., & Rodgers, M. O. (2018). Can post encroachment time substitute intersection characteristics in crash prediction models? Journal of Safety Research, 66, 205–211. doi:10.1016/j.jsr.2018.05.002
- Perkins, S. R., & Harris, J. L. (1967). Criteria for traffic conflicts characteristics . Report GMR 632. General Motors Corporation.
- Quaye, K., Leden, L., & Hauer, E. (1993). Pedestrian accident and left-turning traffic at signalized intersections (p. 18). Safety Studies Group, University of Toronto.
- Ren, G., Gu, C., Lu, L., Zhou, Z., & Ding, C. (2012). Modeling risk degree of conflictsbetween crossing pedestrians and vehicles at signalized intersections. Journal of Transportation Systems Engineering and Information Technology, 12(5), 76–81. doi:10.1016/S1570-6672(11)60224-9
- Riser, R. (1985). Behaviour in traffic conflict situations. Accident Analysis and Prevention, 17, 179–197.
- Salamati, K., Schroeder, B., Rouphail, N. M., Cunningham, C., Long, R., & Barlow, J. (2011). Development and implementation of conflict-based assessment of pedestrian safety to evaluate accessibility of complex intersections. Transportation Research Record, 2011(2264), 148–155. doi:10.3141/2264-17
- Saunier, N. (2013). Introduction to surrogate analysis in non-motorized safety.
- Sayed, T., Zaki, M. H., & Autey, J. (2013). Automated safety diagnosis of vehicle–bicycle interactions using computer vision analysis. Safety Science. 59, 163–172. doi:10.1016/j.ssci.2013.05.009
- Suzuki, K., Nakamura, H. (2006). Traffic analyzer - The integrated video image processing system for traffic flow analysis [Paper presentation] . Proceedings of the 13th ITS World Congress,
- Svensson, A. (1998). A method for analysing the traffic process in a safety perspective [Doctoral Dissertation]. University of Lund, Lund, Sweden.
- Svensson, A., & Hydén, C. (2006). Estimating the severity of safety related behaviour. Accident; Analysis and Prevention, 38(2), 379–385. doi:10.1016/j.aap.2005.10.009
- Tarko, A. P. (2012). Use of crash surrogates and exceedance statistics to estimate road safety. Accident; Analysis and Prevention, 45, 230–240. doi:10.1016/j.aap.2011.07.008
- Tarko, A. P. (2018). Surrogate measures of safety. In Safe mobility: Challenges, methodology and solutions (Vol. 11, 383–405). Emerald Publishing Limited.
- Tarko, A. P., Davis, G., Saunier, N., Sayed, T., Washington, S. (2009). Surrogate measures of Safety—A White Paper . Transportation Research Board, Washington, D.C.
- Tourinho, L. F. B., & Pietrantonio, H. (2003). Parameters for evaluating pedestrian safetyproblems in signalised intersections using the traffic conflict analysistechnique—A study in Sao Paolo, Brazil. Transportation Planning and Technology, 29(3), 183–216. doi:10.1080/03081060600810923
- Van der Horst, R., & Kraay, R. J. (1986). The Dutch conflict technique—DOCTOR. ICTCTWorkshop.
- Vogel, K. (2002). What characterizes a “free vehicle” in an urban area?. Transportation Research Part F: Traffic Psychology and Behaviour, 5(1), 15–29. doi:10.1016/S1369-8478(02)00003-7
- Washington, S., et al. (2020). Statistical and econometric methods for transportation data analysis. CRC Press.
- World Health Organization (WHO). (2018). Global status report on road safety 2018. World Health Organization. Licence: CC BYNC-SA 3.0 IGO.
- Xin, F., Sun, C., & Wang, X. (2016). Risk evaluation of conflicts between crossing pedestrians and right-turning vehicles at intersections [Paper presentation]. Proc., 95th Annual Meeting on Transportation Research Board, Washington, DC. Transportation Research Board.
- Zaidel, D. M., & Hocherman, I. (1987). Safety of pedestrian crossings at signalized intersections. Transportation Research Record, 1141, 1–6.
- Zaki, M. H., Sayed, T., Tageldin, A., & Hussein, M. (2013). Application of computer vision to diagnosis of pedestrian safety issues. Transportation Research Record: Journal of the Transportation Research Board, 2393(1), 75–84. doi:10.3141/2393-09
- Zhang, S., Abdel-Aty, M., Cai, Q., Li, P., & Ugan, J. (2020). Prediction of pedestrian-vehicle conflicts at signalized intersections based on long short-term memory neural network. Accident; Analysis and Prevention, 148, 105799. doi:10.1016/j.aap.2020.105799
- Zhang, S., Abdel-Aty, M., Wu, Y., & Zheng, O. (2020). Modeling pedestrians’ near-accident events at signalized intersections using gated recurrent unit (GRU). Accident; Analysis and Prevention, 148, 105844. doi:10.1016/j.aap.2020.105844