
 ?Mathematical formulae have been encoded as MathML and are displayed in this HTML version using MathJax in order to improve their display. Uncheck the box to turn MathJax off. This feature requires Javascript. Click on a formula to zoom.
Abstract
This study explores the impact of long-term traffic violations on accident risk, a frequently overlooked aspect in existing research. Analyzing violation data from Guilin, China, over a decade (2010-2020), including accident records from 2016-2020, the study categorizes drivers into three groups based on their cumulative violations. Given the challenges posed by high-dimensional data and the need for interpretability, the study employs a combination of CatBoost and SHAP models to assess factors influencing accident severity across these driver groups. Results indicate that for drivers without cumulative violations, road type, vehicle type, household registration, and age significantly influence accident risk. Among those with 1–18 cumulative violations, road type, cumulative penalty points, vehicle type, and cumulative fines emerge as significant factors. Drivers with more than 19 cumulative violations are affected by road type, vehicle type, driving experience, and terrain. Notably, penalty points are more effective than fines in reducing the risk of serious accidents, and fines prove significant only for those with fewer than 19 cumulative violations over a decade. In summary, the cumulative violation count effectively distinguishes driver groups, highlighting marked variations in accident risk factors. This research offers valuable insights for devising region-specific measures to enhance road safety.
1. Introduction
Despite significant advances in the study of traffic accident causal mechanisms, road traffic accidents remain a leading cause of death for people of all ages (World Health Organization, Citation2022). According to statistics (World Health Organization, Citation2022), road accidents cause 1.35 million deaths and 50 million injuries worldwide each year, and are the leading cause of death among children and adolescents between the ages of 5 and 29. Transportation researchers and policy makers must determine drivers’ crash risk factors since most traffic crashes are caused by human factors (Joo et al., Citation2022). Accordingly, this study proposes an advanced machine-learning based accident risk factor analysis method for analyzing the cumulative effect of traffic violations on accident risk.
Traffic violation records can reveal the consequences of driving habits of drivers and their attitude toward traffic laws. In this regard, there are many studies demonstrating (Assemi & Hickman, Citation2018; Manual & Manual, Citation2010; Shaaban, Citation2017) that traffic violations are one of the major causes of road traffic accidents. Further, some studies have attempted to identify a driver’s crash rate through annual traffic violations and crash involvement rates. Ultimately, it was found that the number of annual traffic violations and crash rates of drivers were positively correlated (Factor, Citation2018), and that drivers with a high number of violations in a year tended to be at a higher risk for crashes (Goldenbeld et al., Citation2011). Some studies have also found a direct relationship between drivers’ historical violations and crash records and future at-fault crashes using four years of crash data and violation data (Joo et al., Citation2022). However, it is important to note that most studies ignore the fact that violations by drivers tend to have a cumulative effect, and therefore the cumulative effect of violations by drivers on crash risk needs to be investigated over a longer time horizon.
In order to reduce driver violations and reduce the risk of accidents, many countries have adopted penalty mechanisms, and similar systems exist in 44 countries, including Japan (1968), Italy (2003), Australia (1970) and China (2004) (Castillo-Manzano & Castro-Nuño, Citation2012). Meanwhile, it has been found that penalty mechanisms (fines and penalty points) can significantly reduce the number of crashes as well as fatalities (Dong et al., Citation2019), and have a positive impact on the overall safety of the road system (Akhtar & Ziyab, Citation2013; De Paola et al., Citation2013). However, it has been suggested that the positive effects of penalty mechanisms (psychological binding on drivers and reduction in the number of accidents) gradually diminish over time (Castillo-Manzano & Castro-Nuño, Citation2012; Mehmood, Citation2010). Therefore, studying the magnitude of the restraining effect of the penalty mechanism on drivers with different driving habits can provide ideas for further optimization of the penalty mechanism.
Unfortunately, previous studies have used more traditional methods of accident risk analysis, which are often biased when the sample size is large and the dimensionality of the features is high. Moreover, most studies using traditional analysis methods usually discard many accidents and violation features due to model limitations, ignoring the interaction between these features and making it difficult to explore the positive or negative effects of each accident feature on accident risk. The emerging ensemble learning models in machine learning can provide a near-perfect answer to these problems. In addition, the cumulative effect of violations has been shown to reflect drivers’ continuous driving behavior over time and is significantly associated with future violations (Shawky et al., Citation2017). The majority of existing studies have primarily delved into the correlation between unlawful behavior and factors contributing to accident risks, with relatively scant consideration given to the cumulative effects of such transgressions, encapsulated in the phenomenon known as the "snowball effect": the notion that a quantitative shift may occur when the number of infractions committed by a driver reaches a certain threshold. Tailoring appropriate intervention measures for driver cohorts exhibiting distinct cumulative offense frequencies could potentially mitigate the occurrence of accidents and reduce accident risks. It is noteworthy that the efficacy of Penalty mechanisms has been subject to extensive discourse in literature. Regrettably, these discussions have often focused on a singular, static demographic, overlooking the varying degrees of acceptance toward fines and penalty point deductions within driver groups with different cumulative violations. Therefore, delving into the constraining efficacy of penalty mechanisms on diverse driver groups holds the potential to inform the formulation of personalized punitive frameworks, optimizing the restraining capabilities of such mechanisms.
To address the above issues, the main objective of this study is to develop an accident risk factor analysis method for drivers with different cumulative numbers of violations over a ten-year period using reproducible long-term datasets (traffic violation data from 2010-2020 and accident data from 2016-2020). In reality, the transgressions of drivers exhibit an accumulative nature, akin to the metaphorical concept of a "snowball effect." It is crucial to note that both violation data and accident data manifest within the same geographic region, with the only disparity lying in the temporal span. Thus, we have gathered driver violation data spanning a decade and meticulously aligned it with accident data from the past five years. This endeavor seeks to delve into the cumulative effects of driver violations and unravel the heterogeneity in the analysis of factors influencing accident risks among drivers with varying cumulative violations.
Firstly, this study clusters drivers based on their cumulative number of violations, and analyzes the variability of accident risk factors for different driver groups. On this basis, the binding effects of fines and penalty points on different driver groups are analyzed separately. In addition, an ensemble learning model driven by data and involving the SHAP interpreter is specified in this study to understand the association of the above factors with accident severity for different driver groups. We aim to answer the following questions in this study: (1) whether cumulative violations and accident severity can be used to categorize drivers; (2) whether there are significant differences in accident risk factors for different groups of drivers with different cumulative violations and whether these risk factors affect different groups of drivers positively or negatively, and (3) whether fines and penalty points are equally effective in binding different driver groups and what further optimization ideas can be implemented.
The paper is organized as follows: Section 2 reviews the factors influencing traffic violations and crash severity and the research on related models. Section 3 presents the methodological framework of this study, with emphasis on the CatBoost-based accident severity classification model and performance evaluation metrics, and the SHAP model for explaining the machine learning black box problem. Section 4 compares the performance of the three models and analyses the model results for different driver groups, as well as the effectiveness of fines and penalty points to constrain different driver groups. Section 5 summarizes some empirical findings as well as some in-depth discussion.
2. Literature review
2.1. Review of violations in crash studies
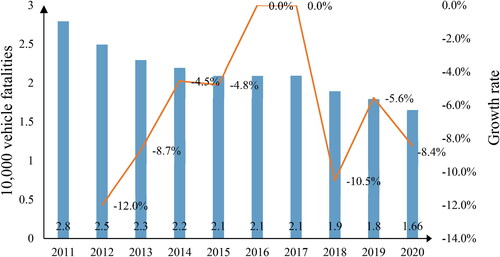
In China, although the number of road traffic accidents has declined, they still cause serious damage, as shown in . The prediction of accident occurrences and the analysis of accident risk factors are two prominent areas within the field of accident analysis. Accident occurrence prediction typically employs accident hotspots and spatiotemporal forecasting to discern patterns in accidents within a specific region, providing a forecast for the future. This paper, however, centers its focus on the analysis of accident risk factors, delving into the distinctions among drivers with different cumulative violations in terms of the analysis of accident risk factors. This endeavor serves as a retrospective examination, drawing upon similar experiences from the past to inform the implementation of relevant measures in real-world scenarios (Hou et al., Citation2023). Many previous studies have shown that regardless of the type of violation, traffic violations as a whole are one of the key factors that increase the risk of road traffic accidents (Jonah, Citation1997; Rothengatter, Citation1997; Shinar, Citation2017). Therefore, it is essential to analyze the factors influencing accidents based on drivers’ violation reports. Previous research findings have shown (Barraclough et al., Citation2016; Barry Watson et al., Citation2015) that traffic violations can, to some extent, reflect the risky driving behaviors of drivers, and that these risky driving behaviors directly or indirectly influence the occurrence of road traffic accidents. For example, analysis of real accident data has shown that drivers with traffic violations are significantly correlated with accidents (Zhang et al., Citation2013). A questionnaire-based study in the Netherlands, on the other hand, showed that vehicles with several violations in a year were more likely to be involved in various road traffic accidents than vehicles with one violation (Goldenbeld et al., Citation2011). Summala et al. (Citation2014), meanwhile, created a control group of drivers in Finland and conducted mail-back interviews after a period of time and finally found that the group of drivers with risky driving behavior still had risky driving behavior, concluding that individual differences in driver behavior persist over decades, perhaps over a lifetime.
Figure 1. National road traffic accident fatalities per 10,000 vehicles and growth rate, China, 2011–2020.
In addition to the association between traffic violations and the number of accidents, some studies have confirmed that specific violations lead to an increase in accident rates and accident severity. These specific violations include failing to signal (Karacasu et al., Citation2011; Yang et al., Citation2007), failing to observe seat belts (Abdel-Aty et al., Citation2012; Mohammadi, Citation2011), speeding (Hatfield & Fernandes, Citation2009; Williams, Citation2006), driving under the influence of alcohol (Abdel-Aty et al., Citation2012; Keall et al., Citation2004), and driving without a license (Zhang, Citation2017).
Further evidence of the link between traffic violations and road traffic accidents comes from studies on the impact of penalty mechanisms on road traffic accidents and driver behavior. In fact, the positive correlation between violations and road traffic accidents has been one of the key assumptions identified by the penalty mechanism (Shinar, Citation2017), and the spatial distribution of violation recording devices also influences the number of accidents to a large extent (Hakkert et al., Citation2001). Akhtar and Ziyab (Citation2013) examined the before and after changes in the number of serious accidents in Kuwait from 2003 to 2009 following the implementation of the penalty point system (PPS) in 2006, concluding that the implementation of the PPS led to a significant reduction in the number of serious accidents in the subsequent period. De Paola et al. (Citation2013), on the other hand, using data on accidents, traffic fatalities and driver violations in Italy from 2001 to 2005 examined the effect of driver restraint following the introduction of the penalty point system (PPS) in 2003 and found that the introduction of the PPS reduced road accidents approximately 9% and traffic fatalities approximately 30%. Furthermore, according to related studies (Evans, Citation2014; Nakahara et al., Citation2011; Oguchi, Citation2016), the US, Japan and France experienced significant reductions in traffic fatalities after controlling traffic violations from a legislative perspective; in Japan, the number of traffic fatalities fell by 59% after more than 30 years of revision of traffic safety regulations and increased penalties for traffic violations; in France, the fatality rate fell by 71. 5% compared to 1972 after severe penalties were imposed on serious violations such as driving under the influence of alcohol and speeding.
In summary, research on the association between traffic violations and accidents can be divided into three main areas: the association between violations and the number of accidents (Barraclough et al., Citation2016; Barry Watson et al., Citation2015), the association between specific violations and the severity of accidents (Abdel-Aty et al., Citation2012; Keall et al., Citation2004), and the association between fines or penalty point mechanisms and the severity of accidents (Factor, Citation2018; Walter et al., Citation2015; B. Watson et al., Citation2015). However, for the analysis of the association between traffic violations and accidents, few studies have taken into account the cumulative effect of drivers’ traffic violations and the variability of factors influencing accidents among drivers with different driving styles, which would result in the conclusions of the above studies may not be applicable to every driver, with low robustness and generalizability (Joo et al., Citation2022). In addition, most studies on penalty mechanisms have considered the effect of penalty mechanisms on the number and severity of accidents, with less consideration given to further optimization of penalty mechanisms. Therefore, it is crucial to explore the differences in accident risk factors and the effectiveness of the penalty mechanism for different driver groups with different cumulative numbers of violations, in order to improve the causal mechanism of road traffic accidents and further optimize the penalty mechanism.
2.2. Review of machine learning in the crash risk factors
In early studies, some scholars have used traditional bivariate or multivariate regression models (Alver et al., Citation2014; Mook & Changwan, Citation2012; Xiao et al., Citation2021), linear programming models (Retallack & Ostendorf, Citation2020) and counting models (Kim et al., Citation2016; B. Watson et al., Citation2015) to analyze the risk factors of accidents, but the same idea of classification is adopted and the traditional models are compared to emerging machine learning models have some disadvantages. A traditional risk factor analysis model often performs unsatisfactorily when confronted with large, multidimensional, noisy data, resulting in significant bias and at the expense of features that are deemed 'non-critical’.
In recent years, there has been a boom in the use of machine learning for traffic accident impact factor analysis, which can address the problem of accident data that is usually large in dimensionality. In most studies, analysis of accident risk factors can be used as a classification problem, where a feature is used as a classification label and then a classification algorithm in machine learning is chosen to learn it. For example, Zhang et al. (Citation2018) use deep learning to tag and capture messages from social media such as twitter, and finally use DBN and LSTM to classify the collected messages in order to detect road traffic accidents; Gu et al. (Citation2018) applied the variation operation of genetic algorithm to traffic accident prediction and established a traffic accident prediction model based on support vector machine; Chen and Chen (Citation2020) used logistic regression model and decision tree model to establish accident severity data model respectively. There are some previous studies (Ashikuzzaman et al., Citation2021; Sun, Citation2014) that take a multi-perspective view of people, vehicles and roads, but again adopt the idea of classification, based on machine learning models to investigate the factors influencing road traffic accidents and filter out the significant factors.
As traditional machine models are prone to overfitting and unsatisfactory model performance, some scholars have attempted to improve the performance of models by combining multiple weak learners to form a strong learner, i.e. ensemble learning. Gradient boosting is an ensemble learning construct based on the boosting method that can achieve excellent results in a variety of practical tasks. It has been the main method used in the last decades to solve learning problems with heterogeneous features, high noise levels and complex dependencies. For example, Shuaiming Chen et al. (Citation2021) proposed the classification of Chinese traffic accident data based on severity in order to investigate the factors influencing accidents among drivers with different driving experience, and used ensemble learning methods such as LightGBM and XGBoost for modeling, and finally the SHAP model was used to explain the output. Dong et al. (Citation2022) developed the use of Shapley additive explanatory analysis to rank risk variables and interpreted the optimal model in order to develop an explainable road traffic injury severity prediction model. The question of which model performs better in accident severity analysis, ensemble learning or traditional models, is also of interest, and therefore a number of scholars have compared the two types of models. For example, Zhou et al. (Citation2020) used the influencing factors affecting the severity of bus and truck accidents as the subject of their study and used five classification algorithms, including multiple logistic regression, plain Bayesian, CART classification tree, SVM and XGBoost were modeled and analyzed, and finally XGBoost was found to have the best performance; Wen et al. (Citation2021) used LightGBM to model a dataset of Texas vehicle crashes that occurred between 2015 and 2017. Finally, LightGBM was found to perform better in terms of MAE and RMSE compared to other traditional classification models. This shows that ensemble learning has a natural advantage in the field of accident severity impact factor analysis.
However, when the features to be processed are large in dimensionality, the ensemble learning models described above are often unable to cope with the situation, resulting in a "dimensional disaster". CatBoost is an ensemble learning method based on Gradient boosting developed by Yandex in recent years (Prokhorenkova et al., Citation2018), which allows users to autonomously set category features, encode and categorize them when they are large in dimensionality, and is therefore widely used in areas where high latitude features need to be processed. The traffic datasets are usually large in dimension, with more classification features, and the features have interactions with each other, so CatBoost work well with them. This paper will compare the model performance of CatBoost with other ensemble learning models (RF and LightGBM) in the analysis of factors influencing accident severity and select the optimal model to interpret its output using the SHAP model.
3. Methodology
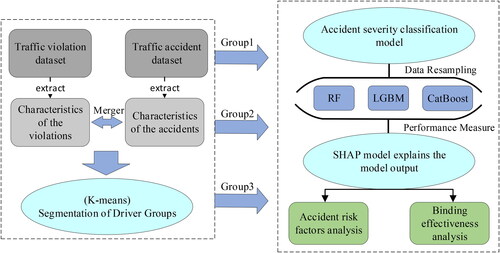
The whole methodology framework of this paper is shown in , which mainly includes the following three parts: (1) the clustering of driver groups; (2) an accident severity classification model based on different driver groups, including data resampling, accident severity classification modeling, model performance comparison; and (3) the SHAP model explains the output of the accident severity classification model.
Figure 2. General methodology framework of this study.
3.1. Data preparation
This paper is based on 20071 historical traffic accident data from 2016 to 2020 and 79495 historical traffic violations of drivers from 2010 to 2020 in Guilin, China. Abnormal values in the data are calibrated and checked using methods such as standardization and multiple covariance testing. Due to the unbalanced nature of accident data and violation data, this paper refers to previous literature (Delen et al., Citation2017; Sun et al., Citation2014) to redefine the accident severity level and count the accident severity labels as GA (General Accidents, 48.0%) for accidents with only a small degree of property damage or injury, and accidents with high levels of fatalities or injuries were counted as SA (Serious Accidents, 51.9%).
In addition, as the accident and violation information were coded in a complex manner, it was recoded (one-hot) and filtered using python. Finally, a total of 29 variables (42 variable names) were retained, as shown in Appendix A. In order to initially explore the differences in the distribution of accident severity for drivers with different cumulative numbers of violations, a simple descriptive statistical analysis was conducted, as shown in . It is noteworthy that, in accordance with China’s "Provisions on the Administration of the Score for Road Traffic Violations," different road traffic violations incur varying penalty points and fines. However, the maximum penalty points for traffic violations are capped at 12 points, and drivers accumulating more than 12 points within a year will have their licenses revoked, necessitating a relearning and retesting process. In contrast, there is no upper limit on fines. Consequently, a prevalent reality in China is that the majority of drivers exhibit a greater aversion to point deductions as a form of punishment. Therefore, it becomes imperative to explore the differences in the constraining impact of fines and penalty points on drivers with varying frequencies of cumulative violations.
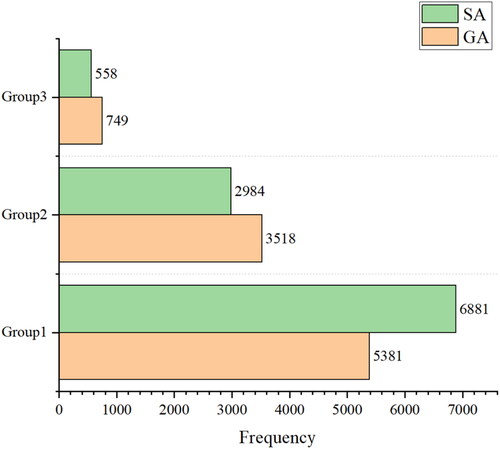
Figure 3. Joint distribution of cumulative violations and accident severity: (a) cumulative number of violations; (b) cumulative penalty points for violations; (c) cumulative amount of fines.
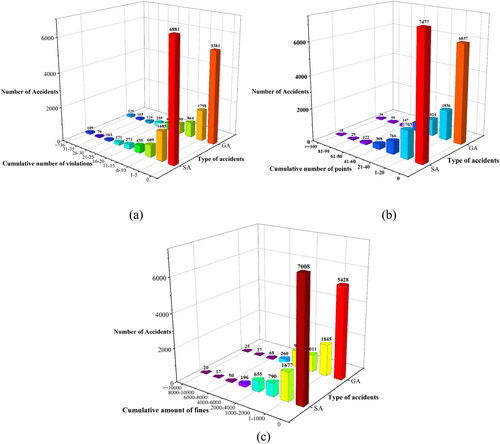
Analysis by :
The number of general accidents (GA) is greater than the number of serious accidents (SA) for drivers who have accumulated a certain number of violations, while the number of SA (56.1%) is greater than the number of GA (43.8%) for drivers who have not accumulated a certain number of violations.
Drivers who have accumulated a certain number of penalty points have more general accidents than serious accidents, while the group of drivers without accumulated penalty points have more SA (55.3%) than GA (44.6%).
Drivers who have accumulated a certain number of fines are involved in more general accidents than serious accidents, while the group of drivers who have not accumulated any fines are involved in a much larger number of SA (56.3%) than GA (43.6%).
From the above analysis, it can be seen that there is a significant difference between drivers without cumulative violation characteristics and drivers with cumulative violation characteristics in terms of the severity of accidents that occur, so it is necessary to segment drivers according to cumulative violation characteristics.
3.2. Clustering of driver groups
After preliminary data processing, the driver’s long-term violation data was summarized into three categories: cumulative number of violations, cumulative amount of fines, cumulative number of penalty points, and merged with accident data for correlation, of which there were 12,262 data with a cumulative number of violations of zero, accounting for about 61.09% in the database, and 7,809 data with a cumulative number of certain violations, accounting for about 38.91%. Consequently, we refer to previous research on classification of driving experience and the spatial distribution of road traffic accidents (Ma et al., Citation2021; Smith et al., Citation2009) and separate drivers without cumulative violations into a group (Group1), while drivers with cumulative violations are clustered using K-means with accident severity and cumulative number of violations as clustering features. It is noteworthy that, as the majority of the sample consists of individuals with no cumulative violation occurrences, we refrain from clustering them to prevent potential biases arising from the skewed sample size.
3.2.1. Algorithm process and principles
The main process of the K-means clustering algorithm is as follows.
Randomly select k objects from the n sample data as the initial clustering canters;
Calculate the distance of each sample to each cluster center separately. Assign the objects to the clusters with the closest distance;
After all objects are assigned, recalculate the canters of the k clusters;
Compare with the canters of the k clusters obtained from the previous calculation, if the cluster center of any cluster has changed, go to step (2), otherwise go to step (5);
The algorithm terminates and outputs the clustering results.
In practice, different initial clustering centers are usually selected and the K-means clustering algorithm is used several times, and the model results are briefly evaluated to select the optimal result based on the clustering performance metric (Hui et al., Citation2006).
The core idea of performing K-means clustering is that given a data set the sum of squares of the minimization errors for the clusters resulting from the clustering divides
The SSE is calculated as follows.
(1)
(1)
Where is the number of clusters;
is the first cluster;
is the sample;
is the cluster center of cluster
3.2.2. Analysis of the clustering results
According to the core idea of the elbow method, as the number of clusters increases, the sample will be more finely divided, the degree of aggregation of each cluster will gradually increase, and the SSE (sum of squared errors, SSE) will gradually become smaller. In other words, the relationship between SSE and number of clusters is the shape of an elbow, and the corresponding value of this elbow is the true number of clusters of the data, a detailed description of which can be found in the literature (Wu, Citation2012). Therefore, in this study, as shown in , the best cluster for clustering the driver groups is
Figure 4. Evaluation of clustering effects: (a) Elbow Method; (b) Silhouette Coefficient.
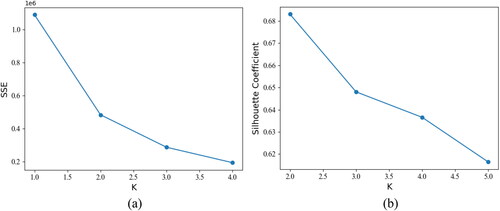
In most cases, we are exploring data without true labels, and such clustering relies entirely on evaluating the densities within clusters and the dispersion between clusters to assess the effect of clustering, with the silhouette coefficient being the most commonly used evaluation metric for clustering algorithms. It can be summarized that the closer the silhouette coefficient is to 1, the better it is, and a negative number means that the clustering effect is very poor. The detailed description can be found in the literature (Rousseeuw, Citation1987). As shown in , it can be seen that the clustering of the driver groups is best when
As a result of the above analysis and assessment, this study segmented the driver groups as follows.
Group 1: Cumulative number of violations = 0.
Group 2: 1
Cumulative number of violations
Group 3: Cumulative number of violations
The distribution of data for each driver group was: Group 1 = 61.0%, Group 2 = 32.4%, Group 3 = 6.6%, as shown in .
Figure 5. Distribution of cumulative number of violations and accidents severity.
3.3. Classification model
3.3.1. Data resampling
In machine learning, modeling unbalanced datasets is a frequent challenge when training models. The data for accident severity are also mostly less for fatal accidents and more for minor injuries or property damage, so the data need to be resampled before modeling (Chawla et al., Citation2002). In this paper, the SMOTE (Synthetic Minority Over-sampling Technique, SMOTE) method of over-sampling is used
3.3.2. CatBoost
Considering the high latitude, multi-noise and large sample characteristics of traffic violation data and traffic accident data, general machine learning models are prone to overfitting and limited model performance. Therefore, this paper adopts CatBoost (Categorical Boosting, CatBoost), a Boosting-based method in ensemble learning, to build an accident severity classification recognition model.
Firstly, the CatBoost model uses the GBDT (Gradient Boosting Decision Tree, GBDT) as its basic structure, and the Gradient Boosting framework has been commonly used in accident impact factor analysis (Yao et al., Citation2022), and can be seen as an additive model consisting of trees:
(2)
(2)
Where represents the base decision tree;
represents the number of decision trees;
is the objective function to be obtained.
For classification algorithms, the loss function generally consists of two types of loss functions, logarithmic loss function and exponential loss function. For binary classification, if a log-likelihood loss function similar to logistic regression is used, the loss function as shown in EquationEquations (3)∼(4)(4)
(4) :
(3)
(3)
(4)
(4)
GBDT for the newly generated decision tree, using the best negative gradient fit value of each leaf node as a reference, can be expressed as shown in EquationEquation (5)(5)
(5) :
(5)
(5)
The CatBoost algorithm was originally designed to better handle categorical features in GBDT, and the simplest way to do this is to replace the categorical feature with the average of the corresponding labels. The CatBoost adds a prior distribution term to this, and for a given sample, the TS value depends on the observation history. In order to apply this idea on offline data, CatBoost randomly sorts the data and uses the pre-sample data to calculate the TS value for that sample category value, forming the Ordered TS method, which is the main idea of the algorithm, as shown in EquationEquation (6)(6)
(6) :
(6)
(6)
Where is the prior term added,
is usually a weighting factor greater than 0,
is the feature vector,
is the target.
The advantages of CatBoost are as follows:
Ordered TS is used to process categorical features. Firstly, the categorical features are counted and the frequency of occurrence of a category is calculated, then the hyperparameters are added to generate new numerical features, eliminating the need to manually process the categorical features;
CatBoost uses a combination of category features, allowing the use of associations between features, which greatly enriches the feature dimension.;
CatBoost’s base model uses a symmetric tree, and uses the Ordered boosting method to prevent overfitting of the model.
Details of the CatBoost model can be found in the literature (Prokhorenkova et al., Citation2018).
3.4. SHAP interpreter
The biggest obstacle to the use of machine learning methods in the field of traffic safety is the black box problem of the model, where the interactions within the features during model training and the contribution of features to model performance and classification accuracy are unknown to us. Therefore, in the field of traffic safety, in addition to the accuracy and performance of the model, the impact of features on the accuracy of the model and the interaction between features is also a concern that cannot be ignored. In this paper, the output of the model is explained using the SHAP (Shapley Additive exPlanations) model based on game theory (Rao, Citation1987), which actually attributes the output value to the shapley value of each feature, i.e. calculates the shapley value of each feature and measures the impact of the feature on the final output value accordingly.
The SHAP model can be interpreted for the output value of the model as if the SHAP value is positive, which means that it indicates that the feature has a positive effect on the model results, and in this paper, when the SHAP value is positive, it means that the feature tends to exacerbate the severity of the accident. If the SHAP value is negative, it is the opposite.
4. Results and discussions
4.1. Model performance evaluation
Hyperparameter tuning is one of the keys to improve the performance of machine learning. Excellent parameters can improve the iterative performance of a model, prevent underfitting and overfitting, and improve the evaluation metrics such as precision and accuracy of the model.
This study uses the Hyperopt (Hyperparameter Optimization) open-source library based on Bayesian optimization to tune the hyperparameters of the model. Hyperopt can optimize models with hundreds of parameters on a large scale and allows the best parameters to be obtained for a given model, see the for an example of Hyperopt library tuning. Hyperopt has been used extensively for hyperparameter tuning for machine learning (Czako et al., Citation2021; Zhang et al., Citation2022). The optimal parameters of CatBoost are shown in .
Figure 6. Hyperopt on RF tuning.
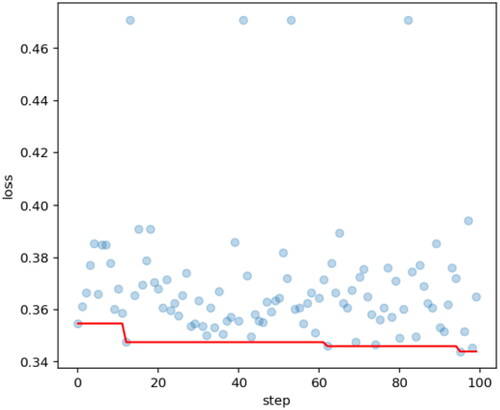
Table 1. CatBoost parameter tuning results.
This paper uses AUC and F1 metrics to evaluate model performance. Meanwhile, this study will compare the performance of the CatBoost model with other ensemble learning (RF and LightGBM) models. The AUC values are judged on .
Table 2. Criteria used by AUC to judge the merit of classifiers (Ling et al., Citation2003).
In this study, the dataset was randomly partitioned in a 7:3 ratio using Python, 30% of the data were used as the validation set and 70% as the training set. The 10-fold cross-validation was used to find the optimal hyperparameters and the average AUC value of the model during training. In addition, the models were built and tuned for each of the three types of driver groups to compare the model performance. The optimal hyperparameters of the CatBoost model are shown in .
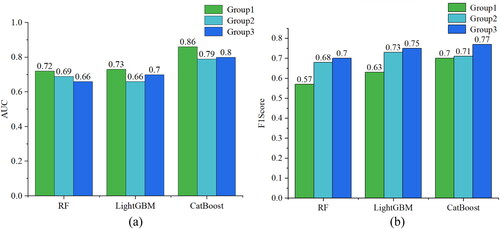
As shown in , CatBoost has AUC values of 0.86, 0.79, 0.80 for the three driving populations, compared to 0.72, 0.69, 0.66 and 0.73, 0.66, 0.70 for RF and LightGBM respectively, which shows that CatBoost outperforms the other two models in terms of classification performance, and with AUC > 0.5, it can as a classifier. Similarly, the F_Score of CatBoost is 0.70, 0.71, 0.77, which is better than RF (0.57, 0.68, 0.7) and LightGBM (0.63, 0.73,0.75), indicating that CatBoost has a better fitting accuracy and the model results have better references. The AUC values and F_Score of CatBoost show better performance than the other models. Score showed superior results compared to other models, and also provided a basis for the subsequent characterization work in this study.
Figure 7. Model performance: (a) AUC; (b) F_Score.
4.2. Feature analysis
Based on the output of CatBoost, this section uses the SHAP model to explain the effect of features on the model and the interaction between features, followed by a discussion around three main questions: what factors increase the risk of serious accidents for groups of drivers with different cumulative numbers of violations? Are there significant differences in these factors? And what are the possible explanations?
The shows the average absolute influence degree of each feature on the model output magnitude, different colors in the figure represent different labels and accident severity, class 0 represents SA (Serious Accidents) and class 1 represents GA (General Accidents). In addition, due to some limitations in image size, we have only filtered out the top 20 important factors that have an impact on the model output, and because the variable names are too long, we present them in code, as shown in Appendix A.
Figure 8. Feature importance on accident severity: (a) Group 1; (b) Group 2; (c) Group 3.
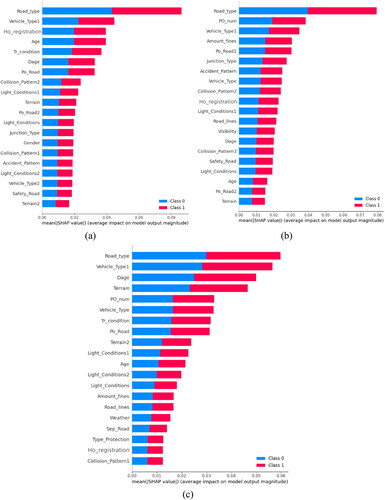
As shown in , road type is the strongest predictor of accident severity levels for Group1 (group of drivers with no cumulative number of violations) and is twice as strong as the second most influential factor, vehicle type1 (type of vehicle). In addition, ho_registration (household registration), age, tr_condition (travel condition), dage (driving experience), po_road (position in the road cross-section) also have an important influence on the output of the model. Collision pattern1 (collision pattern), light_condition2 (lighting condition), terrain, etc. have less influence on the model output.
As shown in , road type was also the strongest predictor of crash severity levels for Group 2 (the group of drivers with between 1 and 18 cumulative violations) and was twice as strong as the second most influential factor, po_num (cumulative penalty points for violations). In addition, vehicle_type1 (type of vehicle), amount_fines (cumulative amount of fines), po_road1 (position in the road cross-section1), junction_type (type of junction section), accident pattern, vehicle_type (type of vehicle) and other features also have a significant impact on the model output. The features such as age, po_road2(position in the road cross-section) and terrain have less influence on the model.
As shown in , road type was also the strongest predictor of crash severity for Group 3 (drivers with more than 9 cumulative violations) and was twice as strong as the second most influential factor, vehicle_type1 (type of vehicle). In addition, dage (driving experience), terrain, po_num (cumulative penalty points for violations), vehicle_type (type of vehicle), tr_condition (travel condition), po_road1 (position in the road cross-section), etc. also have an important influence on the output of the model. In contrast, sep_road (physical separation of the road), collision_Pattern1(collision pattern), etc. have less influence on the model.
The comparison reveals that the most influential factor for all three driver groups is the road type factor, and since Group1 has no cumulative number of violations, its two variables of cumulative amount of fines and cumulative number of penalty points are not considered, except for vehicle type1 (type of vehicle) which has a significant influence in all three driver groups, but ho_registration (household registration) and age were only significant predictors of accident severity levels in Group1 and were less influential in Group2 and Group3. It can therefore be seen that there are significant differences in driver groups with different numbers of cumulative violations.
The above diagram can only analyze the important influences affecting the model output and does not address the question we started with: "Do these factors make a significant difference? " "And what are the possible explanations?" We therefore need to analyze this further with the help of the SHAP summary plot. As shown in , each field represents the effect of the characteristic factor on the probability of SA occurring in that driver group. The SHAP values rank the characteristics on the left-hand side of the Y-axis, and the X-axis is the proportion of the SHAP values calculated for all samples. The color bars then provide more detail on how each feature influenced SA. Each point in the graph represents a sample of data and is colored from low (blue) to high (red) according to the value of the variable.
Figure 9. SHAP summary plots of SA: (a) Group 1; (b) Group 2; (c) Group 3.
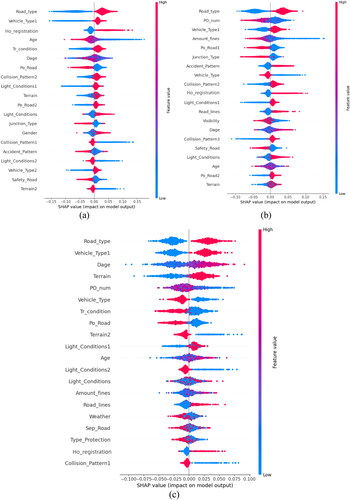
As can be seen from , road type is the most important influence for each driver group and the SHAP value is also positive when the road type is larger, representing that the risk of SA will be increased when the road type is a non-urban road. Possible explanations for this are that non-urban roads have a more sparser distribution of electronic policing devices, less psychological constraint on drivers and excessive speed, leading to an increased probability of SA, and similar conclusions have been reached in other literature (Lv et al., Citation2022; Ma et al., Citation2021). In addition, for the Group1 ho_registration (household registration) and age are also important influencing factors for this group, and the SHAP value is positive when the household registration is larger and positive when the age is smaller, representing that when the household registration is nonagricultural, it increases the probability of SA, and the younger the driver is, the greater the risk of SA. The possible explanation for this is that for Group1, the younger they are, the less social experience, driving experience, judgment and resilience they will have, and the less they will be able to avoid an accident in time, increasing the risk of SA(S. Chen et al., Citation2021); Similarly, non-agriculture drivers mostly drive on slow urban roads, and when driving on non-urban roads, the lack of monitoring and restraint from violation recording devices, excessive speed and lack of resilience will increase the probability of SA. These two factors have less of an impact on Group2 and Group3. In summary, increasing the distribution density of illegal recording device in non-urban road areas can effectively reduce the severity of accidents. Driving skills training should be increased for nonagricultural and younger drivers in Group 1 to improve their risk avoidance ability.
A simple analysis of the other characteristics shows that comparing Group1 and Group3 shows that the effect of the pre-accident driving status on the two driver groups is inconsistent, and driving straight before an accident increases the risk of an accident for Group3 but not for Group1. This could be explained by the fact that drivers with more than 19 cumulative violations have an aggressive driving behavior, driving too fast, and when driving in mountainous terrain (with positive SHAP values) are extremely vulnerable to collisions with oncoming traffic or vehicles in their own lane (Shankar et al., Citation1995), and they are at greater risk of SA, while there is no impact on drivers with no cumulative violations. Driving experience has different effects on different groups, with the risk of SA being higher for Group 1 drivers with less driving experience and the probability of SA increasing for Group 2 and Group 3 drivers with more driving experience. A possible explanation for this is that people who have not accumulated violations tend to have a more cautious driving behavior, and the smaller their driving experience or age, the less able they are to cope with an accident. In contrast, those who have accumulated a certain number of violations tend to have an aggressive driving behavior. The probability of SA increases dramatically for a short period of time until an accident occurs, the finding that is also similar to other literature (Xiao et al., Citation2021). Since different driver groups have completely distinct driving behaviors, it is important to develop unique approaches to reduce the severity of accidents for different driver groups, such as restricting the speed of vehicles driven by Group3 and; and for Group1, strengthening risk avoidance capabilities.
In contrast to the above analysis, the Group1 does not have a cumulative amount of fines and cumulative penalty points for violations, while in the group of drivers who have accumulated a certain number of violations po_num (cumulative penalty points for violations) has a significant impact on both Group2 and Group3 and its importance ranking is always higher than amount_fines (cumulative amount of fines). Furthermore, as the number of cumulative penalty points for violations decreases, the SHAP value is positive, i.e. the smaller the number of cumulative penalty points for violations, the greater the risk of SA occurring. One possible explanation is that when there are fewer cumulative penalty points for violations, the weaker the psychological restraint effect on the driver, the more likely the driver is to drive too fast and therefore at a higher risk of SA. Furthermore, the number of penalty points for violations in China is limited to 12 points per year, and when the number of penalty points exceeds 12 points, drivers are banned from driving, but no such provisions apply to fines. From a scientific perspective, this study demonstrates this objective fact. The above is only a general analysis of fines and penalty points, so we need to further analyze the groups of drivers who have accumulated a certain number of violations, i.e. Group2 and Group3, to explore the intrinsic meaning of the cumulative amount of fines and the cumulative number of penalty points in different groups of drivers.
4.3. Binding effectiveness analysis
The above analysis further confirms the feasibility of using the cumulative number of violations to classify drivers in this study, and therefore we need to explore it further. In and , the vertical axis represents the SHAP value of the feature, and the horizontal axis represents the value of the feature. Thus the SHAP dependency image gives an overall picture of how the number of fines or penalty points positively or negatively affects the level of accident risk, and usually requires us to take a look in a global context. Due to the limitations of image presentation, this paper encodes the horizontal axis feature value, as shown in .
Figure 10. SHAP dependency plots of cumulative amount of fines: (a) Group2; (b) Group3.
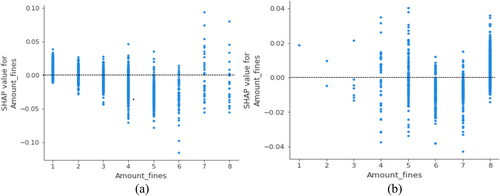
Figure 11. SHAP dependency plots of cumulative penalty points for violations: (a) Group2; (b) Group3.
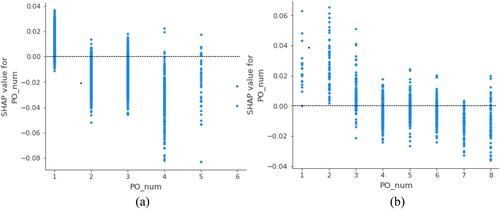
Table 3. Fines and penalty points codes.
As shown in , it can be seen from that the SHAP value gradually becomes negative as the amount of fines increases in Group2, representing that the fines reduce the risk of SA occurring in Group2 to some extent. In contrast, when the cumulative amount of fines in Group3 exceeds $3,500, the SHAP value gradually increases and the risk of SA occurring increases. Drivers who break the law often have a fixed style of driving, so if they cumulatively have a high number of violations, they break the law habitually. The above findings are similar to those in some research studies (Alkinani et al., Citation2020; Precht et al., Citation2017).
As shown in , unlike the variability in cumulative amounts of fines, the SHAP values all gradually decrease as the cumulative number of penalty points for violations increases, i.e. penalty points are effective in reducing the risk of SA. This finding is also consistent with the reality in other countries (Sagberg & Sundfør, Citation2019), where as the number of penalty points in a year approaches the 12 point limit, the majority of drivers will change their driving behavior in favor of more cautious driving and slow down moderately in areas with a high concentration of recorded violation devices, which would significantly reduce the probability of SA.
The preceding analysis indicates that, to a certain extent, penalty points exhibit a greater efficacy in constraining drivers compared to fines. Notably, fines display a moderate effectiveness in influencing drivers within the 1-18 cumulative violations range (Group 2), and a relatively diminished impact on those with 19 or more cumulative violations (Group 3). Drawing inspiration from these findings, a tailored penalty system can be devised, aligning with the cumulative violation count of driver groups, thus maximizing psychological restraint and diminishing accident risks within each driving cohort.
Additionally, based on the insights gleaned:
For Group 2 or Group 3, targeted security retraining is recommended to enhance their security awareness.
Group 1 should prioritize the development of risk avoidance strategies and emergency response capabilities.
These recommendations not only contribute to advancements in relevant research areas but also serve as a foundation for the traffic management department’s system development.
5. Conclusions
This study examines the differences in accident risk factors between different driver groups with different cumulative numbers of violations by combining ensemble learning and SHAP models, and we also investigate the differences in the binding effect of fines and penalty points on different driver groups. Our intentions are detailed by four major steps: Data preparation, Clustering of driver groups, Classification, and Interpretation. The classification results show that CatBoost has greater advantages over RF and LightGBM. The explanation by SHAP model demonstrates the variability of factors influencing accident severity for driver groups with different cumulative number of violations. Our findings can be summarized as follows:
First, this paper clusters and partitions driver groups that have different cumulative numbers of violations using K-means clustering with the cumulative number of violations and accident severity as clustering features. As a result of subsequent research, it has demonstrated that the cumulative number of violations can reflect a driver’s long-term driving behavior and the validity of using the cumulative number of violations to classify drivers, thus enabling the improvement of research in related fields. Therefore, in the future, we can consider using the cumulative number of violations to classify different driver groups and establish individual rules and regulations, which will be more effective in reducing the number of road traffic accidents.
Second, the CatBoost model performed best in the analysis of the factors influencing accident severity, with AUC values of 0.86, 0.79, 0.80 and F_Score of 0.70, 0.71, 0.77 for the three driver groups respectively, implying that CatBoost has some potential for application in the field of traffic safety.
Third, regardless of the driver group, road type was the strongest predictor of accident severity levels. In addition, the variables household registration, age, travel condition, driving experience, position in the road cross-section had a significant influence on the accident severity of the group with no cumulative number of violations. In the group of drivers with a cumulative number of violations between 1 and 18, cumulative penalty points for violations, type of vehicle, cumulative amount of fines, position in the road cross-section, the variables such as type of vehicle, driving experience, terrain, cumulative penalty points of violations, travel condition, etc. had a significant impact o-n the severity of accidents in this group; among drivers with a cumulative number of violations greater than 19, type of vehicle, driving experience, terrain, cumulative penalty points for violations, travel condition, etc. had a significant impact on the severity of accidents in this group. It can be seen that the importance of these variables varies for different driver groups, which further confirms that there are significant differences between drivers with different cumulative numbers of violations. Further, in the future, targeted safety retraining for different driver groups should be enhanced and the distribution density of illegal recording devices should be increased, ultimately achieving the goal of reducing drivers’ illegal behavior and thus road traffic accidents.
Finally, this paper confirms that penalty points are more effective than fines in reducing the risk of serious accidents, whereas fines are only effective for drivers with 1-18 cumulative violations and are somewhat less effective for drivers with more than 19 cumulative violations. Accordingly, the penalty system should be optimized for different driver groups in order to achieve the greatest psychological restraint for drivers with different cumulative violations. Our goal is to reduce road traffic accidents by preventing traffic violations.
Ultimately, we confirm that there are significant differences in the driver groups with different cumulative numbers of violations. Merging the driver’s long-term violation data into traffic accident-related studies can broaden the ideas of accident influence factor analysis. Moreover, several limitations will be addressed in the subsequent study. For example, we focus on the cumulative characteristics of drivers’ long-term traffic violations and road traffic accidents. However, it does not compare the severity of accidents with specific types of violations, and the types of traffic violations are actually more complex and diverse. A further study can follow the example of spatial correlation between road traffic accidents and traffic violations (Kumar et al., Citation2017). Secondly, the data presented in this paper are based on road traffic accidents and traffic violations in Guilin, China. In fact, each city has a different geographical distribution, different climate, different modes of transport, different levels of development, and different cultures. In any case, however, the way in which this study analyzes the problem is somewhat informative. The sample size could be expanded in the future to eliminate or reduce the influence of geographic factors, such as using open accident datasets with nationwide distribution (Moosavi et al., Citation2019). Finally, this study has treated each accident as an independent event, overlooking the correlation between cumulative violations and cumulative accident counts. However, there may be an accumulative effect in the occurrence of accidents as well, which will be further addressed and refined in future research.
Disclosure statement
The authors declare that they have no known competing financial interests or personal relationships that could have appeared to influence the work reported in this paper.
Additional information
Funding
Notes on contributors
Tao Wang
Tao Wang ([email protected]) earned his Ph.D. degree in traffic engineering from Southeast University in 2017. From 2010 to 2019, he served as a teacher in the School of Architecture and Transportation Engineering, Guilin University of Electronic Science and Technology, Guilin 541004, China. His research interests include traffic behavior and safety, urban traffic planning and design, traffic data analysis, and intelligent transportation.
Xingchen Yan
Xingchen Yan ([email protected]) earned his Ph.D. degree in faculty of transportation from Southeast University in 2017, and now he served as a teacher in the School of Nanjing Forestry University. His research is oriented toward social hot issues: the higher running speed and larger mass of e-bikes bring greater impact on urban traffic safety, traffic safety accidents caused by e-bikes are increasing year by year, and the problem of bicycle traffic flow operation has caused widespread social concern; on the other hand, shared bikes and public bikes are widely popular in cities, but illegal and illegal parking and indiscriminate parking are more serious problems, and the above new mode of bicycle parking brings greater interference and impact on the operation of other traffic modes and urban environment, which is of concern to the government, city managers and travelers.
Xiaofei Ye
Xiaofei Ye ([email protected]) earned his Ph.D. degree in transportation engineering from Southeast University in 2013. Currently, he is an assistant professor with the Department of Logistics Management, School of Maritime and Transportation, Ningbo University, Ningbo 315211, China. His research interests include parking planning and management, nonmotorized vehicle and pedestrian traffic flow theory, traffic reliability, and advanced traffic information systems.
Changxi Ma
Changxi Ma ([email protected]) earned his Ph.D. degree in management science and engineering from Huazhong University of Science and Technology in 2002. At present, he is a professor and doctoral supervisor in the School of Transportation of Lanzhou Jiaotong University, the chairman of the Technical Committee on Traffic Operation Safety of World Transport Congress (2017-2019), cochairman of the Technical Committee on Traffic Safety Policy and Transportation Management of World Transport Congress (2020-2022), member of the Standing Committee of Young Science and Technology Member of the Standing Committee of the Young Scientist Committee of China Communications and Transportation Association, Peer Review Expert of the National Natural Science Foundation of China and Regional Fund Projects, Member of the Expert Pool of Science and Technology Management Information System of the Ministry of Education, Senior Member of the China Highway Society, and one of the initiators of Young Scholars Forum of Traffic Engineering and Management.
References
- Abdel-Aty, M., Hassan, H., & Siddiqui, C. (2012). Young drivers safety study final report. Florida Department of Transportation District, 5.
- Akhtar, S., & Ziyab, A. H. (2013). Impact of the penalty points system on severe road traffic injuries in Kuwait. Traffic Injury Prevention, 14(7), 743–748. https://doi.org/10.1080/15389588.2012.749466
- Alkinani, M. H., Khan, W. Z., & Arshad, Q. (2020). Detecting human driver inattentive and aggressive driving behavior using deep learning: Recent advances, requirements and open challenges. IEEE Access, 8, 105008–105030. https://doi.org/10.1109/ACCESS.2020.2999829
- Alver, Y., Demirel, M. C., & Mutlu, M. M. (2014). Interaction between socio-demographic characteristics: Traffic rule violations and traffic crash history for young drivers. Accident; Analysis and Prevention, 72, 95–104. https://doi.org/10.1016/j.aap.2014.06.015
- Ashikuzzaman, M., Akram, W., Anik, M. M. I., Hasan, M., Ali, M. S., & Jabid, T. (2021). PSO-ANN in preventing traffic collisions: A comparative study. Indonesian Journal of Electrical Engineering and Computer Science, 24(3), 1796–1803. https://doi.org/10.11591/ijeecs.v24.i3.pp1796-1803
- Assemi, B., & Hickman, M. (2018). Relationship between heavy vehicle periodic inspections, crash contributing factors and crash severity. Transportation Research Part A: Policy and Practice, 113, 441–459. https://doi.org/10.1016/j.tra.2018.04.018
- Barraclough, P., af Wåhlberg, A., Freeman, J., Watson, B., & Watson, A. (2016). Predicting crashes using traffic offences. A meta-analysis that examines potential bias between self-report and archival data. PloS One, 11(4), e0153390. https://doi.org/10.1371/journal.pone.0153390
- Castillo-Manzano, J. I., & Castro-Nuño, M. (2012). Driving licenses based on points systems: Efficient road safety strategy or latest fashion in global transport policy? A worldwide meta-analysis. Transport Policy, 21, 191–201. https://doi.org/10.1016/j.tranpol.2012.02.003
- Chawla, N. V., Bowyer, K. W., Hall, L. O., & Kegelmeyer, W. P. (2002). SMOTE: Synthetic minority over-sampling technique. AI Access Foundation, (1). https://doi.org/10.1613/jair.953
- Chen, M., & Chen, M. (2020). Modeling road accident severity with comparisons of logistic regression, decision tree and random forest. Information, 11(5), 270. https://doi.org/10.3390/info11050270
- Chen, S., Shao, H., & Ji, X. (2021). Insights into factors affecting traffic accident severity of novice and experienced drivers: A machine learning approach. International Journal of Environmental Research and Public Health, 18(23), 12725. https://doi.org/10.3390/ijerph182312725
- Czako, Z., Sebestyen, G., & Hangan, A. (2021). AutomaticAI – A hybrid approach for automatic artificial intelligence algorithm selection and hyperparameter tuning. Expert Systems with Applications, 182, 115225. https://doi.org/10.1016/j.eswa.2021.115225
- De Paola, M., Scoppa, V., & Falcone, M. (2013). The deterrent effects of the penalty points system for driving offences: A regression discontinuity approach. Empirical Economics, 45(2), 965–985. https://doi.org/10.1007/s00181-012-0642-9
- Delen, D., Tomak, L., Topuz, K., & Eryarsoy, E. (2017). Investigating injury severity risk factors in automobile crashes with predictive analytics and sensitivity analysis methods. Journal of Transport & Health, 4, 118–131. https://doi.org/10.1016/j.jth.2017.01.009
- Dong, H., Jia, N., Tian, J., & Ma, S. (2019). The effectiveness and influencing factors of a penalty point system in China from the perspective of risky driving behaviors. Accident; Analysis and Prevention, 131, 171–179. https://doi.org/10.1016/j.aap.2019.06.005
- Dong, S., Khattak, A., Ullah, I., Zhou, J., & Hussain, A. (2022). Predicting and analyzing road traffic injury severity using boosting-based ensemble learning models with SHAPley Additive exPlanations. International Journal of Environmental Research and Public Health, 19(5), 2925. https://doi.org/10.3390/ijerph19052925
- Evans, L. (2014). Traffic fatality reductions: United States compared with 25 other countries. American Journal of Public Health, 104(8), 1501–1507. https://doi.org/10.2105/ajph.2014.301922
- Factor, R. (2018). An empirical analysis of the characteristics of drivers who are ticketed for traffic offences. Transportation Research Part F: Traffic Psychology and Behaviour, 53, 1–13. https://doi.org/10.1016/j.trf.2017.12.001
- Goldenbeld, C., Reurings, M., Van Norden, Y., & Stipdonk, H. (2011). The relation between traffic offences and road crashes: Preliminary study making use of Central Fine Collection Agency (CJIB) data.
- Gu, X., Li, T., Wang, Y., Zhang, L., Wang, Y., & Yao, J. (2018). Traffic fatalities prediction using support vector machine with hybrid particle swarm optimization. Journal of Algorithms & Computational Technology, 12(1), 20–29. https://doi.org/10.1177/1748301817729953
- Hakkert, A. S., Gitelman, V., Cohen, A., Doveh, E., & Umansky, T. (2001). The evaluation of effects on driver behavior and accidents of concentrated general enforcement on interurban roads in Israel. Accident; Analysis and Prevention, 33(1), 43–63. https://doi.org/10.1016/S0001-4575(00)00014-2
- Hatfield, J., & Fernandes, R. (2009). The role of risk-propensity in the risky driving of younger drivers. Accident; Analysis and Prevention, 41(1), 25–35. https://doi.org/10.1016/j.aap.2008.08.023
- Hou, L., Pei, Y., & He, Q. (2023). A car following model in the context of heterogeneous traffic flow involving multilane following behavior. Physica A: Statistical Mechanics and Its Applications, 632, 129307. https://doi.org/10.1016/j.physa.2023.129307
- Hui, X., Wu, J., & Jian, C. (2006). K-means clustering versus validation measures: A data distribution perspective. IEEE Xplore. https://doi.org/10.1109/TSMCB.2008.2004559
- Jonah, B. A. (1997). Sensation seeking and risky driving: A review and synthesis of the literature. Accident; Analysis and Prevention, 29(5), 651–665. https://doi.org/10.1016/S0001-4575(97)00017-1
- Joo, Y. J., Kho, S. Y., Kim, D. K., & Park, H. C. (2022). A data-driven Bayesian network for probabilistic crash risk assessment of individual driver with traffic violation and crash records. Accident; Analysis and Prevention, 176, 106790. https://doi.org/10.1016/j.aap.2022.106790
- Karacasu, M., & Er, A. (2011). An Analysis on Distribution of Traffic Faults in Accidents, Based on Driver’s Age and Gender: Eskisehir Case. Procedia - Social and Behavioral Sciences, 20, 776–785. https://doi.org/10.1016/j.sbspro.2011.08.086
- Keall, M. D., Frith, W. J., & Patterson, T. L. (2004). The influence of alcohol, age and number of passengers on the night-time risk of driver fatal injury in New Zealand. Accident; Analysis and Prevention, 36(1), 49–61. https://doi.org/10.1016/S0001-4575(02)00114-8
- Kim, D. H., Ramjan, L. M., & Mak, K. K. (2016). Prediction of vehicle crashes by drivers’ characteristics and past traffic violations in Korea using a zero-inflated negative binomial model. Traffic Injury Prevention, 17(1), 86–90. https://doi.org/10.1080/15389588.2015.1033689
- Kumar, S., Toshniwal, D., & Parida, M. (2017). A comparative analysis of heterogeneity in road accident data using data mining techniques. Evolving Systems, 8(2), 147–155. https://doi.org/10.1007/s12530-016-9165-5
- Ling, C. X., Huang, J., & Zhang, H. (2003). AUC: A statistically consistent and more discriminating measure than accuracy. Paper presented at the Ijcai.
- Lv, H., Li, H., Sze, N. N., & Ren, G. (2022). The impacts of non-motorized traffic enforcement cameras on red light violations of cyclists at signalized intersections. Journal of Safety Research, 83, 310–322. https://doi.org/10.1016/j.jsr.2022.09.005
- Ma, Z., Mei, G., & Cuomo, S. (2021). An analytic framework using deep learning for prediction of traffic accident injury severity based on contributing factors. Accident; Analysis and Prevention, 160, 106322. https://doi.org/10.1016/j.aap.2021.106322
- Manual, N. R. C. T. R. B. T. F. o D. o t H. S., & Manual, T. O. J. T. F. o t H. S. (2010). Highway safety manual (Vol. 1). AASHTO.
- Mehmood, A. (2010). Evaluating impact of demerit points system on speeding behavior of drivers. European Transport Research Review, 2(1), 25–30.https://doi.org/10.1007/s12544-010-0027-0
- Mohammadi, G. (2011). Prevalence of seat belt and mobile phone use and road accident injuries amongst college students in Kerman, Iran. Chinese Journal of Traumatology (English Edition), 14(3), 165–169. https://doi.org/10.3760/cma.j.issn.1008-1275.2011.03.008
- Mook, Y. H., & Changwan, K. (2012). A prediction model on traffic accidents and violation of traffic acts by driver’s characteristics [운전성향을 이용한 교통사고유발 및 교통법규위반 예측요인 연구]. Journal of the Korean Data Analysis Society, 14(5), 2821–2827. <Go to ISI>://KJD:ART001708268.
- Moosavi, S., Samavatian, M. H., Parthasarathy, S., & Ramnath, R. (2019). A countrywide traffic accident dataset. arXiv PreprintarXiv:1906.05409. https://doi.org/10.48550/arXiv.1906.05409
- Nakahara, S., Ichikawa, M., & Kimura, A. (2011). Population strategies and high-risk-individual strategies for road safety in Japan. Health Policy (Amsterdam, Netherlands), 100(2–3), 247–255. https://doi.org/10.1016/j.healthpol.2010.11.003
- Oguchi, T. (2016). Achieving safe road traffic—The experience in Japan. IATSS Research, 39(2), 110–116. https://doi.org/10.1016/j.iatssr.2016.01.003
- Precht, L., Keinath, A., & Krems, J. F. (2017). Effects of driving anger on driver behavior–Results from naturalistic driving data. Transportation Research Part F: Traffic Psychology and Behaviour, 45, 75–92. https://doi.org/10.1016/j.trf.2016.10.019
- Prokhorenkova, L., Gusev, G., Vorobev, A., Dorogush, A. V., & Gulin, A. (2018). CatBoost: Unbiased boosting with categorical features. Advances in Neural Information Processing Systems, 31
- Rao, C. R. (1987). A unified approach to estimation in linear models with fixed and mixed effects.
- Retallack, A. E., & Ostendorf, B. (2020). Relationship between traffic volume and accident frequency at intersections. International Journal of Environmental Research and Public Health, 17(4), 1393. https://doi.org/10.3390/ijerph17041393
- Rothengatter, T. (1997). Errors and violations as factors in accident causation. Traffic and Transport Psychology. Theory and Application.
- Rousseeuw, P. J. (1987). Silhouettes: A graphical aid to the interpretation and validation of cluster analysis. Journal of Computational and Applied Mathematics, 20, 53–65. https://doi.org/10.1016/0377-0427(87)90125-7
- Sagberg, F., & Sundfør, H. B. (2019). Self-reported deterrence effects of the Norwegian driver’s licence penalty point system. Transportation Research Part F: Traffic Psychology and Behaviour, 62, 294–304. https://doi.org/10.1016/j.trf.2019.01.012
- Shaaban, K. (2017). Assessment of drivers’ perceptions of various police enforcement strategies and associated penalties and rewards. Journal of Advanced Transportation, 2017, 1–14. https://doi.org/10.1155/2017/5169176
- Shankar, V., Mannering, F., & Barfield, W. (1995). Effect of roadway geometrics and environmental factors on rural freeway accident frequencies. Accident; Analysis and Prevention, 27(3), 371–389. https://doi.org/10.1016/0001-4575(94)00078-z
- Shawky, M., Al-Badi, Y., Sahnoon, I., & Al-Harthi, H. (2017). The relationship between traffic rule violations and accident involvement records of drivers. In Advances in human aspects of transportation (pp. 745–755) Springer.
- Shinar, D. (2017). Traffic safety and human behavior. Emerald Group Publishing.
- Smith, S. S., Horswill, M. S., Chambers, B., & Wetton, M. (2009). Hazard perception in novice and experienced drivers: The effects of sleepiness. Accident; Analysis and Prevention, 41(4), 729–733. https://doi.org/10.1016/j.aap.2009.03.016
- Summala, H., Rajalin, S., & Radun, I. (2014). Risky driving and recorded driving offences: A 24-year follow-up study. Accident; Analysis and Prevention, 73, 27–33. https://doi.org/10.1016/j.aap.2014.08.008
- Sun, Y. (2014). Research on road traffic accident analysis based on data mining. Jiaotong University %9 PhD.
- Sun, Y., Shao, C., Hao, Y., & Liang, Z. (2014). An analysis of the factors influencing the severity of urban traffic accidents based on the sensitivity of SVM. Journal of Jilin University: Engineering Edition, (5), 1315–1320.
- Walter, S. J., & Studdert, D. M. (2015). Relationship between penalties for road traffic infringements and crash risk in Queensland, Australia: a case-crossover study. International Journal of Epidemiology, 44(5), 1722–1730. https://doi.org/10.1093/ije/dyv148
- Watson, B., Watson, A., Siskind, V., Fleiter, J., & Soole, D. (2015). Profiling high-range speeding offenders: Investigating criminal history, personal characteristics, traffic offences, and crash history. Accident; Analysis and Prevention, 74, 87–96. https://doi.org/10.1016/j.aap.2014.10.013
- Wen, X., Xie, Y., Wu, L., & Jiang, L. (2021). Quantifying and comparing the effects of key risk factors on various types of roadway segment crashes with LightGBM and SHAP. Accident; Analysis and Prevention, 159, 106261. https://doi.org/10.1016/j.aap.2021.106261
- Williams, A. F. (2006). Young driver risk factors: Successful and unsuccessful approaches for dealing with them and an agenda for the future. Injury Prevention: Journal of the International Society for Child and Adolescent Injury Prevention, 12 Suppl 1(suppl 1), i4–i8. https://doi.org/10.1136/ip.2006.011783
- World Health Organization. (2022). Powered two-and three-wheeler safety: A road safety manual for decision-makers and practitioners (9240060561).
- Wu, J. (2012). Advances in K-means clustering: A data mining thinking:. Springer Science & Business Media.
- Xiao, D., Yuan, Q., Kang, S., Xu, X., & Wang, T. (2021). Insights on crash injury severity control from novice and experienced drivers: A bivariate random-effects probit analysis. Discrete Dynamics in Nature and Society, 2021, 1–13. https://doi.org/10.1155/2021/6675785
- Yang, C. Y. D., & Najm, W. G. (2007). Examining driver behavior using data gathered from red light photo enforcement cameras. Journal of Safety Research, 38(3), 311–321. https://doi.org/10.1016/j.jsr.2007.01.008
- Yao, S., Kronenburg, A., Shamooni, A., Stein, O. T., & Zhang, W. (2022). Gradient boosted decision trees for combustion chemistry integration. Applications in Energy and Combustion Science, 11, 100077. https://doi.org/10.1016/j.jaecs.2022.100077
- Zhang, G. n., Yau, K. K., & Chen, G. (2013). Risk factors associated with traffic violations and accident severity in China. Accident; Analysis and Prevention, 59, 18–25. https://doi.org/10.1016/j.aap.2013.05.004
- Zhang, J., Wang, Q., & Shen, W. (2022). Hyper-parameter optimization of multiple machine learning algorithms for molecular property prediction using hyperopt library. Chinese Journal of Chemical Engineering, 52, 115–125. https://doi.org/10.1016/j.cjche.2022.04.004
- Zhang, Z. (2017). Analysis and modelling of traffic accident risk based on drivers’ traffic violations. Southeastern University.
- Zhang, Z., He, Q., Gao, J., & Ni, M. (2018). A deep learning approach for detecting traffic accidents from social media data. Transportation Research Part C: Emerging Technologies, 86, 580–596. https://doi.org/10.1016/j.trc.2017.11.027
- Zhou, B., Wang, X., Zhang, S., Li, Z., Sun, S., Shu, K., & Sun, Q. (2020). Comparing factors affecting injury severity of passenger car and truck drivers. IEEE Access. 8, 153849–153861. https://doi.org/10.1109/ACCESS.2020.3018183
Appendix A
Table A1. Definition table of attribute variable categories.