Abstract
The mycotoxin ochratoxin A (OTA) is known to be heterogeneously distributed both intrinsically (from one individual food item to the next) as well as distributionally (throughout a sample of individual food items) in cereals and cereal-based foods. Therefore, proper sampling and sample comminution are special challenges, but are prerequisites for obtaining sound analytical data. This paper outlines the issue of the sampling process for cereals and cereal-based foods, starting with the planning phase, followed by the sampling step itself and the formation of analytical samples. The sampling of whole grain and retail-level cereal-based foods will be discussed. Furthermore, possibilities to reduce sampling variance are presented.
Introduction and relevance of ochratoxin A (OTA)
The mycotoxin ochratoxin A (OTA) is one of the most important fungal toxic secondary metabolites with regards to food safety. It has been detected in a great number of various foodstuffs including cereals and cereal-based foods, dried vine fruits and wine, as well as other dried fruits, nuts, liquorice, coffee, and cocoa (Mateo et al. Citation2007; Duarte et al. Citation2009; Fernández-Cruz et al. Citation2010; Kuiper-Goodman et al. Citation2010). In general, concentrations of OTA in foodstuffs do not exceed a few µg kg−1. Additionally, OTA is carried over into human blood and plasma and can be detected in mother's milk (Scott Citation2005; Galvano et al. Citation2008; Biasucci et al. Citation2010; Coronel et al. Citation2010).
A recently conducted survey on the dietary exposure of OTA revealed that cereals and cereal-based foods are the major contributor to OTA intake. These food items contributed more than 75% to the estimated dietary exposure to OTA for Canadian 1 year olds and 60% for Canadian 31–50-year-old males (Kuiper-Goodman et al. Citation2010). Overall, adult European and Canadian consumers are exposed to 15–60 ng OTA kg−1 bodyweight week−1. The average exposure is thus below a tolerable weekly intake (TWI) of 120 ng OTA kg−1 bodyweight (European Food Safety Authority (EFSA) Citation2006; Kuiper-Goodman et al. Citation2010).
In tropical and subtropical climates OTA is primarily produced by Aspergillus section Flavi, Circumdati and Nigri (e.g. A. ochraceus, A. carbonarius), whereas in temperate climates the major producer of OTA is Penicillium verrucosum (Frisvad et al. Citation2007). Chemically, OTA (C20H18ClNO6, MW = 403.82 g mol−1) is a chlorinated dihydroisocoumarin linked through an amidic bond to L-beta-phenylalanine. This structural similarity to the essential amino acid is the major cause for the biochemical effects of OTA and affects the enzymes involved in the metabolism of phenylalanine. OTA is a relatively stable molecule which primarily accumulates in kidney, but also in liver, muscle and body fat (Aish et al. Citation2004). As it passes through the food chain unchanged, bioaccumulation of OTA from feed to meat and meat products was observed. Although there is a large number of studies that have been completed, the genotoxicity and especially the mode of action are not yet fully characterised (EFSA Citation2006). Therefore, the International Agency for Research on Cancer (IARC) classified OTA as a metabolite belonging to group 2B (possible human carcinogens) (IARC Citation1993). Long-term exposure of OTA is primarily associated with renal tumours, but can also lead to liver cancer. Additionally, OTA has neurotoxic, teratogenic and immunosuppressive properties (Bennett and Klich Citation2003; Richard Citation2007). OTA is also thought to cause lipid peroxidation, DNA damage and disruption of calcium homeostasis which are associated with the oxidoreductive stress of OTA (Ringot et al. Citation2006). The no-observed-effect level (NOEL) of OTA following oral exposure was determined to be 21 µg kg−1 in rats (Rached et al. Citation2007). Due to the hydrolysis of the peptide bond of OTA and the conversion to ochratoxin α by protozoa in the ruminal fluid, sheep and cows are less sensitive to OTA than monogastric animals (Özpinar et al. Citation1999).
According to van Egmond et al. (Citation2007) at least 99 countries had mycotoxin regulations for food and/or feed in 2003. In European Union Commission Regulation (EC) No. 1881/2006 and its amendments, including No. 105/2010 for OTA, maximum limits were set for certain mycotoxins in different foodstuffs (European Commission Citation2006b, Citation2010). For cereal and cereal-based foods the maximum OTA levels range from 0.5 µg kg−1 for processed cereal-based foods or baby foods to 5.0 µg kg−1 for unprocessed cereals. In Citation2009, the Bureau of Chemical Safety of Health Canada proposed regulatory levels for OTA in several foods and beverages in Canada (Health Canada – Bureau of Chemical Safety Citation2009). The proposed Canadian maximum limit for baby foods is the same as in the European Union at 0.5 µg kg−1. Proposed maximum limits for other cereal-based foods range up to 7 µg kg−1 for derived cereal products (wheat bran) (Health Canada – Bureau of Chemical Safety Citation2009).
This paper focuses on the issue of sampling, including general aspects and different sampling procedures for cereals and cereal-based foods for the determination of OTA. Considering the importance of sampling as a prerequisite for the accuracy of analytical results, the literature dealing with this step of analysis is sparse.
General aspects of sampling and homogenisation
Sampling is an essential component of any monitoring activity regarding contaminants in food. But for the analysis of OTA in cereals, sampling may be the most important consideration. The proper selection of a sample from the lot under study and the subsequent steps undertaken to produce a portion for analysis is crucial for the production of sound analytical data. Much of the initial research on the importance of sampling for mycotoxin analyses has been performed for aflatoxins in various food matrices (Whitaker and Dickens Citation1974, Citation1976, Citation1979; Whitaker Citation1977).
Whitaker and Dickens (Citation1974) demonstrated that sampling is the largest source of variance in the final test result for analysis of aflatoxins in peanuts. In this work the authors examined the three basic steps of sampling, subsampling and chemical analysis that are employed to measure mycotoxins in food. These three basic steps all contribute to the total variance of test results. However for the specific case of aflatoxins in peanuts, the sampling variance was estimated to account for 88% of the total variance for the experimental conditions. The subsampling variance was the next largest, followed by the variance of the analytical test. The fact that both aflatoxins (Dickens and Whitaker Citation1986) and OTA (Vargas et al. Citation2004) appear to display similar heterogeneity in sample lots indicate sampling is also likely the largest source of variance for the measurement of OTA in food items.
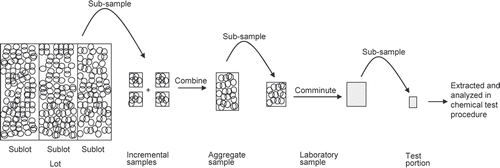
Every step of a mycotoxin test procedure from sampling to the final lab analysis contributes to the uncertainty of an analytical result. General steps of the sampling and analysis process for whole grain, as well as sampling terms (Codex Alimentarius Citation2009) are shown in . A lot (an identifiable quantity delivered at one time and assumed to have common characteristics) is subsampled to obtain incremental samples. The incremental samples are combined to produce an aggregate sample. The laboratory sample is the sample intended for the laboratory and may consist of the entire, or a portion, of the aggregate sample. The laboratory sample is comminuted, and a test portion is taken from the comminuted laboratory sample. The test portion is defined as the portion of sample taken through the chemical test procedure. Even with the best approach the OTA concentration of a sample can never be determined with absolute certainty when only a portion of the whole lot is measured. But the aim of developing and using robust sampling plans is to minimise the variances and reduce the uncertainties surrounding results.
Figure 1. Flow diagram of the various steps in the sampling and analysis process for cereal grains.
In food safety programmes a range of cereal-based food items along the continuum of the food production chain are routinely analysed for OTA. Food items surveyed often range from unprocessed whole grains to retail products that have undergone considerable processing. The difficulty of sampling for OTA is most pronounced in the analysis of whole grains. Since mixing and homogenisation occur during the production of processed foods the heterogeneous distribution of OTA is not as distinctive as in the raw ingredients. However, sampling is nevertheless crucial for any analysis of cereal-based foods.
Distributional and intrinsic heterogeneity
The complexity of the sampling issue for OTA is related to the nature of this mycotoxin and its production. The presence of OTA can vary geospatially throughout a sample of individual food items; this has been termed distributional heterogeneity (DH). The relative standard deviation (RSD) of the distributional heterogeneity is independent of the particle masses and is calculated according to Equation (Equation1):
The standard deviation (σ
DH) is divided by the average concentration of the analyte in the material (). D
S is the sampling constant caused by distributional heterogeneity and is given by Equation (Equation2) where xi
is the mass fraction and ai
is the analysis of the ith particle of the analyte. The number of particles used for calculation is represented by n. The quantity ξ is a mixing constant influenced by the degree of mixing and blending and can take a value between 0 and 1. N
I refers to the number of incremental samples used for the aggregate sample (Lyman et al. Citation2009).
A study demonstrating the distributional heterogeneity of OTA in grain was published by Biselli et al. (Citation2008) by manually sampling a 26 t lot of wheat in a truck. Following Commission Regulation (EC) No. 401/2006 (European Commission Citation2006a), 100 incremental samples (each 1.0–1.3 kg in mass) were taken from the entire truckload following a grid pattern. In addition to the analysis of an aggregate sample of 10 kg composed of 100 g of each incremental sample, a portion of every incremental sample was individually analysed for OTA. Localised areas of elevated OTA concentrations were observed and concentrations in the individual subsamples ranged from below 0.2 to 8.6 µg kg−1 in so-called ‘hot spots’. Consequently, a coefficient of variance of 200% was obtained and the OTA contamination level determined in the aggregate sample did not agree with the averaged OTA concentration in the incremental samples (Biselli et al. Citation2008).
In addition to the distributional heterogeneity, OTA concentrations amongst individual food items in a lot (for example OTA in individual kernels of grain) can also vary widely. This variation has been referred to as intrinsic heterogeneity (IH). The calculation of the RSD of the intrinsic heterogeneity is presented in Equation (Equation3):
The intrinsic standard deviation (σ
IH) is divided by the average concentration of the analyte in the material (). M
S represents the mass of the identical incremental samples and K
S is the sampling constant for the material with regard to the compound of interest and is calculated according to Equation (Equation4). The volume and density of the ith particle are vi
and ρi
, respectively (Lyman et al. Citation2009). The data presented in demonstrate the intrinsic heterogeneity in single kernels of wheat. In this investigation, concentrations of OTA measured on individual kernels varied over two orders of magnitude.
Table 1. Ochratoxin A (OTA) concentrations detected in single kernels of Canada western amber durum inoculated with Penicillium verrucosum and incubated in plastic bags.
The sampling process
The overall aim of a sampling process is to obtain a representative sample for analysis. The complexity of the sampling process – the group of activities undertaken to obtain an appropriate test portion from the lot under study for analysis – is apparent when the process is broken down into its component steps. Several publications discuss the component steps of the sampling process, and their associated considerations, for example Davis et al. (Citation1980), Coker et al. (Citation1995), Crosby and Patel (Citation1995), and Crosby (Citation1997). Many of these steps are sources of variance in the analysis of OTA in cereals and cereal-based foods. They can also be sources of bias, and will contribute to the difference between a test result and the true mean of OTA in the lot under study. The fundamental actions that are involved in the sampling process include: planning, sampling, comminution and subsampling.
Planning
Planning is common to all food surveillance and monitoring activities. The sampling scheme chosen during the planning stage ultimately depends upon the goal of the analysis, as well as resources available. For example, different sampling schemes will be required for monitoring activities that aim to analyse shipments of grain to ensure their compliance with regulatory limits and for a market basket survey that aims to provide data for exposure assessments.
The sampling schemes selected will identify the food items – be they whole grain shipments, flour or retail products – to be selected for analysis. Such schemes include random sampling, targeted sampling (focusing on food items that potentially contain violative levels of analyte), and opportunistic sampling (selecting all available food items for a specific category, geographical location, etc.), and are further described in general overviews of sampling (Crosby Citation1997). Information from marketing research firms on the market share held by retail products, import and/or export data, plus food intake data from dietary surveys can all provide guidance or direction for sampling schemes as well. During the planning stage, the number of samples, the sampling time period and other factors that define the breadth of data required will also be incorporated into the sampling scheme. Additionally, transportation and storage conditions, as well as the sample preparation and analytical method, and ultimate use of the data have to be defined beforehand. Miraglia et al. (Citation2005) present a holistic view of an ideal sampling plan for the determination of mycotoxins using a two-step approach. First, the questions ‘why, where and when’ have to be defined depending on the purpose of sampling, followed by ‘how’ to obtain representative samples.
Coker et al. (Citation1995) discussed approaches for designing and evaluating sampling plans for the analysis of aflatoxins in foods and feeds. These approaches can act as a starting point for the development of plans for OTA in which the analytical results will be compared against a specified limit, such as a maximum level. This approach uses theoretical probability models in order to simulate the performance of a proposed sampling plan. The sampling, preparation, and analytical variances are determined empirically, and the probability of an analytical result for a particular sample exceeding a specified limit is calculated. These probabilities can be graphed in an operating characteristics (OC) curve to illustrate the likelihood of encountering false positive and negative errors over a range of concentrations. The sampling plan can then be modified in order to minimise these types of errors. OC curves have been generated to illustrate probabilities of false positive and negative errors in the analysis of OTA in green coffee sampled under a specific protocol (Vargas et al. Citation2006). Further information on the generation and use of OC curves is provided in Whitaker et al. (Citation2010).
Obtaining a physical sample
After the sampling scheme is developed in the planning stage, the next step is to obtain a sample. The sample obtained could be a large mass of grain, such as from a truck, railcar or vessel hold. At the other end of the food production chain, sampling may simply be the purchase of a retail product from a market. It has been proposed that to evaluate whether or not a mycotoxin is present, the sampling procedure should be biased to include items that are more likely to contain the mycotoxin (Dickens and Whitaker Citation1986). The difference in the unbiased and biased procedures highlight the need to define the goal of the analysis prior to sampling.
Sampling of whole grain
Formal guidelines have been established by some jurisdictions that stipulate how lots of whole grain should be sampled. Sampling according to these formalised standards and guidelines would mitigate the contribution of distributional heterogeneity to the total variance of the OTA analysis. For example, the European Union provides criteria for dividing lots of grain into sub-lots, and specifies the number of incremental samples that should be taken and combined to produce an aggregate sample for analysis in Commission Regulation EC 401/2006 section B of Annex I. This regulation states that for cereal grains in a lot between 300 and 1500 t, the lot is to be divided into three sub-lots and 100 increments are to be taken from each sub-lot. The increments are then combined into an aggregate sample of 10 kg, and this aggregate sample is considered representative of the lot. The regulation also emphasises that incremental samples should be taken at various locations distributed throughout the sub-lot in an aim to obtain an unbiased sample to estimate the average OTA concentration in the lot (European Commission Citation2006a).
An International Organization for Standardization (ISO) standard for the sampling of cereals and cereal products also exists (ISO Citation2009). The standard states that it is preferable to sample bulk products when they are moving so that all constituent parts have an equal opportunity to be sampled, and proceeds to outline procedures for dynamic and static grain and milled and other cereal products. The procedure for sampling flowing grain by mechanical means specifies that a minimum of 20 incremental samples (of a mass between 300 and 1900 g) per sub-lot of 500 t be taken. A sample of 10 kg is obtained by homogenising and dividing the aggregate sample formed from the incremental samples. The standard does not address comminution of whole grain, as the definition of homogenisation is given as the ‘thorough blending by mechanical or manual means so that contaminants and physical properties are evenly distributed throughout the aggregate or laboratory sample’ (ISO Citation2009).
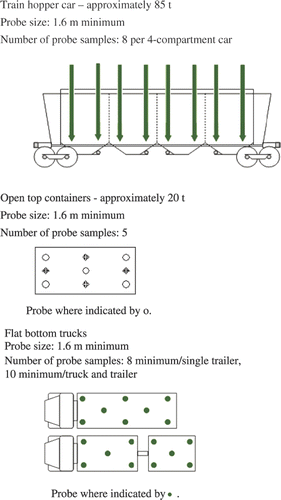
In North America, the Grain Inspection, Packers and Stockyards Administration (GIPSA) and the Canadian Grain Commission (CGC) provide handbooks for grain sampling procedures for stationary lots in order to produce a representative sample of the lot for grading purposes (GIPSA Citation1995; CGC Citation2009). The ISO standard stipulates that static bulk products that are more than 9 m deep should be sampled when they are flowing, such as during loading or unloading (ISO Citation2009). Since the goal of these procedures is to produce a representative sample of the stationary lot, the sample would also be appropriate for OTA analysis if the mean OTA concentration in the lot of stationary grain was desired. These procedures lay down a probing pattern defining the drawing of incremental samples at different locations in a bulk lot. For example, shows the probing patterns for open containers, hopper railcars, and trucks outlined by the CGC (Citation2009).
Figure 2. Canadian Grain Commission (CGC) probing patterns defining the draw of samples at different locations in various bulk static lots (CGC Citation2009).
The mechanics of sampling are discussed in a good overview by Dickens and Whitaker (Citation1986); a more mathematical treatment can be found in Gy (Citation1999). For random sampling schemes, the ultimate aim is to use a method that gives each food item the same chance of being selected as all others. The most effective method for dynamic lots is the use of commercially available automatic sampling equipment such as cross-cut samplers. A time trigger controls the movement of a diverter at predetermined and uniform intervals through the entire portion of a stream of moving grain or flour. To avoid size discrimination of larger particles, the opening of the sampling container should be two to three times larger than the biggest particle (Whitaker et al. Citation2010).
Rivas Casado et al. (Citation2009) have evaluated data describing OTA in a 26 t truck shipment of wheat (Biselli et al. Citation2008) sampled using a probe. They compared the sample standard deviation and bias of results generated in a model that employed two sampling strategies. Plots of the root mean-squared error (calculated as the square-root of the sum of bias and SD) plus the upper 95% confidence interval versus sample size constructed from random and regular sampling simulations overlapped. The authors concluded the difference in results between random and regular (samples taken according to a predefined grid on the truck bed) sampling was negligible for this particular case (Rivas Casado et al. Citation2009).
For occasions when stationary lots of grain need to be sampled, probes are used. Ideally, the stationary lot of grain to be sampled has been thoroughly blended prior to probing. It is known that settling of various sized kernels can occur that will stratify kernel sizes over the volume of the lot. However, unlike the situation with other mycotoxins, such as deoxynivalenol (Sinha and Savard Citation1997), there have been no reports of a correlation between Penicillium verrucosum infection (and OTA production) and kernel size. It is still prudent for the user to ensure that the probe used has large enough openings to avoid size discrimination of large kernels during sampling though.
Sampling of retail products
For bulk material such as whole grain, sampling plan considerations and their effects on OTA analytical data have been examined. In contrast, less effort has been invested in evaluating sampling strategies for the analysis of OTA in retail products. There appear to be no published evaluations of sampling plans for OTA in cereal based retail products. However, MacArthur et al. (Citation2006) have examined sampling plans for the measurement of OTA in dried fruit and aflatoxin B1 in pistachio nuts. They concluded that the sampling plans have to be adapted to the product under examination, and that a sampling plan which leads to results fit for purpose for one product cannot necessarily be applied to another product.
Sampling of retail samples often requires simpler logistics since food products at the retail level are generally packaged in discrete small amounts. In a similar fashion as the aggregate samples of grain, aggregate samples can be prepared from multiple packaged food products. Commission Regulation EC 401/2006 (European Commission Citation2006a), the CGC (Citation2009) and ISO (Citation2009) provide guidelines for the sampling of lots traded in individual packaging such as sacks, bags, or retail units. For official controls the sampling frequency (SF) is calculated according to Equation (Equation5) and sets down that from every nth item an incremental sample should be taken. SF depends on the weights of the lot, the incremental sample, the aggregate sample and the individual packing (European Commission Citation2006a):
Proper attention must still be paid to sampling of cereal-based foods at the retail level because OTA concentrations in retail products can differ amongst products and over time. A survey of OTA in retail food products is presented by Ng et al. (Citation2009). From 2004 to 2006, 274 dried pasta samples including regular, whole wheat, and couscous were collected at the retail level in five different areas across Canada and analysed for OTA. The incidence rates for OTA above the limit of quantification (0.5 µg kg−1) were 21%, 18% and 66% for 2004, 2005, and 2006, respectively. Mean and maximum concentrations of OTA in the pasta samples differed by up to a factor of two over the 3 years of the study as well (Ng et al. Citation2009). These results highlight the fact that there is variability in OTA concentrations observed in retail products. The range of OTA concentrations observed may be associated with a variety of factors, including the distributional and intrinsic heterogeneity of OTA in ingredient bulk lots and variation in the OTA content of ingredients from different suppliers. Nevertheless, the range of OTA concentrations observed by Ng et al. emphasise that the variability needs to be taken into account when developing good sampling plans. For example, multiyear studies should be undertaken if surveillance activities aim to characterise the occurrence of OTA in the food supply.
Retail level food products are often sampled and analysed for compliance testing and to provide data for exposure and risk assessments. For example, Total Diet Studies (TDS) use aggregate samples of various food products. This approach allows for the inclusion of more food products in a survey, but minimises the overall number of samples that need to be processed and analysed.
For instance, the Canadian TDS is a market basket survey that samples a number of individual retail food items and analyses them in the form of aggregate samples (Conacher et al. Citation1989). The data generated by the Canadian TDS is used to evaluate the total intake of a certain contaminant and provide data for risk assessment. From 1992 to 1995 the Canadian TDS were conducted biannually; from 1998 to the present they have been run annually. Each year, foods comprising more than 1% of the average Canadian's diet are purchased and prepared according to standardised protocols. Food items are purchased from up to four different markets within a selected Canadian city over a period of 5 weeks, ensuring a variety of items is obtained from various sources. Foods are prepared as for consumption, and replicate items from the various grocery stores or restaurants visited are combined and homogenised to form an aggregate sample (Conacher et al. Citation1989). Foods deemed most likely to contain OTA, based on relevant scientific data, are selected for analysis.
It has to be kept in mind that the analysis of aggregate samples will lead to the dilution of infrequent high concentrations by food products that do not contain any analyte. However, this is not necessarily a disadvantage when data are used to provide broad level assessments on the occurrence of OTA in nationally consumed food items, or population level exposure assessments.
Subsampling
Following the sampling of lots (or sub-lots), precautions should be taken in order to avoid any changes of the incremental samples that can affect preparation of aggregate or laboratory samples, test portions, or the OTA test procedure itself. Samples must be stored under conditions that will not promote the production, or degradation, of OTA. Some specific recommendations regarding the storage of grain prior to analysis are provided by Davis et al. (Citation1980). For instance, production of OTA reached a maximum approximately 100 times higher in durum at a moisture content of 19% as compared with 15% as spring temperatures rose (Abramson et al. Citation1990). Hence storage of wet grain in plastic bags at warm temperatures is not advisable. Retail food items should be stored as per label directions, as consumers would store the product.
Obtaining a portion of the aggregate or laboratory samples is a crucial step in the analysis of cereals and cereal-based foods for OTA. Modern analytical methods most often require a test portion of a small mass, thus the aggregate or laboratory samples need to be reduced in size in order to be compatible with the OTA test procedure in use. Multiple steps can be applied in order to obtain this aliquot of the aggregate or laboratory samples. Each subsampling step is a source of variance in the final OTA test result. The ultimate goal is to obtain a representative portion of the lot or sub-lot which is small enough for the OTA test procedure. Ideally, all of the items in the lot or sub-lot should have an equal chance of being selected for incremental and subsequent samples. Hence, comminution and homogenisation are very important.
For the specific example of grain, mechanical methods can be used to separate a laboratory sample from the aggregate sample. Many sample splitting devices are commercially available for this task. Cargo and Boerner dividers have stationary baffles that split the stream of grain poured into the divider and redirect the split streams into collection receptacles. Other devices used for subsampling whole grain are rotary sample dividers, which contain hoppers with feeder chutes that empty grain into rotating collection receptacles. Rotary sample dividers can also be used to separate comminuted grain.
For granular product such as whole grains, it is recommended to comminute and homogenise the entire aggregate sample before laboratory samples are drawn (Whitaker et al. Citation2010). Commercially available subsampling mills incorporate both comminution and dividing; grain is simultaneously comminuted and subsampled in these instruments. Alternatively riffle or rotary sample dividers may be used for dividing the comminuted grain.
Another method of obtaining a laboratory sample or a test portion is to comminute food items suspended in liquid to produce a slurry, and then subsample the slurry. A paper by Spanjer et al. (Citation2006) contains a summary of studies that have used slurry mixing. This technique has been applied mainly in the analysis of aflatoxins in various food matrices. Variance due to subsampling is reduced when granular food items, such as pistachios and peanuts, were slurry mixed as opposed to dry ground in the analysis of aflatoxins (Velasco and Morris Citation1976; Schatzki and Toyofuku Citation2003). The coefficient of variation for results produced by the method involving slurry mixing ranged from approximately two to four times less than those from dry grinding. For example, experimental coefficients of variation for aflatoxins in pistachios were determined to be 0.20 and 0.095 for dry grinding and slurry mixing, respectively (Schatzki and Toyofuku Citation2003). The reduction in the coefficients of variation was attributed to smaller particles and a more homogenous distribution of particle sizes obtained during the slurry mixing.
All of the existing data on the comparison of slurry mixing and dry grinding are for peanuts, pistachios, and other higher fat content seeds, therefore it is unclear if the advantageous reduction of subsampling variance observed in the analysis of aflatoxins in these items will also occur for OTA in cereals. One of the reasons for using slurry mixing is to avoid clogging of the mill with higher fat content items (Velasco and Morris Citation1976). Clogging is not an issue for cereals because they have a much lower fat content than pistachios and peanuts (Weihrauch and Matthews Citation1977; Maguire et al. Citation2004; Ryan et al. Citation2006).
Reducing sampling variance for OTA in cereals and cereal-based products
The nominal value of the sampling variance depends upon the specific experimental conditions, including analyte concentration, sample sizes, and OTA test procedure used. The rank order of sampling > subsampling > analytical variance has been observed in many situations, including aflatoxins in peanuts (Whitaker and Dickens Citation1974), cottonseed (Whitaker and Dickens Citation1976), almonds (Whitaker et al. Citation2006), and OTA in green coffee (Vargas et al. Citation2004). Therefore, improvements in analytical variance will have a small effect on the total variance of results (Vargas et al. Citation2004; Whitaker et al. Citation2006).
The total variance of OTA test results can be reduced by mitigating the effects of distributional and intrinsic heterogeneity. This aspect is of particular importance for cereal grains and less pronounced in processed cereal-based food products, although heterogeneity of OTA in retail-level cereal-based food products has been observed. For instance, OTA concentrations in cereals and pasta composites collected during two years (2008 and 2009) of the Canadian TDS varied by up to 40-fold (Tam et al. Citation2010). This emphasises that sampling is important for the analysis of retail food items, as well as cereal grains.
There are three main ways to reduce the variance of OTA test results. The effects of distributional and intrinsic heterogeneity of OTA in cereals during sampling can be mitigated by homogenisation, increasing size of samples and subsamples, and comminution.
At its most basic, mixing reduces the distributional heterogeneity of OTA. The act of mixing blends the ‘hot spots’ of mould growth and subsequent OTA formation that can occur over a larger mass of whole grain (Biselli et al. Citation2008). There is some indication that mixing also reduces the sampling variance for ground grain. The combined subsampling and analytical variance of OTA measured in ground wheat was shown to decrease in a sample that had been on a mechanical mixer for 15–30 min. Overall, the combined subsampling and analytical variance relative standard deviations decreased from 46% to approximately 15% after 30 min of mechanical mixing (Nowicki and Roscoe Citation2010).
Increasing sample size increases the ‘representativeness’ of the sample with respect to the original lot. Whitaker and Dickens (Citation1979) described the effect of sample size on variance for aflatoxins in corn mathematically. In this case, the probability that a result from a single laboratory sample is below the true lot concentration is higher than 0.5. An increase in the sample size decreases the skew of the results and produces a more symmetrical distribution because there is a greater chance that a larger sample or subsample will not exclusively be influenced by hot spots or mycotoxin-free zones (Whitaker and Dickens Citation1979). In turn, this decreases variance of the test results (Vargas et al. Citation2006). Biselli et al. (Citation2008) also noted that the total expanded uncertainty of an OTA result decreased with an increase in the number of incremental samples used to calculate the OTA result. MacArthur et al. (Citation2006) demonstrated that increasing the number of incremental samples that are used to form an aggregate sample reduced the chances of accepting lots of dried fruit containing OTA at concentrations higher than a legislative limit of 10 µg kg−1. Simulated measurements showed that increasing the number of incremental samples from 10 to 30 decreased the concentration of OTA at which the probability of a false negative was only 5% from 24 to 18 µg kg−1.
Increasing the size of test portions can also reduce subsampling variance, as can increasing the number of test portions taken for analysis. Nowicki and Roscoe (Citation2010) modelled the decrease in subsampling variance of measurements of OTA in wheat as the size of the test portion analysed increased.
The accuracy of estimating the mean OTA concentration in a lot of grain can also increase with an increase in the number of incremental samples taken for analysis. The accuracy of the estimation of the mean OTA concentration increased significantly when up to 40–60 incremental samples taken from a lot of grain (depending on the applied simulation) (Rivas Casado et al. Citation2009). As highlighted by the authors of this study, this result is consistent with the number of incremental samples stipulated to be taken from bulk lots under European Union regulations (European Commission Citation2006a). However, Rivas Casado et al. (Citation2009) caution that the outcomes of their geostatistical study are based on a model developed for lots between 10 and 100 t, and should not be extrapolated to other situations without additional data and analysis.
Comminution essentially increases the number of particles sampled by reducing the size of items sampled per unit volume or unit mass. As a result, comminution also produces a decrease in subsampling variance. Nowicki and Roscoe (Citation2010) compared the subsampling variance of measurements of OTA in wheat when two different grinders were used to prepare durum wheat. The subsampling variance was lowest in the analysis of test portions that were prepared using the grinder that produced the smallest particles. García-Fonseca et al. (Citation2010) analysed raw wheat for OTA and confirmed the results of Nowicki and Roscoe (Citation2010). A decrease in particle size resulted in a significant decrease in the relative standard deviation of OTA concentrations. The RSDs of OTA analyses in wheat ground to a particle size of less than 1 mm, between 50 and 250 µm, and less than 50 µm were 96%, 34%, and 3%, respectively (García-Fonseca et al. Citation2010). These data indicate that it is preferable to comminute and homogenise the entire aggregate sample prior to subsampling and preparation of the laboratory sample or test portion.
There is some evidence that use of a rotary sample divider during subsampling can also reduce variance of analytical results. Crosby and Patel (Citation1995) examine the use of hand scoops, riffle chutes, coning and quartering, and a rotary sample divider to prepare increments of a bulk pig feed sample to which copper sulphate had been added. The coefficient of variation from the analysis of 8 increments prepared by each technique was lowest for the rotary sample divider. The mean content of copper sulphate in the rotary sample divider produced increments was also closer to the expected value than the means from the increments formed by the other techniques. Unfortunately there are currently no data comparing the effects of various subsampling techniques on the variance of OTA analytical results.
Mixing, increasing size of samples and subsamples, and comminution are not independent means to reduce variance, and are often used in combination in a chemical test procedure. Mixing and comminution occur naturally through the food production chain as whole cereal grain is processed and incorporated into such products as bread and pasta. It can thus be expected that sampling variance will be lower for cereal-based retail items as opposed to whole grain. However, Tam et al. (Citation2010) observed a wide range of OTA concentrations in retail-level cereal-based foods. This emphasises that sampling is also a crucial step in the analysis of retail food items.
Conclusion
Sampling is a special challenge in the determination of OTA in cereals and cereal-based foods due to the heterogeneous distribution of OTA in food items. OTA is heterogeneously distributed within bulk lots of food items, as well as amongst individual items. This heterogeneity affects raw cereal grains as well as processed cereal-based foods that are available at retail level. Sampling is the main contributor to the overall variance of OTA analytical results and it contributes to measurement of uncertainty about the true value of OTA in food item lots. However, mixing, sample comminution prior to subsampling, and increased number and size of incremental samples can all substantially reduce the sampling variance and lead to OTA analytical measurements that are more precise and representative of the overall sample. Finding a balance between representativeness and practicality is the ultimate goal of sampling cereals and cereal-based foods for the analysis of OTA.
Related Research Data
References
- Abramson , D , Mills , JT and Sinha , RN . 1990 . Mycotoxin production in amber durum wheat stored at 15 and 19% moisture content . Food Addit Contam A , 7 : 617 – 627 .
- Aish , JL , Rippon , EH , Barlow , T and Hattersley , SJ . 2004 . “ Ochratoxin A ” . In Mycotoxins in food – detection and control , Edited by: Magan , N and Olsen , M . 307 – 338 . Boca Raton (FL) : CRC Press .
- Bennett , JW and Klich , M . 2003 . Mycotoxins . Clin Microbiol Rev , 16 ( 3 ) : 497 – 516 .
- Biasucci G, Calabrese G, Di Giuseppe R, Carrara G, Colombo F, Mandelli B, Maj M, Bertuzzi T, Pietri A, Rossi F. 2010. The presence of ochratoxin A in cord serum and in human milk and its correspondence with maternal dietary habits. Eur J Nutr. DOI: 10.1007/s00394-010-0130-y
- Biselli , S , Persin , C and Syben , M . 2008 . Investigation of the distribution of deoxynivalenol and ochratoxin A contamination within a 26 t truckload of wheat kernels . Mycotox Res , 24 ( 2 ) : 98 – 104 .
- Canadian Grain Commission (CGC). 2009. Sampling systems handbook and approval guide [Internet]. Winnipeg (MB): CGC; [cited 2010 Nov 7]. Available from: http://www.grainscanada.gc.ca/guides-guides/ssh-mse/sshm-mmse-eng.htm/
- Codex Alimentarius. 2009. Codex general standard for contaminants and toxins in food and feed. CODEX STAN 193-1995. Codex Alimentarius
- Coker , RD , Nagler , MJ , Blunden , G , Sharkey , AJ , Defize , PR , Derksen , GB and Whitaker , TB . 1995 . Design of sampling plans for mycotoxins in foods and feeds . Nat Toxin , 3 ( 4 ) : 257 – 262 .
- Conacher , HBS , Graham , RA , Newsome , WH , Graham , GF and Verdier , P . 1989 . The health protection branch total diet program: an overview . Can Inst Food Sci Technol J , 22 ( 4 ) : 322 – 326 .
- Coronel , MB , Sanchis , V , Ramos , AJ and Marin , S . 2010 . Review. Ochratoxin A: presence in human plasma and intake estimation . Food Sci Technol Int , 16 ( 5 ) : 5 – 18 .
- Crosby , NT . 1997 . “ Sampling and sample plans for food surveillance exercises ” . In Progress in food contaminants analysis , Edited by: Gilbert , J . 1 – 31 . London (UK) : Blackie .
- Crosby , NT and Patel , I . 1995 . “ Investigation of the reliability of sampling methods ” . In General principles of good sampling practice , 36 – 37 . Cambridge (UK) : Royal Society of Chemistry .
- Davis , ND , Dickens , JW , Freie , RL , Hamilton , PB , Shotwell , OL , Wyllie , TD and Fulkerson , JF . 1980 . Protocols for surveys, sampling, post-collection handling, and analysis of grain samples involved in mycotoxin problems . J Assoc Off Anal Chem , 63 ( 1 ) : 95 – 102 .
- Dickens , JW and Whitaker , TB . 1986 . “ Sampling and sample preparation methods for mycotoxin analysis ” . In Modern methods in the analysis and structural elucidation of mycotoxins , Edited by: Cole , RJ . 29 – 51 . Orlando (FL) : Academic Press .
- Duarte , SC , Pena , A and Lino , CM . 2009 . Ochratoxin A non-conventional exposure sources – a review . Microchem J , 93 ( 2 ) : 115 – 120 .
- European Commission . 2006a . Commission Regulation (EC) No 401/2006 of 23 February 2006 laying down the methods of sampling and analysis for the official control of the levels of mycotoxins in foodstuffs . Off J Eur Union , L70 : 12 – 34 .
- European Commission . 2006b . Commission Regulation (EC) No 1881/2006 of 16 December 2006 setting maximum levels for certain contaminants in foodstuffs . Off J Eur Union , L364 : 5 – 24 .
- European Commission . 2010 . Commission Regulation (EU) No 105/2010 of 5 February 2010 amending Regulation (EC) No 1881/2006 setting maximum levels for certain contaminants in foodstuffs as regards ochratoxin A . Off J Eur Union , L35 : 7 – 8 .
- European Food Safety Authority (EFSA) . 2006 . Opinion of the Scientific Panel on Contamination in the Food Chain on a request from the Commission related to ochratoxin A in food – Question No EFSA-Q-2005-154 . Eur Food Safety Auth J , 365 : 1 – 56 .
- Fernández-Cruz , ML , Mansilla , ML and Tadeo , JL . 2010 . Mycotoxins in fruits and their processed products: analysis, occurrence and health implications . J Adv Res , 1 ( 2 ) : 113 – 122 .
- Frisvad , JC , Thrane , U and Samson , RA . 2007 . “ Mycotoxin producers ” . In Food mycology: a multifaceted approach to fungi and food , Edited by: Dijksterhuis , J and Samson , RA . 135 – 159 . Boca Raton (FL) : CRC Press .
- Galvano , F , Pietri , A , Bertuzzi , T , Gagliardi , L , Ciotti , S , Luisi , S , Bognanno , M , La Fauci , L , Iacopino , AM Nigro , F . 2008 . Maternal dietary habits and mycotoxin occurrence in human mature milk . Mol Nutr Food Res , 52 ( 4 ) : 496 – 501 .
- García-Fonseca , S , Ballesteros-Gómez , A , Rubio , S and Pérez-Bendito , D . 2010 . Supramolecular solvent-based microextraction of ochratoxin A in raw wheat prior to liquid chromatography-fluorescence determination . J Chromatogr A , 1217 ( 16 ) : 2376 – 2382 .
- Grain Inspection, Packers and Stockyards Administration (GIPSA). 1995. Grain inspection handbook – Book I grain sampling [Internet]. Washington (DC): GIPSA; [cited 2010 Nov 7]. Available from: http://www.gipsa.usda.gov/GIPSA/webapp?area=home&subject=lr&topic=hb-hb-1/
- Gy , P . 1999 . Sampling for analytical purposes , Chichester (UK) : Wiley .
- Health Canada – Bureau of Chemical Safety. 2009. Information document on Health Canada's proposed maximum limits (standards) for the presence of the mycotoxin ochratoxin A in foods [Internet]. Ottawa (ON): Health Canada – Bureau of Chemical Safety; [cited 2010 Nov 7]. Available from: http://www.hc-sc.gc.ca/fn-an/alt_formats/hpfb-dgpsa/pdf/consultation/myco_consult_ochra-eng.pdf/
- International Agency for Research on Cancer (IARC). 1993. Some naturally occurring substances: Food items and constituents, heterocyclic aromatic amines and mycotoxins – Ochratoxin A. IARC Monographs on the Evaluation of Carcinogenic Risks to Humans 56:498–521
- International Organization for Standardization (ISO). 2009. ISO-24333: Cereal and cereal products – sampling. Geneva (Switzerland): ISO
- Kuiper-Goodman , T , Hilts , C , Billiard , SM , Kiparissis , Y , Richard , ID and Hayward , S . 2010 . Health risk assessment of ochratoxin A for all age–sex strata in a market economy . Food Addit Contam A , 27 ( 2 ) : 212 – 240 .
- Lyman , GJ , Bourgeois , FS , Gawalko , E and Roscoe , M . 2009 . “ Proceedings of the 4th World Conference on Sampling & Blending; 21–23 October 2009 ” . In Estimation of the sampling constants for grains contaminated by mycotoxins and the impact on sampling precision 19 – 24 . Cape Town, , South Africa
- MacArthur , R , MacDonald , S , Brereton , P and Murray , A . 2006 . Statistical modelling as an aid to the design of retail sampling plans for mycotoxins in food . Food Addit Contam A , 23 ( 1 ) : 84 – 92 .
- Maguire , LS , O’Sullivan , SM , Galvin , K , O’Connor , TP and O’Brien , NM . 2004 . Fatty acid profile, tocopherol, squalene and phytosterol content of walnuts, almonds, peanuts, hazelnuts and the macademia nut . Int J Food Sci Nutr , 55 ( 3 ) : 171 – 178 .
- Mateo , R , Medina , Á , Mateo , EM , Mateo , F and Jiménez , M . 2007 . An overview of ochratoxin A in beer and wine . Int J Food Microbiol , 119 ( 1–2 ) : 79 – 83 .
- Miraglia , M , De Santis , B , Minardi , V , Debegnach , F and Brera , C . 2005 . The role of sampling in mycotoxin contamination: an holistic view . Food Addit Contam A , 22 ( Suppl. 1 ) : 31 – 36 .
- Ng , W , Mankotia , M , Pantazopoulos , P , Neil , RJ , Scott , PM and Lau , BPY . 2009 . Survey of dry pasta for ochratoxin A in Canada . J Food Prot , 72 ( 4 ) : 890 – 893 .
- Nowicki , T and Roscoe , M . 2010 . An alternative to slurry mixing to minimise sample preparation variance for determination of ochratoxin A in wheat . World Mycotoxin J , 3 ( 2 ) : 147 – 156 .
- Özpinar , H , Augonyte , G and Drochner , W . 1999 . Inactivation of ochratoxin in ruminal fluid with variation of pH-value and fermentation parameters in an in vitro system . Environ Toxicol Pharmacol , 7 ( 1 ) : 1 – 9 .
- Rached , E , Hard , GC , Blumbach , K , Weber , K , Draheim , R , Lutz , WK , Özden , S , Steger , U , Dekant , W and Mally , A . 2007 . Ochratoxin A: 13-week oral toxicity and cell proliferation in male F344/N rats . Toxicol Sci , 97 ( 2 ) : 288 – 298 .
- Richard , JL . 2007 . Some major mycotoxins and their mycotoxicoses – an overview . Int J Food Microbiol , 119 ( 1–2 ) : 3 – 10 .
- Ringot , D , Chango , A and Schneider , YJ . 2006 . Toxicokinetics and toxicodynamics of ochratoxin A, an update . Chem-Biol Interact , 159 ( 1 ) : 18 – 46 .
- Rivas Casado , M , Parsons , DJ , Weightman , RM , Magan , N and Origgi , S . 2009 . Modelling a two-dimensional spatial distribution of mycotoxin concentration in bulk commodities to design effective and efficient sample selection strategies . Food Addit Contam A , 26 ( 9 ) : 1298 – 1305 .
- Ryan , E , Galvin , K , O’Connor , TP , Maguire , AR and O’Brien , NM . 2006 . Fatty acid profile, tocopherol, squalene and phytosterol content of brazil, pecan, pine, pistachio and cashew nuts . Int J Food Sci Nutr , 57 ( 3–4 ) : 219 – 228 .
- Schatzki , TF and Toyofuku , N . 2003 . Sample preparation and presampling of pistachios . J Agric Food Chem , 51 ( 20 ) : 6068 – 6072 .
- Scott , PM . 2005 . Biomarkers of human exposure to ochratoxin A . Food Addit Contam A , 22 ( Suppl. 1 ) : 99 – 107 .
- Sinha , RC and Savard , ME . 1997 . Concentration of deoxynivalenol in single kernels and various tissues of wheat heads . Can J Plant Pathol , 19 ( 1 ) : 8 – 12 .
- Spanjer , MC , Scholten , JM , Kastrup , S , Jorissen , U , Schatzki , TF and Toyofuku , N . 2006 . Sample comminution for mycotoxin analysis: dry milling or slurry mixing? . Food Addit Contam A , 23 ( 1 ) : 73 – 83 .
- Tam , J , Pantazopoulos , P , Scott , PM , Moisey , J , Dabeka , RW and Richard , IDK . 2011 . Application of isotope dilution mass spectrometry: determination of ochratoxin A in the Canadian Total Diet Study . Food Addit Contam A. , 28 : 754 – 761 .
- Van Egmond , H , Schothorst , R and Jonker , M . 2007 . Regulations relating to mycotoxins in food . Anal Bioanal Chem , 389 ( 1 ) : 147 – 157 .
- Vargas , EA , Whitaker , TB , Santos , EA , Slate , AB , Lima , FB and Franca , RC . 2004 . Testing green coffee for ochratoxin A, Part I: Estimation of variance components . J AOAC Int , 87 ( 4 ) : 884 – 891 .
- Vargas , EA , Whitaker , TB , Santos , EA , Slate , AB , Lima , FB and Franca , RC . 2006 . Testing green coffee for ochratoxin A, Part III: Performance of ochratoxin A sampling plan . J AOAC Int , 89 ( 4 ) : 1021 – 1026 .
- Velasco , J and Morris , SL . 1976 . Use of water slurries in aflatoxin analysis . J Agric Food Chem , 24 ( 1 ) : 86 – 88 .
- Weihrauch , JL and Matthews , RJ . 1977 . Lipid content of selected cereal grains and their milled and baked products . Cereal Chem , 54 ( 3 ) : 444 – 453 .
- Whitaker , TB . 1977 . Sampling granular foodstuffs for aflatoxin . Pure Appl Chem , 49 ( 11 ) : 1709 – 1717 .
- Whitaker , TB and Dickens , JW . 1974 . Variability of aflatoxin test results . J Am Oil Chem Soc , 51 ( 5 ) : 214 – 218 .
- Whitaker , TB and Dickens , JW . 1976 . Variability associated with testing cottonseed for aflatoxin . J Am Oil Chem Soc , 53 ( 7 ) : 502 – 505 .
- Whitaker , TB and Dickens , JW . 1979 . Variability associated with testing corn for aflatoxin . J Am Oil Chem Soc , 56 ( 9 ) : 789 – 794 .
- Whitaker , TB , Slate , AB , Doko , MB , Maestroni , BM and Cannavan , A . 2010 . Sampling procedures to detect mycotoxins in agricultural commodities , Dordrecht (the Netherlands) : Springer Science + Business Media .
- Whitaker , TB , Slate , AB , Jacobs , M , Hurley , JM , Adams , JG and Giesbrecht , FG . 2006 . Sampling almonds for aflatoxin, Part I: Estimation of uncertainty associated with sampling, sample preparation, and analysis . J AOAC Int , 89 ( 4 ) : 1027 – 1034 .