
Abstract
The Institute for Reference Materials and Measurements (IRMM) of the Joint Research Centre (JRC), a Directorate General of the European Commission, operates the International Measurement Evaluation Program (IMEP). IMEP organises inter-laboratory comparisons in support of European Union policies. This paper presents the results of two proficiency tests (PTs): IMEP-116 and IMEP-39, organised for the determination of total Cd, Pb, As, Hg and inorganic As (iAs) in mushrooms. Participation in IMEP-116 was restricted to National Reference Laboratories (NRLs) officially appointed by national authorities in European Union member states. IMEP-39 was open to all other laboratories wishing to participate. Thirty-seven participants from 25 countries reported results in IMEP-116, and 62 laboratories from 36 countries reported for the IMEP-39 study. Both PTs were organised in support to Regulation (EC) No. 1881/2006, which sets the maximum levels for certain contaminants in food. The test item used in both PTs was a blend of mushrooms of the variety shiitake (Lentinula edodes). Five laboratories, with demonstrated measurement capability in the field, provided results to establish the assigned values (Xref). The standard uncertainties associated to the assigned values (uref) were calculated by combining the uncertainty of the characterisation (uchar) with a contribution for homogeneity (ubb) and for stability (ust), whilst uchar was calculated following ISO 13528. Laboratory results were rated with z- and zeta (ζ)-scores in accordance with ISO 13528. The standard deviation for proficiency assessment, σp, ranged from 10% to 20% depending on the analyte. The percentage of satisfactory z-scores ranged from 81% (iAs) to 97% (total Cd) in IMEP-116 and from 64% (iAs) to 84% (total Hg) in IMEP-39.
Introduction
Asian countries have a long tradition of using mushrooms for their therapeutic properties, for instance to prevent hypertension, hypercholesterolemia and cancer (Bobek & Galbavy Citation1999; Borchers et al. Citation1999). From a nutritional point of view mushrooms are low in energy and fat but high in protein, carbohydrate and dietary fibre, vitamins and minerals (Cheung Citation2010). However, edible mushrooms, especially those wildly grown, may contain metals such as Cd, Pb and Hg at levels considerably higher than those in other food commodities (Kalač & Svoboda Citation2000). The levels of heavy metals in cultivated mushrooms are normally lower than in wild ones most likely due to the soil composition and contamination and to the age of the mycelium (part of the mushroom that grows under the ground surface) which may be several years in nature in a wild mushroom compared with a few months in the cultivated ones (Kalač & Svoboda Citation2000). The usual content, expressed as mg kg−1 in dry matter of heavy metals in mushrooms from unpolluted areas and accumulating species are: 0.5–5 mg kg−1 for As, 1–5 mg kg−1 for Cd, below 5 mg kg−1 for Pb, and below 0.5–5 mg kg−1 for Hg (Kalač Citation2010).
Not much information is available in the literature for metal speciation in mushrooms. The review published by Falandysz and Borovička (Citation2013) indicates that bioaccumulation of methylmercury by mushrooms varies between studies and that in both wild and cultivated mushrooms methylmercury is less abundant than the inorganic Hg (between 2% and 60% of total Hg), although the proportions vary depending on the concentration and the analytical method used. Regarding As, the main species found in many mushrooms are arsenobetaine, arsenate and arsenite, although the type of mushroom has a strong influence (Kalač & Svoboda Citation2000). Arsenocholine, trimethylarsonium ion and some unidentified As compounds have also been detected (Vetter Citation2004). Llorente-Mirandes et al. (Citation2014) carried out As speciation studies in shiitake mushrooms (both fresh and dehydrated) and in shiitake products (food supplements and canned shiitake), showing that inorganic As (iAs) is the predominant As species. To avoid health problems, maximum levels for heavy metals in mushrooms based on wet weight are set by the latest consolidated version of Regulation (EC) No. 1881/2006 (European Commission Citation2006). For common mushroom, oyster mushroom and shiitake mushroom the maximum levels are: 0.20 mg kg−1 Cd and 0.30 mg kg−1 for Pb. For other species the maximum level for Cd of 1 mg kg−1 applies. No maximum levels have been set yet for iAs and methylmercury, although they are the most toxic species of As and Hg, respectively. Both, European Food Safety Authority (Citation2009, Citation2014) and the Joint FAO/WHO Expert Committee on Food Additives (JECFA) (Citation2011) have recently shown their interest in the content of iAs in food.
Since mushroom consumption has increased considerably in the last years due to their nutritional properties, the Directorate for Health and Consumers (DG SANCO) of the European Commission requested that the EURL-HM test the analytical capabilities of National Reference Laboratories (NRLs) to determine heavy metals in mushrooms. Two proficiency tests (PTs) were organised by IMEP on behalf of the EURL-HM using the same test item: IMEP-116 (for NRLs) and IMEP-39 (for official control laboratories (OCLs) and other laboratories), as defined in Commission Regulation (EC) No. 882/2004 (Citation2004).
This paper discusses and compares the outcome of both PTs.
Test material
A preliminary screening of Cd, Pb, As, Hg and iAs in several fresh mushrooms was performed by the University of Barcelona (UB). For this, fresh mushrooms were hand-cleaned for soil and moss. The end of the stalk that had been in contact with the soil was cut off using a stainless steel knife. Mushrooms were cut into pieces, air dried in a batch-type drying chamber at RT for 24 h and dried in an oven at 40°C for 24–48 h. The dried mushrooms were minced using a commercial stainless steel mincer (Multiquick 5 Hand Processor, Braun), completely homogenised and analysed. From the results, shiitake mushroom was selected as the test material. Then, 5 kg of the selected fresh shiitake mushrooms were sent to IRMM under refrigerated conditions.
Upon arrival, the material was stored at –20°C until processing. At the time of processing the mushrooms were cut frozen into smaller pieces using an UMC-12 model cutter/mixer (Stephan Machinery GmbH, Hameln, Germany). The material was freeze-dried in two cycles using a freeze-dryer Epsilon 2-10D (Martin Christ GmbH, Osterode, Germany). For each cycle five trays were filled with about 500 g each of pre-cut mushrooms. In total 5.27 kg were dried, giving 570 g of dried mushroom, corresponding to a mass loss of about 89%.
Dried mushrooms were cryogenically milled using a Palla VM-KT vibrating mill (KDH, Humboldt-Wedag GmbH, Cologne, Germany). All grinding elements in this system were made of high-purity titanium to avoid contamination of the test material. After milling, this material was sieved over a 250 µm stainless steel sieve resulting in 522 g available for final mixing and homogenisation. Mixing was performed in a Dynamix CM-200 (WAB, Basel, Switzerland). Karl Fischer titration and laser diffraction analyses indicate that the material had a water content of 4% (m/m) with a top particle size below 200 µm, respectively.
Finally, portions of 2.5 g were filled using an automatic filling machine (Allfill, Sandy, UK) into acid-washed 20 ml amber glass vials. The vials were closed with acid washed inserts and aluminium caps.
Each vial was uniquely identified with a number and the name of the PT exercise.
Homogeneity and stability studies
The measurements for homogeneity and stability studies were performed by ALS Scandinavia AB (Sweden) using inductively coupled plasma sector field mass spectrometry (ICP-SFMS) after sample digestion with a mixture of HNO3/HF. Homogeneity was evaluated according to ISO 13528 (ISO Citation2005). The material proved to be adequately homogeneous for the total mass fraction of As, Cd, Pb and Hg.
The stability study was conducted following an isochronous experimental design (Lamberty et al. Citation1998; Linsinger et al. Citation2001). The material proved to be adequately stable for the 8 weeks that elapsed between the dispatch of the samples and the deadline for submission of results and for all the four investigated total mass fractions (As, Cd, Pb and Hg).
The contributions to the uncertainty of the assigned value (uref), due to homogeneity (ubb) and to stability (ust), were calculated using the statistical software SoftCRM (SoftCRM). On the basis of previous experience (IMEP-107), it was assumed that total As and iAs are similarly homogeneously distributed and stable in the test item investigated. Therefore, the same contributions were used for total As and for iAs.
Instructions to participants
Participants were asked to perform two or three independent measurements, correct their measurements for recovery and for the moisture content, and report their calculated mean (expressed as mg kg−1 in dry mass) and its associated expanded measurement uncertainty (Ulab). The experimental protocol for the moisture content determination, described in the accompanying letter, was optimised to yield the same result as the one obtained by Karl-Fisher titration which is specific for water in contrast to oven methods.
Participants received an individual code to access the online reporting interface, to report their measurement results and to complete the related questionnaire. The questionnaire was used to gather additional information related to laboratories and measurements.
Participants were informed that the procedure used for the analysis should resemble as closely as possible their respective routine procedures for these measurands (defined by specific matrix, analyte and concentration level).
Assigned values and their uncertainties
Assigned values (Xref)
Five laboratories with demonstrated measurement capabilities (later referred as expert laboratories) analysed the test item in order to determine the assigned values (): Federal Institute for Materials Research and Testing, BAM, Germany; Laboratory of Public Health of Alicante, LSPA, Spain; Karl-Franzens-Universität Graz, KFUG, Austria; University of Barcelona, UB, Spain; and Instituto de Agroquímica y Tecnología de los Alimentos, Consejo Superior de Investigaciones Científicas, CSIC, Spain. Not every laboratory analysed all measurands.
Table 1. Analytical methods used by the expert laboratories.
Experts were asked to use the method of their choice; no further requirements were imposed regarding methodology. Experts were also asked to report their measurement uncertainty with a clear and detailed description on how the measurement uncertainty was estimated. A detailed description of the methods reported by the expert laboratories is presented in .
The mean of the means provided by the expert laboratories was used to derive the assigned values (Xref) for these PTs according to ISO Guide 35 (ISO Citation2006).
Associated standard uncertainties (uref)
The standard uncertainties associated to the assigned values (uref) were calculated according to ISO/IEC Guide 98:2008 (GUM) (ISO Citation2008) by combining the uncertainty of the characterisation (uchar) with a contribution for homogeneity (ubb) and for stability (ust) as follows:
presents the average measurements reported by the expert laboratories (Xn), their expanded measurement uncertainties (Un), assigned values, standard uncertainty contributions (from characterisation, homogeneity and stability) and combined uncertainties (uref) and the standard deviation for the PTs assessment.
Table 2. Average measurements reported by the expert laboratories (Xn), their expanded measurement uncertainties (Un), assigned values, standard uncertainty contributions (from characterisation, homogeneity and stability) and combined uncertainties (uref) and the standard deviation for the PTs assessment (mg kg−1).
Standard deviation for proficiency assessment (σp)
The standard deviations for the proficiency assessment (σp) for total Pb and iAs were calculated to be 20% and 19%, respectively, using the Horwitz equation modified by Thompson (Citation2000). For the rest of the measurands, σp was set by the advisory board of this PT to 15% for total As and Hg and to 10% for total Cd, on the basis of previous performance on similar measurands (EURL-HM).
Evaluation of the results reported by laboratories taking part in IMEP-116 and IMEP-39
In IMEP-116, 37 out of the 38 NRLs (from 25 countries) having registered reported results. In IMEP-39 results were received from 62 (from 36 countries) of the 71 registered laboratories. Laboratories reporting ‘less than X’ were not scored. However, reported ‘less than X’ values were compared with the corresponding ‘Xref – Uref’. If the reported limit value X is lower than the corresponding Xref – Uref, this statement is considered incorrect, since the laboratory should have been able to detect the respective element.
Scoring and evaluation criteria
Individual laboratory performance is expressed in terms of z- and ζ-scores in accordance with ISO 13528 (ISO Citation2005):
The interpretation of the z- and ζ-score is done as follows (according to ISO/IEC 17043 (ISO Citation2010):
Satisfactory performance = |score| ≤ 2
Questionable performance = 2 < |score| < 3
Unsatisfactory performance = |score| ≥ 3
The z-score compares the participant’s deviation from the reference value with the standard deviation for proficiency assessment (σp) used as a common quality criterion, defined in the previous section.
The ζ-score states if the laboratory result agrees with the assigned value within the respective uncertainty. The denominator is the combined uncertainty of the assigned value (uref) and the measurement uncertainty as stated by the laboratory (ulab). The ζ-score includes all parts of a measurement result, namely the expected value (assigned value), its uncertainty and the unit of the result as well as the uncertainty of the reported values. An unsatisfactory ζ-score can be caused either by an incorrect measurement result or by an inappropriate estimation of its uncertainty, or both.
The standard measurement uncertainty of the laboratory was obtained by dividing the reported expanded uncertainty by the reported coverage factor, k. When no uncertainty was reported, it was set to zero (ulab = 0). When k was not specified, the reported expanded uncertainty was considered as the half-width of a rectangular distribution; ulab was then calculated by dividing this half-width by √3, as recommended by Eurachem and CITAC (Eurachem/CITAC Citation2012).
Uncertainty estimation is not trivial; therefore an additional assessment was provided to each laboratory reporting uncertainty, indicating how reasonable is their uncertainty estimate. The standard uncertainty from the laboratory (ulab) is most likely to fall in a range between a minimum uncertainty (umin) and a maximum allowed (umax, case a). umin is set to the standard uncertainty of the reference value (uref). It is unlikely that a laboratory carrying out the analysis on a routine basis would measure the measurand with a smaller uncertainty than the expert laboratories chosen to establish the assigned value. umax is set to the standard deviation (σp) accepted for the PT assessment.
If ulab is smaller than umin (case b) the laboratory may have underestimated its uncertainty. However, such a statement has to be taken with care as each laboratory reported only measurement uncertainty, whereas the uncertainty of the reference value also includes contributions of homogeneity and stability. If those are large, measurement uncertainties smaller than umin (uref) are possible and plausible.
If ulab is larger than umax (case c) the laboratory may have overestimated the uncertainty. An evaluation of this statement can be made by looking at the difference of the reported value and the assigned value: if the difference is smaller than Uref, then overestimation is likely. If the difference is larger but xlab agrees with Xref within their respective expanded measurement uncertainties, then the measurement uncertainty is properly assessed resulting in a satisfactory z-score, though the corresponding z-score may be questionable or unsatisfactory. It should be pointed out that umax is a normative criterion when set by legislation.
Laboratory results and scorings
Results as reported by the participants for total Cd, Pb, As, Hg and iAs mass fractions are summarised in –. They include the individual mean values and reported associated expanded uncertainties.
Figure 1. (colour online) Xlab and Ulab as reported by the participants in IMEP-39 and IMEP-116 for the total mass fraction of Cd.
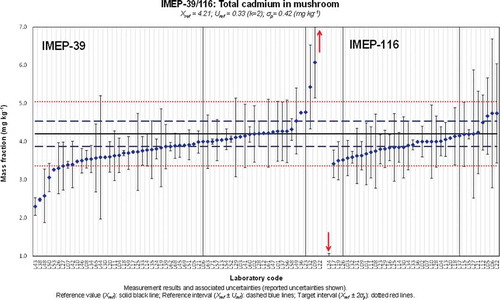
Figure 2. (colour online) Xlab and Ulab as reported by the participants in IMEP-39 and IMEP-116 for the total mass fraction of Pb.
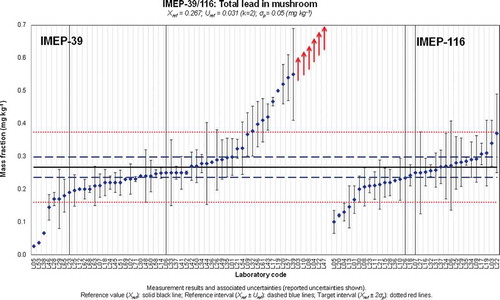
Figure 3. (colour online) Xlab and Ulab as reported by the participants in IMEP-39 and IMEP-116 for the total mass fraction of As.
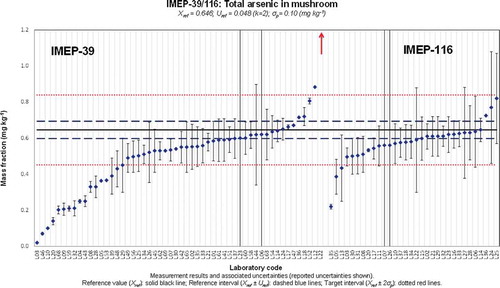
Figure 4. (colour online) Xlab and Ulab as reported by the participants in IMEP-39 and IMEP-116 for the total mass fraction of Hg.
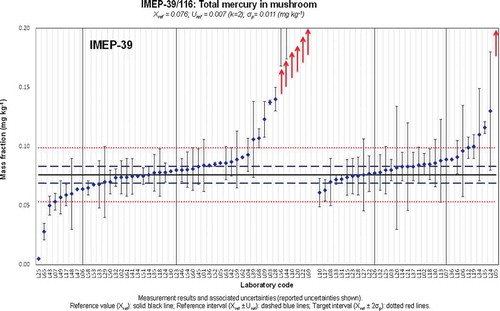
Figure 5. (colour online) Xlab and Ulab as reported by the participants in IMEP-39 and IMEP-116 for the total mass fraction of iAs.
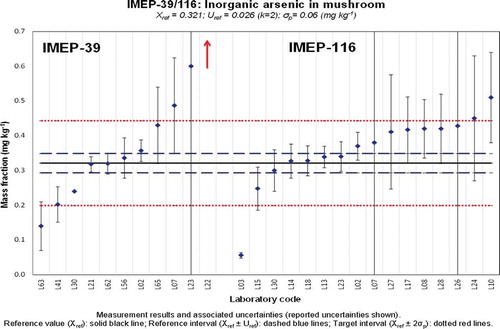
presents a general overview of z- and ζ-scores. In IMEP-116, 81% (iAs) to 97% (total Cd) of the NRLs performed satisfactorily (z ≤ 2). The PT seems to have been more challenging for the laboratories taking part in IMEP-39 where 64% (iAs) to 72% (total Hg) of the reported results were satisfactory. As shown, the percentage of laboratories obtaining satisfactory z-scores is higher for all measurands in IMEP-116 than in IMEP-39, the largest differences between the two populations occurring for total Pb, total As and iAs.
Figure 6. (colour online) Distribution of satisfactory, questionable and unsatisfactory (a) z- and (b) ζ-scores for IMEP-39 and IMEP-116.
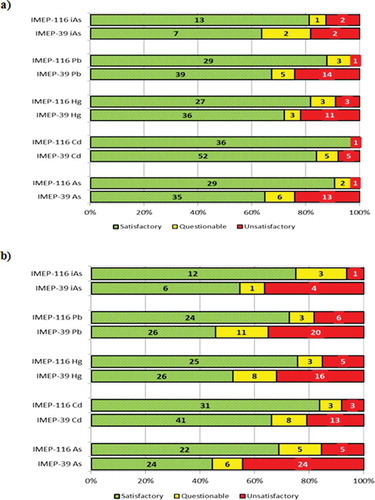
Regarding ζ-scores, in IMEP-116 69% (total As) to 84% (Total Cd) performed satisfactorily. In IMEP-39, a lower percentage of the population performed satisfactorily (ranging from 44% to 66%, for total As and Cd mass fractions, respectively) with percentages of 46%, 52% and 55% for total Pb, Hg and iAs respectively. Thus laboratories should enhance their effort in the estimation of their measurement uncertainty.
As indicated in Scorings and evaluation criteria ‘a’, ‘b’ and ‘c’ scorings are just orientative assessments meant to help laboratories to evaluate the plausibility of their standard measurements.
The assessment of reported uncertainties presented in is based on the three uncertainty categories defined in the chapter on Scorings and evaluation criteria: ‘a’ (realistic), ‘b’ (underestimated) and ‘c’ (overestimated/large). The first observation is that the percentage of laboratories reporting realistic uncertainties for all measurands is higher in IMEP-116 than in IMEP-39. The second observation is that while in IMEP-116 there is a clear tendency to overestimate the uncertainty, the opposite tendency took place in IMEP-39 where laboratories tended to underestimate the uncertainties associated with the reported results. Frequently underestimation of uncertainty occurs when repeatability is used as uncertainty. It also needs to be kept in mind that some laboratories did not report any uncertainties; in those cases IMEP considers the reported uncertainty to be zero and they are then counted as ‘b’. This is done because Regulation (EC) No. 333/2007 (European Commission Citation2007) indicates that in official control analysis results are to be reported as X ± U, where U is the expanded associated uncertainty. A proper estimation of the standard uncertainties is of paramount importance, for instance in cases of litigation. Along the years the EURL-HM organised several lectures providing NRLs with information about the different approaches that allow a sound estimation of the measurement uncertainties. Additionally, every PT organised by the EURL-HM for the network of NRLs was an opportunity to review the quality of their uncertainty estimation.
Table 3. Uncertainty assessment. Proportion of participants in each study who received the ‘a’, ‘b’ or ‘c’ ratings (%).
It is clear that the values used for σp have an impact on the percentage of uncertainties being assessed as overestimated for a given PT. The lower the σp the higher the chance that a laboratory would report an uncertainty assessed as overestimated. This could explain why most of the overestimated uncertainties were reported by the NRLs for total Cd and Hg.
In IMEP-116 the proportion of overestimated uncertainties for iAs (31%) could be explained by the fact that some NRLs have used an analytical method recently implemented, for which the laboratory is not fully confident, thus resulting in larger standard uncertainties. Such a tendency was not observed in IMEP-39 because, as discussed above, the majority of that population reported standard measurement uncertainties derived only from precision data.
Hg and As speciation
In the preparatory phase of the PTs, it was decided to perform some preliminary studies to evaluate the content of the most toxic species of Hg and As (methylmercury and iAs, respectively) in the test item.
The screening for methylmercury was performed by the Laboratory of Public Health of Alicante, using the analytical method validated by the EURL-HM in a collaborative trial (IMEP-115). The report of the collaborative trial (Cordeiro et al. Citation2013) and the standard operational procedure (SOP) (Calderón et al. Citation2013) can be downloaded from the EURL-HM webpage (EURL-HM).
For methylmercury, an approximate concentration of 0.0042 mg kg−1 was found, which corresponds to about 5% of the total content of Hg in the test item. This value can only be considered as approximate because the LOQ of the method used for the screening is 0.010 mg kg−1. The concentration found is in agreement with the information published in the literature (Kalač & Svoboda Citation2000), mentioning that methylmercury is normally present at a low percentage, rarely more than 16%, of the total Hg mass fraction.
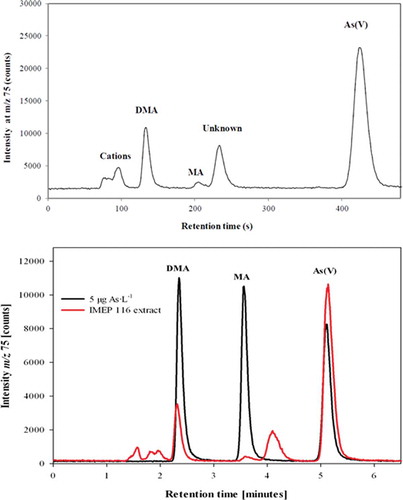
The screening of iAs performed by the UB indicates that around 50% of the total As mass fraction is present in the form of iAs. This was confirmed during the analysis conducted to establish the assigned value for that measurand (). Two of the expert laboratories having determined iAs using HPLC-ICP-MS submitted chromatograms showing the distribution of As species in the test item (). Both chromatograms show the same profile; iAs was identified by the two expert laboratories as the main As species in the mushroom (Lentinula edodes) analysed. Dimethylarsinic acid (DMA) was also clearly detected. Traces of monomethylarsonic acid were also present. The literature indicates that the main arsenocompound detected in some mushroom species was arsenobetaine (Kalač & Svoboda Citation2000), although it depends on the type of mushroom, for instance DMA is the main As species in Laccaria laccata and Volvariealla volvacea (Šlejkovc et al. Citation1997). In the test item used in the discussed PTs, arsenobetaine was not reported by any of the expert laboratories, although it has to be kept in mind that the chromatographic conditions used by the expert laboratories are those that best fit the determination of iAs (based on the use of an anion-exchange column), since that was the measurand in the discussed PTs. One expert laboratory also analysed the test item using a cation-exchange column (results not shown) and traces of arsenobetaine and some other cationic As species were detected.
Figure 7. (colour online) Chromatograms showing the distribution of As species in the test item, as obtained by two expert laboratories using anion exchange-ICP-MS.
Analysis of the information reported by the laboratories in the questionnaire
When reporting their results participants were asked to answer a number of questions related to the analytical method used and to the quality assurance of their results. In order to allow the identification of all major potential sources of variability among the reported results, we investigated (for each measurand) the relation between each reported value and the set of responses provided in the questionnaire. The statistical data treatment was performed using The Unscrambler X 10.1 (CAMO Software AS, Oslo, Norway). Answers were first transformed into numerical variables, before applying partial least square regression modelling (PLS-R). Multivariate models succeed to ‘explain’ a reasonable percentage of the total covariance relating the reported results and the set of answers. Furthermore, the model errors were generally lower than the observed variability for each corresponding set of reported values (expressed as the respective standard deviation). Therefore, the multivariate models allowed reliable interpretations. Although no significant differences were observed among the participants, in general the better performing laboratories were characterised by: having used microwave digestion with nitric acid and hydrogen peroxide for sample digestion; some quality assurance issues (e.g. having a quality system in place, being accredited, use of certified reference materials for validation and/or calibration purposes and taking part regularly in PTs); and having experience with this type of analysis/matrices.
Two clear tendencies were observed in IMEP-39 (not present in IMEP-116), as follows.
Tendency to underestimate the total As mass fraction
At first glance this underestimation was directly related to the technique used, as illustrated in . In general, participants using atomic absorption spectrometry (AAS)-based techniques reported lower values than the participants who used ICP-based techniques (ICP-MS and ICP-AES). The lower values reported by participants using AAS-based techniques resulted in a significantly lower percentage of satisfactory z-scores (35%) when compared with those obtained by laboratories using ICP-based techniques (87%). However, this clustering of results on the basis of the technique used could be due to a non-quantitative digestion of the matrix without being related to the technique used. Some organic species of As are difficult to digest and require digestion temperatures of around 280°C when microwave digestion is used (most of the participants in IMEP-39 used microwave digestion). Most of the laboratories that clearly failed to quantify the total As mass fraction used temperatures in the range 190–200°C with further hydride generation-AAS (HG-AAS).
Figure 8. (colour online) Distribution of results reported for the total mass fraction of As on the basis of the technique used.
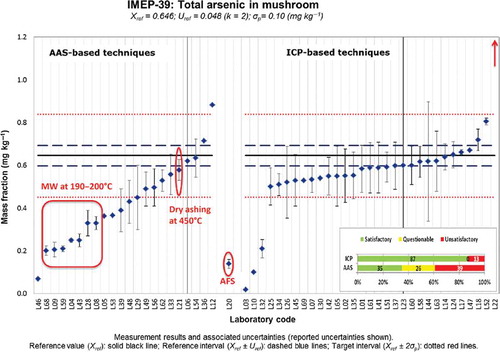
The high temperatures reached in the plasma would eliminate that problem when ICP-based techniques are used. The same would apply to methods that involve a final determination of total As using electrothermal atomic absorption spectrometry (ET-AAS), since atomisation temperatures in the graphite furnace are also very high. The problem of non-quantitative digestion would mostly affect the results obtained with hydride generation because only iAs species and, to a lesser extent, methylated As species can generate the hydride. This would also explain the underestimation of the total As mass fraction in the result reported by L20, which used atomic fluorescence spectrometry (AFS); the technique also requires generation of the As hydride before the final determination by AFS.
The observed underestimations are then not due to any effect directly related to AAS but to the use of low digestion temperatures. AAS-based techniques can be used if high temperatures are used for sample digestion (for instance dry ashing at 450°C), as shown by L21.
Laboratories using HG-AAS must also keep in mind that after digestion of the matrix with a mixture HNO3 and H2O2 (mixture used by most of the participants in IMEP-39), if the digestion is quantitative, most As will be present in the form of As(V) and needs to be reduced to As(III) which is the As species generating the hydride with a higher yield. This means that a reduction step must be included and optimised prior to hydride generation to ensure quantitative reduction of As (V) to As(III).
For iAs determination, five out of the seven laboratories that obtained satisfactory z-scores in IMEP-39, used AAS-based techniques. If proper method validation is carried out AAS-based methods can be used and they are cheap and easy-to-use methods which can provide correct results. Regarding the selective determination of iAs using HPLC-ICP-MS, it has been reported in the literature that a significant decrease in the relative sensitivity of arsenite as opposed to arsenate has been observed at the low flow rates used for that type of hyphenation (Grotti et al. Citation2013). Hence a significant bias can be introduced if the oxidation state of iAs in the analysed sample is different from that in the standard solution used for calibration purposes. Laboratories using HPLC-ICP-MS should keep this information in mind when validating their methods for determination of iAs.
The influence of the technique used was not so significant for the total Cd, Pb and Hg mass fractions. However, it should be noted that the four lowest values reported for total Cd (L38, L43, L48 and L50) used AAS or ET-AAS. A similar observation was made for the total Pb mass fraction for which the three laboratories obtaining an unsatisfactory z-score due to a serious underestimation of this measurand (L05, L38 and L53) used AAS and ET-AAS. The majority of these participants used microwave assisted digestion with a mixture HNO3 and H2O2 with temperatures between 190 and 200°C.
Tendency to overestimate the total Pb and Hg mass fractions
A relatively high number of laboratories reported unsatisfactory results in terms of z-scores for total Pb and Hg due to overestimation regardless the technique used. Four of the laboratories which obtained an unsatisfactory z-score for total Pb due to overestimation also did for total Hg (L10, L20, L22 and L56). Overestimation of the total Pb mass fraction could be due to contamination problems. Laboratories must pay attention to the purity of the reagents used via blank control, must use clean laboratory material and must carry out analyses in clean environments. It was not possible to find a suitable explanation for the overestimation of total Hg. Contamination in this case is not as likely to occur as in total Pb analysis. Nevertheless, regular blank controls must be regularly included in the analytical sequence.
Conclusions
The performance of the network of NRLs for all the investigated measurands can be considered satisfactory. The overall rates of satisfactory performance obtained by the NRLs (expressed as z-scores) ranged from 10% to 25% higher than the same rates in IMEP-39. When taking into consideration ζ-scores, the percentages of satisfactory performances are slightly lower than those for z-scores. This is particularly visible for the population of non NRLs. Only about half of the participants in IMEP-39 obtained satisfactory ζ-scores for total As, Pb and Hg and for iAs. This is closely related to the fact that a relatively high percentage of laboratories reported measurement uncertainties which were likely underestimated (case b).
Underestimation of the total As mass fraction can occur if not high enough temperatures (higher than 280°C) are used during the digestion of the sample. Laboratories using HG-AAS-based techniques for the final determination of As should be particularly careful. The high temperatures reached in the plasma when using ICP-based techniques would eliminate this bias.
Particularly interesting is the case of iAs. Sixteen NRLs reported values for this measurand (81% of which obtained a satisfactory z-score) which is a considerably higher number than in IMEP-107, the first PT organised by the EURL-HM in which iAs was covered. In IMEP-39, five out of the seven laboratories which obtained a satisfactory z-score for iAs, have used AAS-based techniques, showing that sound determinations of iAs can be made without the use of expensive sophisticated instrumentation.
Acknowledgements
The authors wish to thank ALS Scandinavia for carrying out the measurements for homogeneity and stability studies and to all the laboratories which took part in IMEP-116 and IMEP-39.
References
- Bobek P, Galbavý Š. 1999. Hypocholesterolemic and antiatherogenic effect of oyster mushroom (Pleurotus ostreatus) in rabbits. Nahrung/Food. 43:339–342.
- Borchers AT, Stern JS, Hackman RM, Keen CL, Gershwin ME. 1999. Mushrooms, tumors, immunity. Exp Biol Med. 221:281–293.
- Calderón J, Gonçalves S, Cordeiro F, de la Calle B. 2013. Determination of methylmercury in seafood by direct mercury analysis: standard operating procedure. JRC. 80259. Geel: Institute for Reference Materials and Measurements (IRMM).
- Cheung PCK. 2010. The nutritional and health benefits of mushrooms. Nutr Bull. 35:292–299.
- Commission Regulation (EC) 1881/2006. Setting maximum levels for certain contaminants in foodstuffs.
- Commission Regulation (EC) No. 333/2007. laying down the sampling methods and the methods of analysis for the official control of the levels of lead, cadmium, mercury, inorganic tin, 3-MCPD and benzo(a)pyrene in foodstuffs.
- Commission Regulation (EC) No. 882/2004. official controls performed to ensure the verification of compliance with feed and food law, animal health and animal welfare rules.
- Cordeiro F, Gonçalves S, Calderón J, Robouch P, Emteborg H, Connely P, Tumba-Tshilumba M-F, Kortsen B, de la Calle B. 2013. IMEP-115: Determination of methylmercury in seafood. A collaborative trial report, EUR 25830 EN.
- Eurachem/CITAC. 2012. Quantifying uncertainty in analytical measurement [Internet]. 3rd ed. [cited 2014 Nov 14]. Available from: http://www.eurachem.org
- EURL-HM [Internet]. [cited 2014 Nov 14]. Available from: https://ec.europa.eu/jrc/en/eurl/heavy-metals/interlaborator-comparisons
- [EFSA] European Food Safety Authority. 2009. Scientific Opinion on arsenic in food. EFSA Panel on Contaminants in the Food Chain (CONTAM). 7:1351, 199 p.
- [EFSA] European Food Safety Authority. 2014. Dietary exposure to inorganic arsenic in the European population. EFSA J. 12:3597, 68 p.
- Falandysz J, Borovička J. 2013. Macro and trace mineral constituents and radionuclides in mushrooms: health and benefits and risks. Appl Microbiol Biotechnol. 97:477–501.
- Grotti M, Ardini F, Terol A, Magi E, Todolí JL. 2013. Influence of chemical species on the determination of arsenic using inductively coupled plasma mass spectrometry at a low liquid flow rate. J Anal At Spectrom. 28:1718–1724.
- ISO: 2006. Guide 35 Reference Materials – General and statistical principles for certification, issued by ISO-Geneva (CH).
- ISO 13528: 2005. Statistical methods for use in proficiency testing for interlaboratory comparisons, issued by the International Organisation for Standardisation, Geneva.
- ISO/IEC 17043: 2010. Conformity assessment – General requirements for proficiency testing, issued by International Organisation for Standardisation, Geneva.
- ISO/IEC Guide 98: 2008. Uncertainty of measurement – Part 3: Guide to the expression of uncertainty in measurement (GUM 1995), issued by International Organisation for Standardisation, Geneva.
- [JECFA] Joint FAO/WHO Expert Committee on Food Additives. 2011. Evaluation of certain contaminants in food: Seventy-second meeting of the Joint FAO/WHO Expert Committee on Food Additives. WHO Technical Report series 959.
- Kalač P. 2010. Trace element contents in European species of wild growing edible mushrooms: a review for the period 2000–2009. Food Chem. 122:2–5.
- Kalač P, Svoboda L. 2000. A review of trace element concentrations in edible mushrooms. Food Chem. 69:273–281.
- Lamberty A, Schimmel HG, Pauwels J. 1998. The study of the stability of reference materials by isochronous measurements. Fresenius’ J Anal Chem. 360:359–361.
- Linsinger TPJ, Pauwels J, Lamberty A, Schimmel HG, Van Der Veen AMH, Siekmann L. 2001. Estimating the uncertainty of stability for matrix CRMs. Anal Bioanal Chem. 370:183–188.
- Llorente-Mirandes T, Barbero M, Rubio R, López-Sánchez JF. 2014. Occurrence of inorganic arsenic in edible Shiitake (Lentinula edodes) products. Food Chem. 158:207–215.
- Šlejkovc Z, Byrne AR, Stijve T, Goessler W, Irgolic KJ. 1997. Arsenic compounds in higher fungi. Appl Organomet Chem. 11:673–682.
- SoftCRM [Internet]. [cited 2014 Nov 14]. Available from: http://www.eie.gr/iopc/softcrm/index.html
- Thompson M. 2000. Recent trends in inter-laboratory precision at ppb and sub-ppb concentrations in relation to fitness for purpose criteria in proficiency testing. Analyst. 125:385–386.
- Vetter J. 2004. Arsenic content of some edible mushroom species. Eur Food Res Technol. 219:71–74.