
Abstract
Coccidiostats belong to the group of feed additives authorised within the European Union exclusively for specific preparations. These preparations not only contain one or more coccidiostats as active substance(s) but also various ingredients such as the carrier, which are included in the European legislation authorising the product. In order to allow the full traceability of the use of feed additives and to check for compliance with legal provisions, there is a strong need for analytical methods that enable the rapid characterisation of these products. This paper describes the applicability of non-destructive techniques such as mid infrared (MIR) and near infrared (NIR) microscopy supported by multivariate analysis for the characterisation of coccidiostats-containing feed additives. The application of these methods demonstrated that different feed additives could be distinguished from each other even when containing the same active substance. The use of chemometrics turned out to be crucial especially in cases where the differentiation of spectra by visual inspection was very difficult.
Introduction
Feed additives play an important role in animal nutrition and are authorised within the European Union according to Regulation (EC) No. Citation1831/2003. Authorisation is based on the principle that an applicant prepares a dossier with relevant information related to the feed additive and submits an application to the European Commission. The authorisation procedure involves various steps, namely (1) the assessment of its safety and efficacy carried out by the EFSA (EFSA, Feed Additive Applications); (2) the evaluation of the method of analysis of the feed additive performed by the European Union Reference Laboratory for Feed Additives (EURL-FA), which also keeps a repository of authorised feed additive samples (EURL Feed Additives); and (3) the final decision on the authorisation that is granted or denied by the European Commission. The conditions of use are specified individually for each feed additive by Commission Implementation Regulations. Furthermore, an overview of all feed additives currently authorised within the European Union is given by the feed additive register (European Union (Citation2015), Register of Feed Additives) regularly updated by the European Commission. In the authorisation procedure the EURL-FA looks typically at the analytical methods for the determination of the active substance in feed, but also the identification of the feed additive may be a topic. For instance, in the case of probiotics only specific strains of the microorganism are authorised. This criterion requires the applicant submit an analytical method that allows the identification of this specific strain. While there are products such as trace elements, vitamins or organic acids that are authorised as chemicals along with specific purity criteria, quite specific authorisation conditions are foreseen for zootechnical additives and coccidiostats (Regulation (EC) No. Citation1831/2003). In particular, only the holder of the authorisation indicated in the corresponding Commission Implementation Regulation can place zootechnical additives and coccidiostats on the market. In addition, coccidiostats are exclusively authorised as specific formulations. These formulations contain not only the coccidiostat as active substance but also other ingredients, such as the carrier. As a consequence, different formulations from different applicants require separate authorisation, even when containing the same active substance. In order to allow for full traceability of the use of feed additives and to check for compliance with legal provisions, there is a strong need for analytical methods that enable the rapid characterisation of these products. This aspect especially applies to cases where different feed additives containing the same active substance are marketed. The EURL-FA also maintains a repository of all feed additives currently authorised within the European Union or under evaluation, since the applicants are obliged to provide the EURL-FA with samples of the product linked to the submitted request for authorisation.
In this study we focused on the application of spectroscopic techniques to the analysis of feed additives containing coccidiostats as an active substance. Coccidiostats are antiparasitics used worldwide for the treatment of coccidiosis and are, in addition to histomonostats, the only group of antibiotics still authorised as feed additives within the European Union, after the deletion of all other antibiotics from the feed register by 2006 (Regulation (EC) No. Citation1831/2003, art. 11). Coccidiosis affects the intestinal tract of young animals, mainly farm species such as pigs, poultry, cattle, sheep and rabbits. It causes intestinal damage, leading to illness and sometimes death of the animals, and is easily contagious. Over 20 coccidiostat compounds are known; however, only 11 compounds have been authorised by the European Union (Regulation (EC) No. Citation1831/2003) as feed additives to prevent the above-mentioned diseases in farmed animals (Clarke et al. Citation2014).
The authorised coccidiostats can be classified into (1) naturally occurring polyether ionophores such as monensin, narasin, lasalocid, salinomycin, semduramicin and maduramicin produced by 53 different bacteria; and (2) synthetic compounds such as halofuginone, robenidine, diclazuril, decoquinate and nicarbazin. Nicarbazin was found to be the first coccidiostat with a broad spectrum activity and has been used since the 1950s (Moloney et al. Citation2012; Dorne et al. Citation2013; Clarke et al. Citation2014).
Vibrational spectroscopy technologies have been introduced as fingerprinting techniques within agriculture and food (Casale et al. Citation2010; Zhang et al. Citation2011; Esslinger et al. Citation2014), and in recent years have been rediscovered by several research groups in broad applications (Roggo et al. Citation2007; Xu et al. Citation2013; Anzanello et al. Citation2014). The main advantages of this technique over the traditional chemical and chromatographic methods are the rapidity and the ease of use in routine operations. Vibrational spectroscopy is a non-destructive technique that requires minimal or zero sample preparation (Cozzolino Citation2014). The purpose of this study was to establish whether feed additives containing specific coccidiostats as active substances could be characterised by rapid and non-destructive methodology, namely mid infrared (MIR) and near infrared (NIR) microscopy. Moreover, to the authors’ knowledge, this is the first time MIR spectroscopy has been applied to feed additives. In particular, it was important to establish whether different feed additives could be distinguished by IR spectroscopy, even when containing the same active substance. Therefore, the following coccidiostats and corresponding feed additives were selected in this study. For the coccidiostats: narasin, monensin and nicarbazin; and for the feed additives: Maxiban®, Monteban®, Elancoban®, Monimax® and Coxidin®. The latter feed additive is placed on the market in two different formulations and, therefore, both products were included in this study (European Union, Register of Feed Additives). The evaluation of the spectra measured from the active substances and the feed additives was supported by the use of multivariate statistics, which is a very useful tool when differentiating compounds considering all the information contained in the entire spectrum at the same time (Li et al. Citation2011; Ordoudi et al. Citation2014; Cozzolino Citation2014). This aspect applies especially in cases where these spectra cannot be easily separated by visual inspection.
Materials and methods
Sample preparation
In this study different coccidiostats and feed additives were included, namely three pure active substances (coccidiostats): monensin (Fluka, 86.3% purity; Steinheim, Germany), narasin (Sigma, 98% purity; St. Louis, MO, USA) and nicarbazin (Fluka, 99.4% purity), five commercially available feed additives (Maxiban®, two different formulations of Coxidin®, Monteban®, Elancoban®) and the feed additive Monimax®, for which the EURL-FA has recently published the evaluation of methods of analysis (EURL Feed Additives Citation2014). All these feed additives contain one or two of the above coccidiostats as active substance. Based on the information available at the European Union Register of Feed Additives pursuant to Regulation (EC) No. Citation1831/2003, the composition of these feed additives is summarised in . For Coxidin two different preparations with the same active substance (monensin) exist, which are distinguished in this paper as Coxidin (wheat) and Coxidin (CaCO3), respectively. This overview shows that the concentration of the active substances as well as the different ingredients used for the production of the feed additives differed among the various products.
Table 1. Composition of the studied feed additives: name of the active substances along with the corresponding concentration (g kg–1) in the feed additive. For nicarbazin the concentration is expressed as mass fraction, whereas for monensin and narasin the concentration is expressed in terms of activity as specified in ISO standard 14183 (Citation2005). Also shown are the main ingredients of the feed additive and the corresponding Commission Regulation authorising them.
In order to generate the model, per product, three subsamples from different batches were taken; and per subsample 100 spectra were acquired. In a second step a new subsample from a different batch was taken in order to validate the developed model.
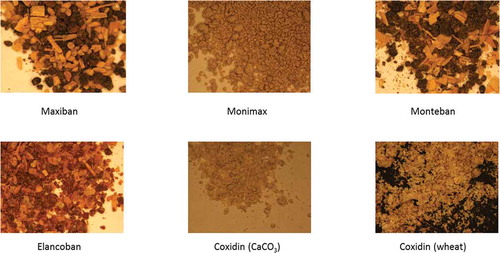
The sample preparation procedure was selected taking into account the properties of the feed additives and the mode of measurement of the spectrometers used in this study. The visual inspection of the feed additives by light microscopy as shown in revealed the presence of particles of different size and colour, reflecting the information on the heterogeneous composition of these samples from . Since the specific composition was considered as an important factor when characterising the feed additives by spectroscopy, the selected measurement mode had to reflect the observed heterogeneity of the studied products. On the other hand, the MIR instrumentation required the use of KBr pellets. Therefore, both the feed additives and the active substances were reduced in particle size with an agate mortar, ensuring that the collection of spectra from individual particles was still possible. The sample preparation following this step was different for NIR and MIR spectroscopy. For NIR microscopy, the subsamples were measured after the above described sample preparation straightforwardly on the Spectralon plate, and in the case of MIR, subsamples were mixed with KBr in a ratio of 1:20 (active substance or feed additive to KBr), pressed to a pellet (1.3 cm diameter, 0.5 mm thickness) using a manual hydraulic press (Specac) at 10 ton and then subjected to the spectroscopic measurement (ATR was also tried, but due to the sticky behaviour of the product KBr pellets were preferred).
Figure 1. Feed additives included in this study and prior to sample preparation.
MIR spectroscopic measurement
In this study the treated subsamples were presented to the microscope as KBr pellets. They were measured soon after the discs were pressed employing a mid-infrared spectrometer from Bruker (LUMOS, Bruker, Belgium) with a highly sensitive photoconductive HgCdTe detector. Acquisition was performed in transmittance mode with a scanning range of 4000 to 600 cm−1 in 2 cm−1 intervals, using an aperture size of 30 µm × 30 µm and 100 sampling points (10 × 10). The spectra were obtained by co-adding 64 scans from the same mapping point. The focusing of the disk was done manually by employing the data acquisition OPUS software (OPUS, v.7.2.) and using the OPUS-Video tool.
NIR spectroscopic measurement
In this study a Fourier-transformed NIR spectrometer from Perkin Elmer (Perkin Elmer Spectrum One NTS system, Belgium) equipped with a Perkin Elmer Spotlight microscope and coupled to a HgCdTe detector was used. The treated subsample was spread on a Spectralon plate and presented to the FT-NIR microscope using an aperture size of 50 µm × 50 µm. The spectra were collected with a scanning range of 6200 to 4000 cm−1 and a resolution of 2 cm−1 by selecting visually an area of the powder and focussing the infrared beam. One hundred sampling points (10 × 10 spectra) were acquired co-adding 80 scans in each point.
Data treatment
In the frame of the statistical analyses, each spectrum was considered as an independent measurement reflecting the variability of the composition of the studied products. All spectra collected from the different samples by the MIR and NIR spectrometers were processed and subjected to various multivariate statistics using the software package Unscrambler®X (CAMO software, Trondheim, Norway).
Pre-processing of the spectra is one of the first steps in the analysis of spectroscopic data in order to remove undesired systematic variation in the data such as baseline drift, scatter effects and to improve the signal-to-noise ratio. In fact, the most common pre-processing techniques are the multiplicative signal correction (MSC), standard normal variate (SNV), Savitzky–Golay smoothing and filtering; and the first- and second-order derivation (Rinnan et al. Citation2009; Omar et al. Citation2012). Spectra pre-processing was different for the MIR and NIR measurements. In the case of the MIR data, SNV was chosen as a pre-processing tool for the spectra in order to enhance the signal-to-noise ratio for building the models. For NIR, the spectra were first subjected to SNV and then treated with first derivative (Savitzky–Golay) with a window size of five and a second-order polynomial was applied. In order to predict the statistical performance of the built models, leave-one-out cross-validation was applied. For both NIR and MIR techniques, about 300 spectra were considered together for building each model.
Once the models were satisfactory and in order to validate them by means of a new set of data, new measurements for each of the feed additives and active substances were done for MIR in transmittance and for NIR in reflectance, respectively. For the method validation, about 200 spectra were acquired considering both the feed additives and active substances, and they were projected on the previously established model.
Results and discussion
The results from the study are presented in two steps. First, mean MIR and NIR spectra were calculated separately from the 100 spectra obtained for each feed additive and active substance in order to describe visually differences and similarities of these spectra. Then various multivariate tools were applied to exploit all the information that is available in the spectra.
MIR and NIR spectra of the active substances
The averaged spectra of the active substances for MIR and NIR spectroscopy are presented in . When comparing the spectra of the three active substances in MIR ()), many peaks of the compounds narasin and monensin coincide in the range of 1800 to 600 cm−1 and 3050 to 2800 cm−1, except for one peak of narasin at wave number 1707 cm−1 and two peaks of monensin at wave numbers 1417 and 1568 cm−1. The spectra of nicarbazin can be more easily differentiated from the other two studied active substances. When comparing the molecules, nicarbazin is a much smaller molecule than monensin and narasin; moreover, nicarbazin is rich in nitrogen.
Figure 2. (colour online) Active substances: mean spectra of MIR (a) and NIR (b). Arrows in the MIR spectra show the characteristic peaks of narasin and monensin mentioned in the text and which correspond to the arrows shown in .
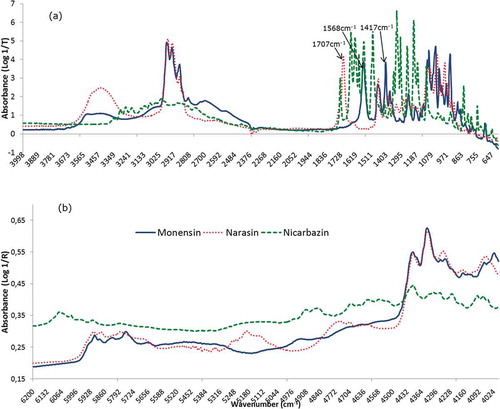
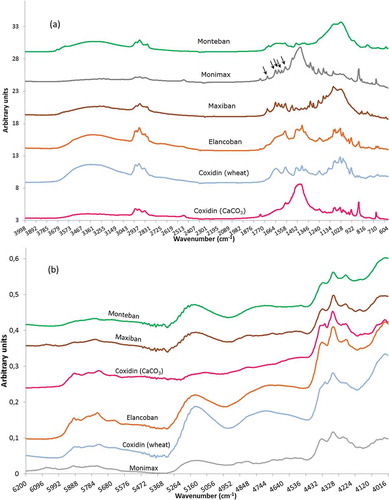
Figure 3. (colour online) Feed additives: mean spectra of MIR (a) and NIR (b). Little arrows in the MIR spectra show the characteristic peaks of nicarbazin mentioned in the text and which correspond to the arrows shown in .
In the case of the active substances ()) monensin and narasin showed a similar spectrum in NIR except for the regions of 5000–5300 and 4550–4800 cm−1. In contrast, nicarbazin had a very different spectrum from the other two compounds, which corresponded well with the observation from the MIR measurements, these main differences among the active substances could also be appreciated in the loadings of the generated models (results not shown).
MIR and NIR spectra of the feed additives
The averaged spectra of the feed additives for MIR and NIR spectroscopy are presented in . The comparison of the averaged spectra from MIR spectroscopy ()) indicated that some of the feed additives could be distinguished from each other by visual inspection such as Monteban and Coxidin (CaCO3), whereas Elancoban and Coxidin (wheat) showed very similar absorbance characteristics. For Monimax and Maxiban five peaks as indicated by small arrows in ) could be clearly identified in the range of 1780 to 1530 cm−1 ()), which revealed the contribution of the spectra of nicarbazin.
In contrast to the previous observations, NIR spectra of all the studied feed additives looked very similar ()). In consequence, it would be difficult to differentiate these products by visual inspection.
Principal component analysis (PCA) of the feed additives and active substances for MIR and NIR
Two PCA models were built with the acquired spectra from the feed additives and active substance in MIR and NIR, respectively. The objective of this calculation was to establish whether these materials could be differentiated by IR spectroscopy combined with multivariate statistics. From the loadings of the two PCAs models built for the MIR and NIR it can be concluded that the full studied ranges (4000 to 600 and 6200 to 4000 cm−1 respectively) were necessary to characterise fully the coccidiostats by spectroscopy. Therefore, all the acquired information was subjected to statistical assessment.
MIR spectroscopy
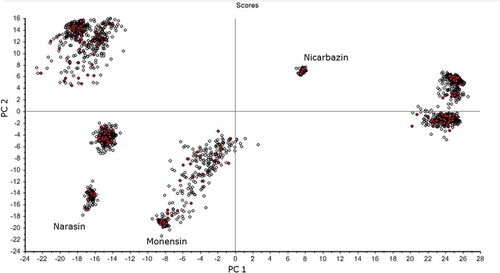
shows the results from PCA revealing that 72% of the total variance was explained by the two first PCs, namely 54% for principal component (PC) 1 and 18% for PC 2. Concerning the active substances, monensin and narasin were projected in the negative region of both PCs, whereas nicarbazin was projected in the opposite region. The results from PCA corresponded with the visual inspection of the measured spectra as shown in , since the spectra of narasin and monensin showed some similarities, whereas both spectra were very different from the corresponding spectrum of nicarbazin.
Figure 4. (colour online) MIR spectroscopy: score plot of PC1 versus PC2 of the active substances together with the feed additives.
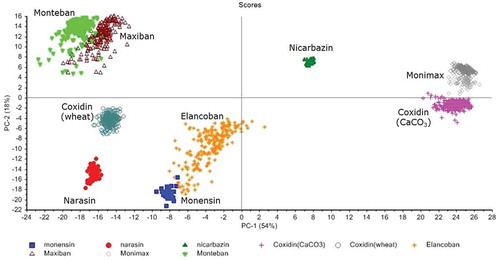
As it can be observed in the active substance has an impact in the projection of the feed additives. Monteban and Maxiban, containing narasin at 100 and 80 g kg–1 respectively, are projected together in the upper left side of the plot. Moreover, all the feed additives that have only monensin as active substance, are all projected along the negative axis of PC2. However, the PCA results also showed that the specific formulation has a significant impact on the calculated scores of PC1 and PC2. For instance Coxidin (wheat) and Coxidin (CaCO3) are well separated in the score plot (), despite having the same coccidiostat (monensin) at the same concentration (250 g kg–1) as active substance. This means that the different ingredients employed in the production of these feed additives have an important impact on the projection of the spectra on the PCA model. Elancoban which contains the same coccidiostat (monensin) at 20 g kg–1 can also be clearly differentiated from both Coxidin feed additives.
Monteban and Maxiban, which are both rich in narasin, were projected close together in the score plot (), but could still be separated, with some overlapping sampling points. Furthermore, Maxiban and Monimax are a mixture of two active substances and have nicarbazin in common. The scores of PC 2 for nicarbazin were all positive and this may be the reason that both feed additives were also projected on the region with positive scores of PC2. This assumption is also supported by the examination of the loadings of the PCs from these feed additives, indicating important contributions from peaks in the region of 1400–1600 cm−1, where also nicarbazin showed intensive peaks (). Nevertheless, the different composition of both feed additives in terms of the main ingredients allowed their separation in the score plot of PC 1 and PC 2.
The impact of the heterogeneity of the products is also reflected in , where the clouds of spectra from active substances are narrower than those from feed additives reflecting the heterogeneity of their composition. As was mentioned in the sample preparation section, three subsamples (from three different samples) were analysed for each feed additive and active substance. The same distribution and same explained variance was obtained for each of the subsamples in the individual PCAs carried out for each of them, thus a model considering the three subsamples as replicates was chosen. Even as the MIR measurements were carried out on different days and each mapping lasted more than 1 h, it can be stated that the reproducibility of the method allows the characterisation of the feed additives as there were no significant differences among the three subsamples.
NIR spectroscopy
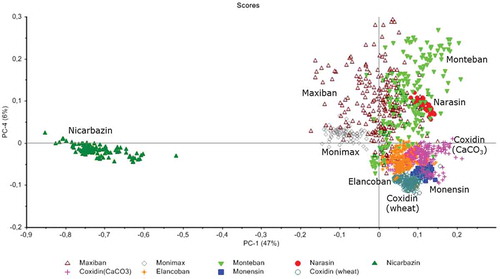
shows the results from PCA showing that 52% of the total variance was explained by the first and fourth PCs (PC 1, 46%; PC 4, 6%). The score plot of these PCs shows that nicarabazin was well separated from the other test materials on PC 1, whereas all the other test materials appeared closer to each other. This result corresponded well with the mean NIR spectra ()), since nicarbazin had a very different spectrum compared with the other active substances. Like in MIR, feed additives and the corresponding were projected on a similar region of the score plot of PC 1 against PC 4. For instance, both Coxidin feed additives and Elancoban and monensin were projected together in the negative region of PC 4 and the positive region of PC 1. Furthermore, Monteban and Maxiban that have narasin in common were both projected in the positive region of PC 4. In addition, Maxiban was projected closer to nicarbazin which is another active substance of this product. Maxiban showed some overlapping with Monimax which also contains nicarbazin. The results from PCA indicate, therefore, that the active substance had an important impact on the region, where the corresponding feed additives showed up. Nevertheless, the complete formulation has to be considered for the scores of the principal components of the feed additives. It has to be mentioned as well that the disperse cloud formed by Maxiban and Monteban in the PCA of the NIR measurements was likely to be due to the heterogeneity of the product, which was still present even after the sample preparation applied.
Figure 5. (colour online) NIR spectroscopy: score plot of PC1 versus PC 4 of the active substances (narasin in red, monensin in blue and nicarbazin in green) together with the three replicates of the feed additives.
Validation of a PCA model from MIR measurements
In order to validate the built models, measurements from a separate sample set (from a different batch) independent from the calibration sample set were performed. Therefore, a new KBr disc was prepared for each of the feed additives and active substances in the case of MIR and a new measurement was carried out for each compound in reflectance for NIR. About 200 spectra were acquired for the validation of the feed additives and active substances and they were projected on the previously established PCA models. The results are shown in , where the calibration samples are represented in white and the projected samples in red. In all cases the predicted samples are very close to the ones from the model, which ensures good reproducibility of the method and easy identification of the new spectra (NIR results not shown), as it can be observed in . Very similar results were obtained when validating the model from NIR measurements (results not shown).
Figure 6. (colour online) Projection of the validation sample set (red dots) in the PCA model built before (white dots) for the MIR data of the feed additives and the active substances.
Soft independent modelling by class analogy (SIMCA) for MIR data of feed additives
Since the MIR spectra of Coxidin (wheat) and Elancoban were very similar, as shown in ), a supervised classification method was applied on the spectra in order to enhance the separation of both feed additives. Here, soft independent modelling by class analogy (SIMCA) was employed, which is based on the principle that in the first step two separate PCA models were built for Elancoban and Coxidin (wheat) (Yang et al. Citation2013; Cevoli et al. Citation2013), and in the second step 50 spectra of new measurements from the same feed additives, which were not employed for building or validating the models, were projected on the two models. These spectra were then classified as Elancoban or Coxidin (wheat) by applying two criteria, namely (1) the distance of the new sample to the model; and (2) the distance of the new sample to the model centre. For both criteria a 5% significance level was used indicating critical distances above which membership to a specific PCA model was denied. The evaluation revealed that the vast majority of the new spectra were correctly classified either as Elancoban or Coxidin (wheat). In addition, no wrong classifications were observed, i.e. no spectra from Elancoban were wrongly classified as Coxidin (wheat), or vice versa. According to the 5% significance level, a few spectra could not be classified neither as Elancoban nor as Coxidin (wheat).
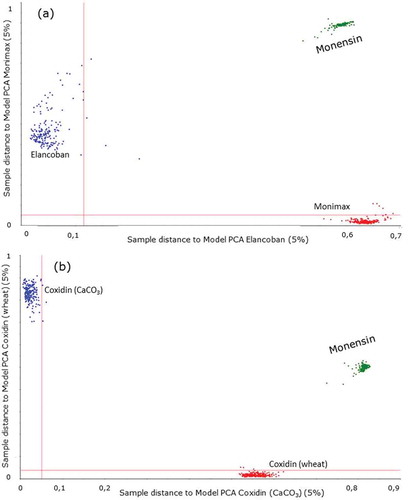
SIMCA was also employed with a different approach than a classification tool, since the aim was to check if the feed additives Elancoban, Coxidin (wheat), Coxidin (CaCO3) and Monimax that are all rich in monensin could be identified by their active substance or whether the individual PCA models of the feed additive were more influenced by their specific formulations. First, individual PCA models were built for each feed additive and in the second step spectra of monensin were projected on these models. The results of this exercise are presented in , where for two feed additives the distance between the projected monensin spectra and the PCA models of these feed additives are shown (Coomans’ plot). For instance, in ) the projection of monensin on the PCA models of Monimax and Elancoban is presented. In addition, the projection of the spectra of Monimax (blue dots) and Elancoban (red dots) on the corresponding PCA models and the critical distances at the 5% significance limit – indicated as red lines – are included in the plot, to facilitate the interpretation of the results. The statistical assessment revealed that quite different results were obtained for the feed additives on the one hand and for monensin on the other hand. The spectra of Monimax for instance gained mainly values below the critical distance for the Monimax model, whereas the distances to the Elancoban model were quite above the critical value. The same was valid for the Elancoban spectra, but vice versa. A quite similar result was also observed for the two Coxidin feed additives, since the distance between the spectra of one product and the PCA model of the other product was very large and the distances between the spectra and the PCA models of the same product were very low ()). In contrast, the results for monensin were quite different, since for all four feed additives the distances of the monensin spectra to the PCA models were significantly above the critical value. This means that in all cases the statistical assessment by SIMCA indicated that the spectra of monensin were not a member of the group of spectra measured on the four feed additives. All these information led to the conclusion that the specific ingredients of the feed additives had a higher impact on the PCA models compared to the active substances. Interestingly, this applied even for Monimax, where the contribution of monensin was visible in the MIR spectra of the feed additives ()).
Figure 7. (colour online) Results from SIMCA: spectra of monensin projected on PCA models (1) of Monimax® and Elancoban® shown in (a) and (2) of Coxidin® (wheat) and Coxidin (CaCO3) shown in (b).
Partial least square-discriminant analysis (PLS-DA) for MIR and NIR data
As it could be observed in the principal component analysis section ( and ), some of the feed additives were projected very close to each other or even mixed as it is the case of (1) Maxiban and Monteban in MIR analysis, (2) Maxiban and Monteban, and (3) Elancoban and Coxidin (CaCO3) in the case of NIR analysis. Therefore PLS-DA as supervised modelling (Esbensen Citation2006) was applied to establish whether a clear separation of these feed additives was possible.
MIR spectra
The response variables of the PLS-DA model were set 1 for Maxiban and 2 for Monteban and the model was subjected to random cross validation (20 segments). The classification into two groups by the developed PLS-DA model is presented in ), showing the perfect separation of both groups. The model was obtained employing the first three factors, explaining 78% of the X variance and 95% of the Y variance.
Figure 8. Sample grouping of final PLS-DA. MIR: (a) Maxiban® and Monteban®. NIR: (b) Maxiban and Monteban. NIR: (c) Elancoban® and Coxidin®. The response variable was set to 1 and 2.
NIR spectra
The response variable was set to 1 for Maxiban and 2 for Monteban; 1 for Elancoban and 2 for Coxidin (CaCO3). The classification into two groups (in both cases) of the PLS-DA can be observed in (b, c), showing the perfect separation of both groups. The models were obtained employing the first 3 and 4 factors respectively, explaining 50% of the X variance and 78% of the Y variance in the case of Maxiban and Monteban and explaining 71% of the X variance and 92% of the Y variance in the case of Elancoban and Coxidin (CaCO3).
Conclusions
This work shows a first approach to the characterisation of coccidiostats-containing feed additives based on FT-MIR and FT-NIR microscopy. One of the main advantages of such techniques is that the sample preparation can be avoided. Various pure coccidiostat standards and feed additives containing these analytes were subjected to spectroscopic analysis, followed by the application of chemometric tools. The results of this study demonstrated that the feed additives could be distinguished on the basis of all the ingredients present in the product. Differentiation among the products that contained the same active substance was possible due to the significant contribution of all the ingredients of the feed additives to the established statistical models. Moreover, close scrutiny of the spectra obtained on the feed additives and active substances showed that differentiation of these spectra was in some cases very difficult by visual inspection, whereas sufficient differentiation could be achieved after the application of various chemometric tools. Moreover, the results showed the potential of MIR and NIR spectroscopy as efficient and rapid measurement tools when checking new products in the market against known and authorised feed additives. Based on these promising results, we will apply this approach to other feed additives where the traceability of the product has an important role in feed safety.
Disclosure statement
No potential conflict of interest was reported by the authors.
References
- Anzanello M, Fogliatto FS, Ortiz RS, Limberger R, Mariotti K. 2014. Selecting relevant Fourier transform infrared spectroscopy wavenumbers for clustering authentic and counterfeit drug samples. Sci Just. doi:10.1016/j.scijus.2014.04.005.
- Casale M, Oliveri P, Armanino C, Lanteri S, Forina M. 2010. NIR and UV-vis spectroscopy, artificial nose and tongue: comparison of four fingerprinting techniques for the characterisation of Italian red wines. Anal Chim Acta. 668:143–148.
- Cevoli C, Gori A, Nocetti M, Cuibus L, Caboni MF, Fabbri A. 2013. FT-NIR and FT-MIR spectroscopy to discriminate competitors, non compliance and compliance grated Parmigiano Reggiano cheese. Food Res Int. 52:214–220.
- Clarke L, Fodey TL, Crooks SRH, Moloney M, O’Mahony J, Delahaut P, O’Kennedy R, Danaher M. 2014. A review of coccidiostats and the analysis of their residues in meat and other food. Meat Sci. 97:358–374.
- Cozzolino D. 2014. An overview of the use of infrared spectroscopy and chemometrics in authenticity and traceability of cereals. Food Res Int. 60:262–265.
- Dorne JLCM, Fernandez-Cruz ML, Bertelsen U, Renshaw DW, Peltonen K, Anadon A, Feil A, Sanders P, Wester P, Fink-Gremmels J. 2013. Risk assessment of coccidostatics during feed cross-contamination: animal and human health aspects. Toxicol Appl Pharm. 270:196–208.
- Esbensen KH. 2006. Multivariate data analysis-in practice: an introduction to multivariate data analysis and experimental design. Esbjerg: Aalborg University, CAMO.
- Esslinger S, Riedl J, Fauhl-Hassek C. 2014. Potential and limitations of non-targeted fingerprinting for authentication of food in official control. Food Res Int. 60:189–204.
- EURL Feed Additives. 2014. [cited 2015 Jan 29]. Available from: https://ec.europa.eu/jrc/en/eurl/feed-additives/evaluation-reports
- European Union. 2015. Register of Feed Additives [Internet]. [cited 2015 Jan 29]. Available from: http://ec.europa.eu/food/food/animalnutrition/feedadditives/registeradditives_en.htm.
- International standard ISO 14183. 2005. Animal feeding stuffs — Determination of monensin, narasin and salinomycin contents — Liquid chromatographic method using post-column derivatization. 1st ed. Geneva: ISO.
- Li Y, Fan Q, Liu S, Wang L. 2011. Simultaneous analysis of moisture, active component and cake structure of lyophilized powder for injection with diffuse reflectance FT-NIR chemometrics. J Pharmaceut Biomed. 55:216–219.
- Moloney M, Clarke L, O’Mahony J, Gadaj A, O’Kennedy R, Danaher M. 2012. Determination of 20 coccidiostats in egg and avian muscle tissue using ultra high performance liquid chromatography–tandem mass spectrometry. J Chromatogr A. 1253:94–104.
- Omar J, Sarmiento A, Olivares M, Alonso I, Etxebarria N. 2012. Quantitative analysis of essential oils from rosemary in virgin olive oil using Raman spectroscopy and chemometrics. J Raman Spectrosc. 43:1151–1156.
- Ordoudi SA, de los Mozos Pascual M, Tsimidou MZ. 2014. On the quality control of traded saffron by means of transmission Fourier-transform mid-infrared (FT-MIR) spectroscopy and Chemometrics. Food Chem. 150:414–421.
- Regulation (EC) No. 1831/2003. European Parliament and of the Council of 22 September 2003 on additives for use in animal nutrition. Off J Eur Union. L268:1–15.
- Rinnan A, van den Berg F, Engelsen SB. 2009. Review of the most common pre-processing techniques for near-infrared spectra. TRAC-Trend Anal Chem. 28:1201–1222.
- Roggo Y, Chalus P, Maurer L, Lema-Martinez C, Edmond A, Jent N. 2007. A review of near infrared spectroscopy and chemometrics in pharmaceutical technologies. J Pharmaceut Biomed. 44:683–700.
- Xu C, Wang Y, Chen J, Zhou Q, Wang P, Yang Y, Sun S. 2013. Infrared macro-fingerprint analysis-through-separation for holographic chemical characterization of herbal medicine. J Pharmaceut Biomed. 74:298–307.
- Yang IC, Tsai CY, Hsieh KW, Yang CW, Ouyang F, Lo YM, Chen S. 2013. Integration of SIMCA and near-infrared spectroscopy for rapid and precise identification of herbal medicines. J Food Drug Anal. 21:268–278.
- Zhang J, Zhang X, Dediu L, Victor C. 2011. Review of the current application of fingerprinting allowing detection of food adulteration and fraud in China. Food Control. 22:1126–1135.