
ABSTRACT
For the implementation of Regulation (EC) No 2065/2003 related to smoke flavourings used or intended for use in or on foods a method based on solid-phase micro extraction (SPME) GC/MS was developed for the characterisation of liquid smoke products. A statistically based experimental design (DoE) was used for method optimisation. The best general conditions to quantitatively analyse the liquid smoke compounds were obtained with a polydimethylsiloxane/divinylbenzene (PDMS/DVB) fibre, 60°C extraction temperature, 30 min extraction time, 250°C desorption temperature, 180 s desorption time, 15 s agitation time, and 250 rpm agitation speed. Under the optimised conditions, 119 wood pyrolysis products including furan/pyran derivatives, phenols, guaiacol, syringol, benzenediol, and their derivatives, cyclic ketones, and several other heterocyclic compounds were identified. The proposed method was repeatable (RSD% <5) and the calibration functions were linear for all compounds under study. Nine isotopically labelled internal standards were used for improving quantification of analytes by compensating matrix effects that might affect headspace equilibrium and extractability of compounds. The optimised isotope dilution SPME-GC/MS based analytical method proved to be fit for purpose, allowing the rapid identification and quantification of volatile compounds in liquid smoke flavourings.
Introduction
About 10,000 t of liquid smoke flavourings are used in the EU annually. They mainly comprise primary smoke condensates, which are high in contents of phenolic compounds and carbonyls. Though the production process is roughly similar at all producers, differences in composition can be expected due to different process conditions (Guillen and Ibargoitia Citation1999). The chemical composition of liquid smoke is complex and depends, among other factors, on the type of wood used, the method used for developing smoke, the moisture content of the wood, and the temperature and oxygen concentration during smoke generation (Miler and Sikorski Citation1990; Guillen and Ibargoitia Citation1999; Cadwallader Citation2007). Liquid smoke constituents impart different properties to food. Phenolic compounds contribute to both flavour and colour of liquid smoke and have antibacterial and antioxidant properties (Clifford et al. Citation1980; Maga Citation1987; Varlet et al. Citation2007). Carbonyl-containing compounds impart sweet or burnt-sweet aroma and tend to soften the heavily smoky aroma associated with phenolic compounds with some ‘typical smoke-cured’ aromas (Fujimaki et al. Citation1974; Kim et al. Citation1974; Kostyra and Barylko-Pikielna Citation2006). Furthermore, carbonyl-containing compounds are involved in textural changes of smoked food, which are caused by interaction with proteins. They contribute also to the golden-brown colour of smoked products due to reaction with amino acids and the formation of Maillard reaction products (Varlet et al. Citation2007).
Commercial production and fractionation of liquid smoke involve proprietary processes; thus, the specific chemical composition of these products is generally not disclosed in detail to the public; for example, only limited information on the composition of smoke flavouring primary products can be retrieved from EFSA’s Scientific Opinions on the safety of smoke flavour primary products (EFSA Citation2011). This poses difficulties for official food control in assessing whether the levels and type of liquid smoke products used in foods are in compliance with legislation.
Currently in the EU, smoke flavourings are regulated separately from other flavourings by Regulation (EC) No 2065/Citation2003. This regulation defines smoke flavourings, sets maximum levels for certain chemicals, and specifies an authorisation process for smoke flavouring primary products. Regulation (EC) No 1321/Citation2013 establishes the list of smoke flavouring primary products authorised for use on the EU market. The margin of safety (MOS) for smoke flavours is currently set at 100 (Food Safety Authority of Ireland Citation2012). This means that the application of smoke flavours is restricted to levels 100 times below an amount that would generate an observable adverse effect in an animal model for toxicity testing. The current status of discussions within European risk assessment bodies is that a MOS of 300 should be set for smoke flavourings (Food Safety Authority of Ireland Citation2012; FSA Citation2014). Whatever the final outcome, it is evident that the implementation of any MOS will require determining the amount of smoke flavouring applied to a particular product.
The analysis of liquid smoke flavouring products was reviewed by Simon et al. (Citation2005). Liquid-liquid extraction is the usually applied technique for the isolation of volatiles and semi-volatiles from liquid smoke flavouring products, which requires no further sample preparation besides evaporation of the extraction solvent (Guillén and Manzanos Citation2002). The technique is of lesser use if smoked food has to be analysed, as intensive clean-up of the obtained extract will be necessary before chromatographic separation. Headspace techniques may offer an attractive alternative to liquid extraction, as they do not require extensive sample preparation.
The overall aim of a research project undertaken by the Joint Research Centre of the European Commission was to develop an analytical approach for compliance testing of the permitted maximum levels of liquid smoke flavourings added to foodstuffs (Regulation (EU) No 1321/Citation2013 2013). However, this goal cannot be reached easily as the measurand is, from the chemical point of view, not clearly defined. Knowledge about the batch-to-batch and product-to-product variability of the chemical composition of commercial primary liquid smoke products was considered to be a prerequisite.
This information will be translated a later stage to food products to which liquid smoke has been added. Therefore, the development of a suitable analytical method that can be applied to liquid smoke products as well as to food was regarded as the first step in the overall research strategy.
The present paper describes the development and optimisation of an isotope dilution solid-phase micro extraction (SPME)-GC/MS method for the characterisation of smoke flavour primary products. This solvent-free, inexpensive sampling technique has so far proven its suitability for obtaining a rich picture of the volatile constituents of several complex matrices (Setkova et al. Citation2007; Risticevic et al. Citation2008). A two-stage design of experiment (DoE) was applied for the optimisation of SPME conditions followed by evaluation of method performance parameters including reproducibility, repeatability, linearity, and instrumental LOD and LOQ. The optimised method was further applied to evaluate six commercial varieties of liquid smoke flavourings.
Materials and methods
Chemicals and standards
Of 119 identified substances, 52 (indicated by ‘Std’ in column 3 of ) were obtained from Sigma-Aldrich, Belgium. The isotopically labelled internal standards furfural-d4, 2-ethylphenol-d10, m-cresol-d8, and 4-hydroxybenzaldehyde-2,3,5,6-d4 were supplied by CDN Isotopes (Point-Claire, QC), and phenol-2,6-13C2, catechol-13C6, 4-methylcatechol-ring-d3, guaiacol-ring-13C6, and vanillin-ring-13C6 were supplied by Cambridge Isotope Laboratories Inc. (Tewksbury, MA). Methanolic solutions of reference substances spanning the concentration range of 1.0–1.2 mg/L were used for instrument calibration, in order to cover the wide range in detection limits of different smoke flavouring components.
Table 1. Identification and characterisation of liquid smoke flavouring components.
Samples
Commercial liquid smoke flavouring samples were collected with support from the Directorate General for Health and Food Safety (DG SANTE, European Commission) and stored under recommended storage conditions. Six varieties of liquid smoke flavourings were selected for evaluation of the profiles of constituents. The smoke flavour primary product Zesti Code 10 was used for development and optimisation of the SPME-GC/MS method.
Optimisation of the SPME procedure
A two-stage DoE was applied for the optimisation of SPME conditions. Informed by the literature, the effect of eight factors including fibre type (CAR/PDMS and PDMS), incubation time (3–10 min), isolation temperature (40–80°C) and time (15–45 min), sample size (0.5–1.5 mL), agitator speed (50–250 rpm), agitation time (15–45 s/min), and desorption time (15–180 s) was studied in the first stage using a two-level Plackett–Burman screening design comprising 12 runs.
Next, the performance of the five different SPME fibres including 100 µm polydimethylsiloxane (PDMS), 85 µm carboxen/polydimethylsiloxane (CAR/PDMS), 65 µm polydimethylsiloxane/divinylbenzene (PDMS/DVB), 50/30 µm divinylbenzene/carboxen/polydimethylsiloxane (DVB/CAR/PDMS), and polyacrylate (PA) (all from Supelco, Bellefonte, PA) were evaluated under the optimised GC/MS conditions.
The SPME fibre identified as most suitable for the analysis of smoke flavouring constituents was applied in the second stage to evaluate the effects and interactions of variables identified as most significant. Response surface methodology was employed for this purpose together with a central composite design (CCD), a circumscribed design with duplicate central points, comprising 16 runs (RSM). The independent variables were isolation temperature, time, and sample size. Sample analysis sequences were randomised to provide protection against the effect of hidden variables and systematic errors. Absolute peak intensity was used for the purpose of optimisation. Details of the screening and central composite designs are presented in Supplemental Figure 1. DoE was performed with the statistical software R, v. 3.0.2. (http://www.r-project.org).
Gas chromatography – mass spectrometry
Analysis of volatiles was carried out on an Agilent 6890 gas chromatograph (Agilent, Santa Clara, CA) hyphenated to an Agilent 5973 single quadrupole mass spectrometer operated in electron ionisation mode at 70 eV ionisation energy and mass range of 40–350 m/z. The GC was equipped with a DB-5 fused silica open tubular capillary column (0.250 mm i.d. × 60 m, 0.25 µm in film thickness; J & W Scientific, Agilent). Analyses were performed in splitless mode. HS-SPME was automated with a Gerstel MPS2 autosampler (Gerstel, Mühlheim an der Ruhr, Germany). Helium was used as a carrier gas at a column flow rate of 1 mL/min. The column temperature was programmed from 40°C (holding time 3 min) to 200°C at a rate of 3°C/min and finally to 275°C at a rate of 10°C/min. Injector, transfer line, and ion-source temperatures were 250°C.
Identification and quantification
Substances were identified in the first instance by comparing mass spectra (MS) with mass spectral library data (NIST 12 version 5.2), and actually determined Kovats retention indices (RIs) with published RIs. Out of 119 peaks tentatively identified by comparing MS and RIs in the SPME-GC/MS chromatogram, the identities of 52 peaks were confirmed by the analysis of reference substances ().
It is worth mentioning that the headspace equilibrium as well as extractability of substances was greatly influenced by the presence of volatile compounds other than the selected substances, particularly if they occurred in high concentrations. To compensate for such matrix effects, 9 isotopically labelled internal standards (IS) including furfural-d4 (for compound group: furan/pyran derivatives); 2-ethylphenol-d10 and m-cresol-d8 (phenol); 4-hydroxybenzaldehyde-2,3,5,6-d4 (aldehydes and ketones); catechol-13C6 and 4-methylcatechol-ring-d3 (benzenediol and derivatives); guaiacol-ring-13C6 (guaiacol and derivatives); vanillin-ring-13C6 (vanillin); and phenol-2,6-13C2 (other related compounds) were used to quantify analytes in different primary liquid smoke products with high accuracy. For this purpose, a 10 µL solution of the IS mixture (0.1 mg/mL, dissolved in methanol) was added before HS-SPME in 22 mL headspace vials to each 100 µL of liquid smoke product. Calibration curves were created for quantification of volatile compounds using the optimised HS-SPME conditions by placing 10 μL of methanolic solutions of reference standards with 10 µL solution of the IS mixture into 22 mL HS vials. Calibration curves were prepared on basis of at least five calibration levels (1.0–1.2 mg/L). Linearity of responses were evaluated by visual inspection of the calibration graphs and analysis of residuals. Repeatability and intermediate precision were evaluated for the analysis of liquid smoke products. Intermediate precision was determined on 5 different days within a 4-week period. All the analyses were performed in triplicate. Precision was expressed as RSD after separating intra- and inter-day components by analysis of variance (ANOVA).
Results and discussion
Optimisation of the SPME method
Liquid smoke components derived through controlled pyrolysis of wood comprises different families of compounds including carbonyl-containing compounds, phenol derivatives, acids, and tars with distinct chemical characteristics. Thus, it was necessary to optimise the extraction conditions to find a compromise regarding sensitivity and precision for the entire set of smoke flavour substances. Out of 119 compounds identified in liquid smoke flavourings, 34 substances were selected for screening design. Sixteen substances out of the 34 were further used for optimising the responses via a CCD. They were selected to cover a wide range of functional groups and retention indices in order to represent a broad spectrum of liquid smoke components. contains the identification and quantification criteria of the substances.
A particular commercial liquid smoked sample (Zesti Code 10) was used for optimisation of the SPME conditions. Screening of SPME factors including sample size, fibre, incubation time, isolation time and temperature, agitation time and speed, and desorption time was performed based on the screening design. Half-normal plot and main effect plot derived through screening design revealed the influence of the SPME factors on volatile extraction (Supplemental Figure 2). Among the eight factors studied type of fibre, sample size, isolation temperature, and isolation time had a significant effect (p<0.05) on the response. These four factors were considered for further optimisation. The non-significant factors were fixed at moderate levels for the rest of the experiments.
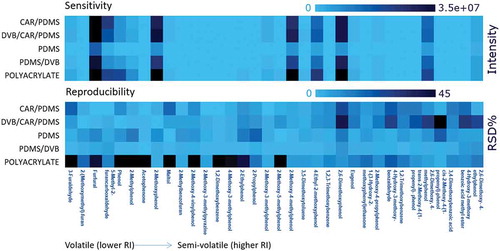
Different types of SPME phase are selective to different groups of compounds. Five commercially available fibres coated with different phases were evaluated for selectivity, extraction efficiencies, and repeatability. The heat map presented in (darker colour indicates higher values; lighter colour, lower values) for relative intensities (peak areas) and precision (RSD of peak areas) for 34 smoke flavouring compounds revealed that a higher extraction yield was obtained with the PA fibre for most of the liquid smoke components, followed by DVB/CAR/PBMS, PDMS/DVB, CAR/PDMS, and PDMS phases. This is due to the high hydrophilic/highly polar properties of liquid smoke compounds facilitating the extraction with the polar PA fibre (Guillen et al. Citation2004; Passeport et al. Citation2010). However, poor precision, expressed as RSD, was observed for the PA fibre particularly for highly volatile compounds. In contrast, DVB/CAR/PDMS showed poor precision for semi-/low-volatile compounds. PDMS and PDMS/DVB provided both good precision of results. Finally, PDMS/DVB fibres were selected for the analysis of smoke flavourings due to moderately higher extraction efficiency compared with PDMS fibres. Moreover, satisfactory intermediate precision was achieved with the application of PDMS/DVB fibres.
Figure 1. Heat map representing the sensitivity and precision in terms of intensity and RSD% for different commercial SPME fibres including CAR/PDMS, DVB/CAR/PDMS, PDMS, PDMS/DVB, and polyacrylate coatings.
A central composite design was carried out with the PDMS/DVB fibre to further optimise the three significant parameters (sample size, isolation time, and isolation temperature). The experimental domain for the response surface method (RMS) was defined taking into account instrumental and operative limits as well as the results previously obtained by other researchers (Millán and Pawliszyn Citation2000; Centineo et al. Citation2004; Bravo et al. Citation2005; Devos et al. Citation2005; Segovia-Martínez et al. Citation2010; Tzollas and Zachariadis Citation2010). The sample size range was defined considering the linear range of the GC/MS for certain liquid smoke components, which was studied in preliminary experiments. Isolation temperature is a critical variable that typically influences the headspace composition (Bicchi et al. Citation2000). Regarding extraction time, we tried to find a compromise between analysis speed and good sensitivity. Supplemental shows the regression coefficient and ANOVA results for a quadratic model for 16 major smoke flavour components studied by a CCD. Results revealed that higher isolation temperatures promote larger effects on the response of semi-volatile compounds than isolation time and sample size. However, this must be balanced against the desorption of analytes from the fibre. If the temperature increases, then the ability of fibres to adsorb analytes will decrease.
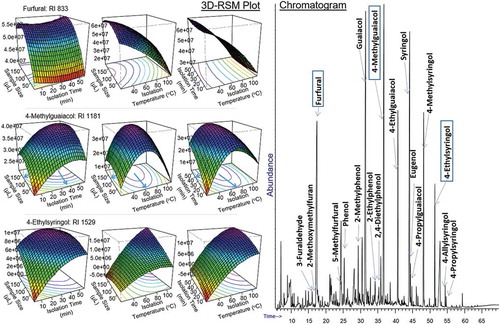
Consequently, optimisation of SPME parameters usually focuses on the compounds eluting in the middle of the chromatogram, which provides the best compromise between the very high- and low-volatile compounds eluting in the beginning and at the end of the chromatogram, respectively. presents the chromatogram of a commercial liquid smoke product obtained under the optimised conditions. Response surfaces of high- (furfural), medium- (4-methylguaiacol), and low (4-ethylsyringol)-volatile compounds in liquid smoke are presented on the left of the chromatogram. The results revealed that the optimum conditions, in particular isolation time and temperature, for the compounds eluting in the middle of the chromatogram, such as 4-methylguaiacol, are excessive for the high-volatile compounds like furfural, but not sufficient for low-volatile compounds like 4-ethylsyringol. However, the optimum SPME condition for 4-methylguaiacol was still the best compromise to cover very high- to low-volatile compounds and was finally chosen as a general condition to analyse liquid smoke compounds. The condition included extraction with a PDMS/DVB fibre at 60°C extraction temperature for 30 min extraction time. Other parameter settings were 250°C desorption temperature, 180 s desorption time, 15 s/min agitation time, and 250 rpm agitation speed.
Figure 2. Chromatographic elution pattern of the liquid smoke components and response surfaces of high- (furfural), medium- (4-methylguaiacol), and low (4-ethylsyringol)-volatile compounds in liquid smoke.
Performance evaluation of the optimised method
Fifty-two smoke flavouring constituents were quantified via calibration curves based on reference standards (listed in ). The concentrations of the rest of the tentatively identified compounds could not be determined, since their response factors were not known. Their contents were expressed as equivalents to other smoke flavour constituents (pseudo-content), for which calibrations based on reference substances were available. Keeping the number of substances ‘equivalent for calibration’ low was preferred to selecting the most similar reference substance among the available reference materials, since fragmentation patterns as well as relative abundances of the fragments could differ a lot, despite similar chemical structures. Consequently, it has to be highlighted that these pseudo-contents do not carry any quantitative information. However, they are useful for the comparison of different products.
Nine isotopically labelled analogues of certain analytes were used as IS to compensate for matrix effects and improve accuracy of quantification. The coefficient of determination of obtained calibration curves ranged between 0.961 and 0.999. Intra- as well as inter-day precisions in terms of RSD values were well below 5% for most of the studied compounds. Statistical analyses (ANOVA, p>0.05) did not reveal any significant differences in analytical precision in the determination of the selected compounds in primary liquid smoke within the experimental period of 4 weeks (). The determination of realistic LODs and LOQs of substances contained in liquid smoke primary products was considered very difficult due to the non-availability of liquid smoke products devoid of individual compounds. Therefore, it was preferred to demonstrate the capability of the measurement system by estimating instrumental LODs and instrumental LOQs. These were derived from the generated calibration functions according to the German Industrial Norm DIN 32645:Citation2008-11 (2008). In brief, instrumental LOD and LOQ were calculated as respectively 3.5 and 10 times the ratio of the SD of signals at the lowest calibration level and the slope of the calibration curve. The results are shown in . Instrumental LOQs were in the range of 1.6–5.2 μgL−1 for furan derivatives, 1.8–10.9 μgL−1 for phenols, and 1.0–35.4 μgL−1 for guaiacols. The LOQ for syringol was 9.7 μgL−1. In the absence of matrix effects, the values were in most cases lower than those found by Giordano et al. (Citation2003), employing HS-SPME for furfural and 5-methylfurfural (LOQ >50–135 μgL−1 in vinegar); Nie and Kleine-Benne (Citation2012), employing stir bar sorptive extraction (SBSE) for several phenols and guaiacols (LOQ, 240–320 and 320–530 μgL−1 in whisky, respectively); Félix et al. (Citation2013), employing HS-SPME for several furan derivatives, phenols, guaiacol, and syringol (LOQ, 20.2–40.4, 10–65, 255.4, and 73.4 μg kg−1 in sawdust composites, respectively).
Table 2. Method performance characteristics associated with liquid smoke components.
Volatile compounds of primary smoke
The method was applied to the analysis of six primary smoke flavouring products. Altogether, 119 compounds were determined in these samples including phenolics, guaiacol, syringol, benzenediol derivatives, ketones, furans, and several other compounds ().
Table 3. Contents of smoke flavouring compounds in several commercial primary smoke flavouring products.b
Within the group of phenolic compounds, the proportion of phenol is remarkable (18.2–325.4 mg L−1), as are the proportions of several alkylphenol derivatives such as 2-methylphenol (9.3–116.0 mg L−1), 2-ethylphenol (0.7–5.3 mg L−1), together with 2,5-dimethylphenol (2.2–20.3 mg L−1), 2,3-dimethylphenol (0.8–2.8 mg L−1), and 2,3,6-trimethylphenol (1.4–3.6 mg L−1). Similar concentration ranges have been reported in the literature for commercial smoke flavourings, although results should be compared with caution because of the different analytical methods and calculation approaches used by the various researchers (Guillen et al. Citation1995; Guillén and Ibargoitia Citation1998; Suñen et al. Citation2003; Kostyra and Barylko-Pikielna Citation2006). Guillen and Manzanos (Citation1999) reported phenol as a major compound (175 mg L−1) in aqueous smoke flavourings followed by 3-methylphenol (111 mg L−1), 3-ethylphenol (75 mg L−1), and 2-methylphenol (73 mg L−1). Guaiacol (25.9–304.4 mg L−1) and syringol (1.4–34.2 mg L−1) were in the studied samples the most abundant 2-methoxy- and 2,6-dimethoxy substituted phenols. Their corresponding alkyl derivatives including 4-methylguaiacol (15.0–251.1 mg L−1), 4-vinylguaiacol (3.1–42.6 mg L−1), 4-ethylguaiacol (1.6–35.6 mg L−1), 4-propylguaiacol (0.5–3.8 mg L−1), 4-allylsyringol (0.4–1.6 mg L−1), as well as tentatively identified 4-methylsyringol, 4-ethylsyringol, and 4-propylsyringol, were detected in the majority of samples, consistent with results obtained by Soldera et al. (Citation2008). The concentrations of pyrocatechol and derivatives were at much lower levels varying between 0.1 and 1.6 mg L−1. Similar observations were reported by Guillen and Manzanos (Citation1999) for guaiacol (178 mg L−1), 4-methylguaiacol (44 mg L−1), 4-vinylguaiacol (19 mg L−1), 4-ethylguaiacol (22 mg L−1), syringol (43 mg L−1), and pyrocatechol (4 mg L−1) in liquid smoke.
Kim et al. (Citation1974) postulated that the great variability in concentrations of phenolic substances contained in different liquid smoke flavourings can be explained by the influence of the type of feedstock (softwood/hardwood) used for the production of smoke. When softwood is used for smoke production, syringol derivatives are barely detectable (Edye and Richards Citation1991; Guillen et al. Citation1995). However, the pattern of phenolic substances found in the analysed test samples indicated that a mixture of low amount of hardwood and high amount of softwood might have been used for their production. Of note are the high abundances of several other phenolics in primary smoke flavourings including eugenol, isoeugenol, homovanillyl alcohol, acetovanillone, and 2-propiovanillone.
Among several cyclic ketones, cyclotene, cyclopentanone, 2-methyl-2-cyclopenten-1-one, and several other mono-, di-, and trimethyl-2-cyclopenten-1-one isomers were detected in primary smoke. Cyclotene was previously detected in Atlantic salmon treated with liquid smoke (Serot et al. Citation2007). Apart from the cyclic ketones, presence of 3-hydroxy-2-butanone and 1-acetyloxy-2-propanone were evident in the primary smoke products. They are generated during low temperature pyrolysis of wood hemicelluloses (Yi-Min et al. Citation2009). These results concord with the findings of Guillen and Manzanos (Citation1999), who reported 1-acetyloxy-propan-2-one and cyclotene as the main components contained in liquid smoke in the group of ketones and diketones, respectively.
The predominant furan compounds were 3-furancarboxaldehyde (2.0–7.5 mg L−1) and 5-methyl-2-furancarboxaldehyde (8.3–66.3 mg L−1). Maltol was also found in primary smoke flavourings. It is one of the main compounds detected in beechwood liquid smoke (Guillen and Ibargoitia Citation1999). It was also present in considerable amounts in several other liquid smoke products reported earlier (Guillen and Manzanos Citation1997, Citation1999). Other minor compounds of this group detected in the tested samples were 1-(2-furanyl)-1-propanone, 1-(2-furanyl)-ethanone, and 3-hydroxy-2-methyl-4H-pyran-4-one.
Miscellaneous other compounds such as mono-terpenes including pinenes, phellandrene, limonene, and linalool were also measured. Several methoxy benzenes including 1,2-dimethoxybenzene (veratrole), 1,4-dimethoxybenzene, 1,2,3-trimethoxybenzene, and 1,2,3-trimethoxy-5-methylbenzene were also identified in the test samples. These compounds were previously detected at low concentrations in smoked Atlantic salmon treated with liquid smoke (Serot et al. Citation2007). Interestingly, a pyrazine derivative, 2-methoxy-3-methylpyrazine, was found in the primary smoke samples analysed. This substance was previously reported to be associated with hickory smoke (Maga and Chen Citation1985; Guillen and Manzanos Citation1999).
Conclusions
The isotope dilution SPME-GC/MS analysis method, which was developed and optimised in this study, was found to be suitable for the determination of smoke flavouring components in primary liquid smoke products. This rapid, simple, and solvent-free SPME technique provides low detection and quantification limits with good precision for major smoke components. Overall, the method developed in this study is useful for quality control of liquid smoke products, and will support food product developers in the selection and characterisation of suitable liquid smoke flavourings.
tfac-2017-272-File008.tif
Download TIFF Image (888.7 KB)tfac-2017-272-File007.docx
Download MS Word (97.4 KB)Disclosure statement
No potential conflict of interest was reported by the authors.
Supplemental data
Supplemental data for this article can be accessed here.
Related Research Data
References
- Bicchi C, Cordero C, Iori C, Rubiolo P, Sandra P. 2000. Headspace sorptive extraction (HSSE) in the headspace analysis of aromatic and medicinal plants. J High Resolut Chromatogr. 23:539–546.
- Bravo M, Lespes G, Gregori I, Pinochet H, Gautier MP. 2005. Determination of organotin compounds by headspace solid-phase microextraction–gas chromatography–pulsed flame-photometric detection (HS-SPME–GC–PFPD). Anal Bioanal Chem. 383:1082–1089.
- Cadwallader KR. 2007. Wood smoke flavor. In: Nollet FML, Editor. Handbook of meat, poultry and seafood quality. Ames, IA: Blackwell Publishing; p. 201–210.
- Centineo G, González EB, Sanz-Medel A. 2004. Multielemental speciation analysis of organometallic compounds of mercury, lead and tin in natural water samples by headspace-solid phase microextraction followed by gas chromatography-mass spectrometry. J Chromatogr A. 1034:191–197.
- Clifford MN, Tang SL, Eyo AA. 1980. Smoking of foods. Process Biochem. 15:8–26.
- Devos C, Vliegen M, Willaert B, David F, Moens L, Sandra P. 2005. Automated headspace-solid-phase micro extraction–retention time locked-isotope dilution gas chromatography–mass spectrometry for the analysis of organotin compounds in water and sediment samples. J Chromatogr A. 1079:408–414.
- DIN 32645: 2008-11. 2008. Chemical analysis—decision limit, detection limit and determination limit under repeatability conditions—terms, methods, evaluation. Berlin: Beuth Publishing.
- Edye LA, Richards GN. 1991. Analysis of condensates from wood smoke: components derived from polysaccharides and lignins. Environ Sci Technol. 25:1133–1137.
- EFSA panel on food contact materials, enzymes, flavourings and processing aids. 2011. Scientific opinion on request from the European Commission on safety of smoke flavour primary product Fumokomp – 2011 Update. Efsa J. 9:1343.
- Félix JS, Domeño C, Nerín C. 2013. Characterization of wood plastic composites made from landfill-derived plastic and sawdust: volatile compounds and olfactometric analysis. Waste Manage. 33:645–655.
- Food Safety Authority of Ireland. 2012. Guidance on flavourings. Dublin, ISBN 1-904465-88-9. https://www.fsai.ie/guidanceonflavourings.html ( Accessed 2015 Feb 2).
- Food Standards Agency (FSA). 2014. Union list of smoke flavouring primary products to be used in or on food. http://www.food.gov.uk/sites/default/files/multimedia/pdfs/consultation/smoke-flavouring-consult-wales.pdf ( Accessed 2015 Apr 5).
- Fujimaki M, Kim K, Kurata T. 1974. Analysis and comparison of flavor constituents in aqueous smoke condensates from various woods. Agric Biol Chem. 38:45–52.
- Giordano L, Calabrese R, Davoli E, Rotilio D. 2003. Quantitative analysis of 2-furfural and 5-methylfurfural in different Italian vinegars by headspace solid-phase microextraction coupled to gas chromatography–mass spectrometry using isotope dilution. J Chromatogr A. 1017:141–149.
- Guillen M, Ibargoitia M, Sopelana P, Palencia G. 2004. Components detected by headspace-solid phase microextraction in artisanal fresh goat’s cheese smoked using dry prickly pear (Opuntia ficus indica). Le Lait. 84:385–397.
- Guillen MD, Ibargoitia ML. 1999. Influence of the moisture content on the composition of the liquid smoke produced in the pyrolysis process of Fagus sylvatica L. Wood J Agric Food Chem. 47:4126–4136.
- Guillén MD, Ibargoitia ML. 1998. New components with potential antioxidant and organoleptic properties, detected for the first time in liquid smoke flavoring preparations. J Agric Food Chem. 46:1276–1285.
- Guillen MD, Manzanos MJ. 1997. Characterization of the components of a salty smoke flavouring preparation. Food Chem. 58:97–102.
- Guillen MD, Manzanos MJ. 1999. Smoke and liquid smoke: study of an aqueous smoke flavouring from the aromatic plant Thymus vulgaris L. J Sci Food Agric. 79:1267–1274.
- Guillén MD, Manzanos MJ. 2002. Study of the volatile composition of an aqueous oak smoke preparation. Food Chem. 79:283–292.
- Guillen MD, Manzanos MJ, Zabala L. 1995. Study of a commercial liquid smoke flavoring by means of gas chromatography/mass spectrometry and fourier transform infrared spectroscopy. J Agric Food Chem. 43:463–468.
- Kim K, Kurata T, Fujimaki M. 1974. Identification of flavor constituents in carbonyl, non-carbonyl, neutral and basic fractions of aqueous smoke condensates. Agric Biol Chem. 38:53–63.
- Kostyra E, Barylko-Pikielna N. 2006. Volatiles composition and flavour profile identity of smoke flavourings. Food Qual Prefer. 17:85–95.
- Maga J, Chen Z. 1985. Pyrazine composition of wood smoke as influenced by wood source and smoke generation variables. Flavour Fragr J. 1:37–42.
- Maga JA. 1987. The flavor chemistry of wood smoke. Food Rev Int. 3:139–183.
- Miler KBM, Sikorski ZE. 1990. Smoking. In: Sikorski ZE, Editor. Seafood: resources, nutritional composition, and preservation. Boca Raton, FL: CRC Press; p. 163–180.
- Millán E, Pawliszyn J. 2000. Determination of butyltin species in water and sediment by solid-phase microextraction–gas chromatography–flame ionization detection. J Chromatogr A. 873:63–71.
- Nie Y, Kleine-Benne E 2012. Determining phenolic compounds in whisky using direct large volume injection and stir bar sorptive extraction. Gerstel GmbH & Co. KG, Application Note, AN/2012/02, 1–12.
- Passeport E, Guenne A, Culhaoglu T, Moreau S, Bouyé JM, Tournebize J. 2010. Design of experiments and detailed uncertainty analysis to develop and validate a solid-phase microextraction/gas chromatography–mass spectrometry method for the simultaneous analysis of 16 pesticides in water. J Chromatogr A. 1217:5317–5327.
- Regulation (EC) No 2065/2003 of the European Parliament and of the Council of 10 November 2003 on smoke flavourings used or intended for use in or on foods. 2003. Off J Eur Union. L 309:1–8.
- Regulation (EU) No 1321/2013 of 10 December 2013 establishing the Union list of authorised smoke flavouring primary products for use as such in or on foods and/or for the production of derived smoke flavourings. 2013. Off J Eur Union. 333:54–67.
- Risticevic S, Carasek E, Pawliszyn J. 2008. Headspace solid-phase microextraction-gas chromatographic-time-of-flight mass spectrometric methodology for geographical origin verification of coffee. Anal Chim Acta. 617:72–84.
- Segovia-Martínez L, Bouzas-Blanco A, Campíns-Falcó P, Seco-Torrecillas A. 2010. Improving detection limits for organotin compounds in several matrix water samples by derivatization-headspace-solid-phase microextraction and GC-MS. Talanta. 80:1888–1893.
- Serot T, Varlet V, Cardinal M, Knockaert C, Prost C. 2007. Olfactometric determination of the most potent odoractive compounds in salmon muscle (Salmo salar) smoked by using four smoke generation techniques. J Agric Food Chem. 55:4518–4525.
- Setkova L, Risticevic S, Pawliszyn J. 2007. Rapid headspace solid-phase microextraction-gas chromatographic-time-of-flight mass spectrometric method for qualitative profiling of ice wine volatile fraction. II: classification of Canadian and Czech ice wines using statistical evaluation of the data. J Chromatogr A. 1147:224–240.
- Simon R, De La Calle B, Palme S, Meier D, Anklam E. 2005. Composition and analysis of liquid smoke flavouring primary products. J Sep Sci. 28:871–882.
- Soldera S, Sebastianutto N, Bortolomeazzi R. 2008. Composition of phenolic compounds and antioxidant activity of commercial aqueous smoke flavorings. J Agric Food Chem. 56:2727–2734.
- Suñen E, Aristimuño C, Fernandez-Galian B. 2003. Activity of smoke wood condensates against Aeromonas hydrophila and Listeria monocytogenes in vacuum-packaged, cold-smoked rainbow trout stored at 4°C. Food Res Int. 36:111–116.
- Tzollas NM, Zachariadis GA. 2010. Speciation of inorganic and tetramethyltin by headspace solid-phase microextraction and gas chromatography-mass spectrometry. J Sep Sci. 33:1610–1616.
- Varlet V, Prost C, Serot T. 2007. Volatile aldehydes in smoked fish: analysis methods, occurence and mechanisms of formation. Food Chem. 105:1536–1556.
- Yi-Min W, Zeng-Li Z, Hai-Bin L, Fang H. 2009. Low temperature pyrolysis characteristics of major components of biomass. J Fuel Chem Technol. 37:427–432.