
 ?Mathematical formulae have been encoded as MathML and are displayed in this HTML version using MathJax in order to improve their display. Uncheck the box to turn MathJax off. This feature requires Javascript. Click on a formula to zoom.
ABSTRACT
Due to the proven carcinogenicity of Sudan III and IV dyes, they are considered global public health issues. They are banned in all forms as food colourants. We propose the monitoring of simple and easy-to-measure optical properties of palm oils, such as the refractive indices and spectrophotometric properties, as efficient indicators to detect adulteration. Coupling these results with principal component analysis, excess refractive index, and integration of transmittance introduces a novel detection tool for the authentication of edible palm oil. This opens a new opportunity for accurate handheld devices to detect adulteration and provide control in the field. This work assessed in total of 49 samples, some collected from different parts of Ghana and others, in-house adulterated samples. The Ghana Food and Drugs Authority, who performed a complex and expensive chemical analysis of the samples, confirmed our results with good agreement.
Graphical abstract
Introduction
Vegetable oil is a basic source of lipids, which are a fundamental and necessary component of humans’ nutrition. It is a key vector for vitamins absorption and obviously an important source of energy. One example of vegetable oil is palm oil which is the most widely consumed and utilised vegetable oil globally. (Siddique et al. Citation2010; Zhang et al. Citation2014)
Palm oil is a reddish-to-yellowish, and highly nutritious dietary oil produced from the pulp of the fruits of the oil palm tree. Originally, palm oil was produced in low lying and wet tropical West African regional countries such as Ghana, Nigeria, and Côte d’Ivoire (Ofusu-Budu and Sarprong Citation2013). Production is now primarily in Asian countries, with Indonesia and Malaysia leading world production and markets (van Duijn Citation2013). Palm oil from West Africa is widely considered as one of the best due to high levels of beta-carotene present in palm oils from this region compared to those from other regions of the world. In Ghana, the production of palm oil is mainly on a small scale with a few large-scale factories. The use of mechanisation is the main difference between the small and large-scale manufacturing process (EC/FVO Citation2005). Palm oil is replacing other vegetable oils in the majority of ready-to-eat foods as a basic ingredient, this is mainly due to its low cost, easy de-colourisation and its ability to withstand higher temperatures (Jiménez-Carvelo et al. Citation2017). In order to meet the ever-increasing demands, some producers have resorted to the use of banned or illegal dyes to enhance the colour of palm oil. Sudan III and Sudan IV dyes are two known principal illegal enhancers (EC/FVO Citation2005).
Sudan III and IV dyes are reddish lipophilic azo-dyes used for colouring industrial products such as tiles, polish, and paints (Lohumi et al. Citation2015). They have similar molecular structures but with an additional two methyl groups in Sudan IV a more intense colour is observed (Green Citation1990). All Sudan dyes are banned as food colourants because of their recognised carcinogenicity (Rebane et al. Citation2010). Some dishonest people, however, continue to use them in enhancing the colour of palm oil and other food especially in developing countries (Sciuto et al. Citation2017; Lohumi et al. Citation2017). Therefore, there is a need to authenticate and detect adulteration in these oils, as it is a public health and consumer confidence issue in such an economically important industry.
An extensive literature is available on authenticating and detecting Sudan III and IV adulterants in palm oils (Marikkar et al. Citation2002; Botek et al. Citation2007; Chailapakul et al. Citation2008; Rohman and Man Citation2009; Rohman et al. Citation2010; Andoh et al. Citation2019). Most of these methods used to detect adulteration are based on the study of the physical, chemical and/or other properties of the oil. Conventional methods used include gas chromatography (Hilali et al. Citation2007), high-performance liquid chromatography (Cunha and Oliveira Citation2006), and gas chromatography-mass spectrometry (Zhu et al. Citation2017). These techniques have proven to be vital tools in authenticating and determining adulteration in palm oils. They are reproducible, and have good detection limits. However, these methods have some serious setbacks, i.e. they are time-consuming, expensive, tedious, and require a high level of expertise in operation (Cheung et al. Citation2010). A low-cost, fast and efficient pre-screening technique is urgently needed, especially, for in-the-field investigations.
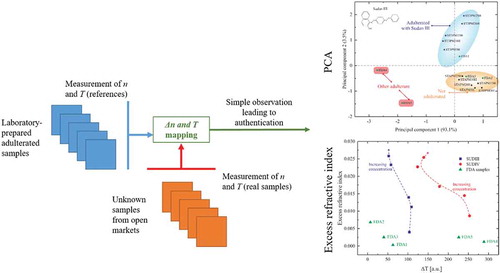
In this work, we report investigations of using the refractive indices (RI) and spectrophotometric properties of some palm oil samples for their authentication and detection of Sudan dyes. The inherent chemical properties variation originating from the adulteration of the oil samples led us to use chemometrics analysis tools (Kumar et al. Citation2014) to exploit the data from the transmission spectra in addition to basic refractive index observations. The analysis is performed by the combination of the excess refractive index (nE), difference of transmission (ΔT), and principal component analysis (PCA). With our method, it is possible to distinguish adulterated palm oils from unadulterated ones. We consider that this method, used for the first time in food analysis, opens new possibilities for discriminatory applications in many other mixtures and can be implemented in handheld devices to be used in field measurement conditions.
Materials and methods
Reagent
Sudan III (68562-25MG) and Sudan IV (67386-25MG) were purchased from Sigma-Aldrich (St Louis, Missouri, USA) and used as adulterants for the palm oil. Stock solutions of 1 mM in acetone of both dyes were prepared and used in making the in-house adulterated palm oil samples. These two solutions are referred as SUDIII and SUDIV for the Sudan III and Sudan IV-based solutions, respectively. We refer to the pure powder dyes as SIII and SIV.
Samples
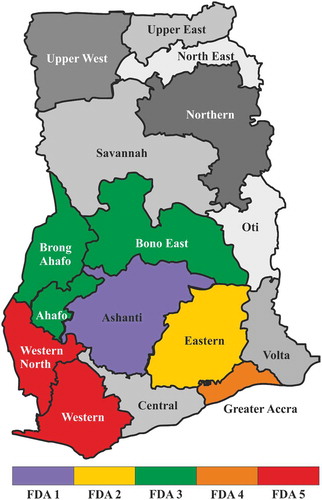
The Ghana Food and Drugs Authority (FDA-Ghana) through the Food Physio-Chemical Laboratories provided 39 palm oil samples for use in this study. These palm oil samples were indicated to be coming from different parts of Ghana, see . These parts of Ghana are considered as the main palm oil-producing regions of Ghana. Three of the palm oil samples were indicated as unadulterated by FDA-Ghana and were labelled as standard palm oil (STDPO). They were used as a reference in our study. We mixed this authentic palm oil in ratios 5–25% of SUDIII to prepare the in-house adulterated palm oil samples, with known concentration of adulterant. These samples are labelled as ST3POi, with i = 5, 10, 15, 20, and 25 indicating the volume fraction, f of dye added. Identical samples were prepared with SUDIV and labelled ST4POi. In mass, the concentrations of pure Sudan dyes varied from 0.0022 %wt to 0.014 %wt for SIII and 0.0024 %wt and 0.015 %wt for SIV. We grouped the other 36 samples depending on their origin and labelled them as FDA1 to 5 (see ). Due to the semi-solid nature of palm oil at room temperatures, the samples were heated up in a water bath to 45 ± 2°C prior to each measurement. Measurement temperature is a subject of change in the field conditions and due to thermo-optic properties of the samples, it causes changes in both RI and transmittance. However, there are temperature-compensated commercial Abbe refractometers hence temperature dependence of RI is not an issue.
Figure 1. Administrative map of Ghana and its sixteen different regions. The indicated coloured regions represent the ones where the samples were collected.
Instrumentation
The refractive indices of all the samples were measured using a J57WR-S2 Abbe refractometer (Rudolph Research Analytical, USA, 2013) with an accuracy of ± 0.0001 at wavelength, λ of 589 nm. To avoid sample contamination between measurements, the sample stage was cleaned thoroughly with acetone in-between measurements.
The transmission spectra of the samples were obtained with a Perkin Elmer Lambda 9 UV/VIS/NIR spectrophotometer, with a quartz cuvette having an optical path length of 10 mm, at optimum laboratory conditions. The spectra are obtained over the wavelength range 400 nm < λ < 2500 nm.
Data analysis with excess refractive index estimation
We performed an analysis of the different transmission spectra and refractive indices of the samples in order to extract the excess refractive index (). This value is linked to excess permittivity, i.e. a classical tool in chemical analysis that is more directly accessible in the field, which is important in the case of handheld devices. The standard unadulterated palm oil, STDPO is used as a reference.
First, the refractive indices () of STDPO and the samples adulterated with the Sudan dyes (ST3POi, and ST4POi) were measured using the Abbe refractometer. All refractive indices measurements were performed at the same wavelength, λ of 589 nm. Considering a perfect binary system in which the two compounds are ideally mixed, the refractive indices (
) can be estimated as
, where
is the refractive index of the adulterant (SUDIII and SUDIV),
is the refractive index of the standard palm oil, and
is the volume fraction of the dye in the palm oil.
By substituting the value of the ideal refractive indices (see Table S1, in the supplementary materials), we obtained the excess refractive index of each mixture: . Comparing the RI of the FDA samples with
and the refractive indices of the prepared adulterated samples, reported on the same graph, allowed the first identification of adulteration of the samples.
Data analysis with difference of transmission
A direct observation of the transmission spectra can give a hint on the nature of the sample but not enough information for precise screening of the samples. We propose to integrate the area of the spectra over the wavelength range 400 nm < λ < 1750 nm to obtain an absolute value T. For each sample, we subtracted the absolute value from the value obtained for the reference sample STDPO, to obtain ΔT. The procedure was repeated with the FDA samples. This enabled us to obtain a second reading for the quality of the market samples.
Data analysis with principal component analysis (PCA)
PCA is a well-known technique of data representation used for analysing complex and heavy datasets (Hu et al. Citation2015) and it has also found applications in adulteration detection (Dourtoglou et al. Citation2003; Yu et al. Citation2007). It was used, here, in the establishing of the authenticity of the samples by creating a map of adulteration (using the known adulterated samples) and to estimate the degree of adulteration in the edible palm oil samples collected by the FDA-Ghana from the different indicated regions. The PCA was done using Unscrambler X v 10.5 (CAMO ASA, Oslo, Norway) software and verified with Origin Pro 2019.
Results and discussion
We demonstrate the influence of the adulterants, Sudan III and Sudan IV, on the refractive index and spectrophotometric properties of the palm oil samples. Spectrophotometric measurements and PCA classification are combined to produce a reliable and innovative tool for authentication of palm oil. The objective is to determine the degree of adulteration of commercial palm oil products collected from different parts of Ghana with the help of FDA-Ghana. It is important to know the origin of the palm oil since the manufacturing processes and scales differ from a region to another. In the Brong Ahafo region (sample set FDA3), the production is usually done on a small scale and can be nearly considered as prepared by hand. In the Ashanti, Eastern, and Western regions (FDA1, FDA2, and FDA5, respectively) large-scale manufacturing processes are used. The Greater Accra region (FDA4) is likely to be the region with most variations in the measured parameters of the studied palm oil samples since the origin of the products is difficult to track.
Refractive index measurements
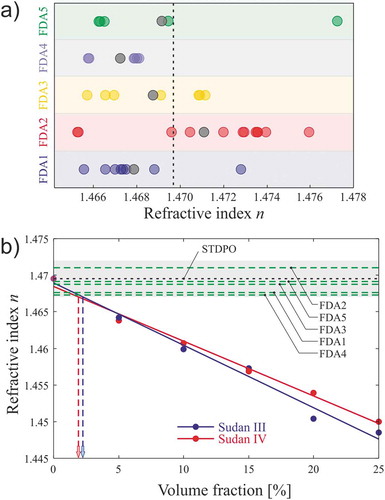
We first measured the refractive indices of the samples supplied by the Food and Drugs Authority, Ghana (FDA1 to 5). From the 36 samples, we obtained the distribution of refractive index for each sample group, see ). From these results, we calculated an average value of the refractive index per region, as well as the uncertainty. Table S2 of the supplementary materials summarises these results. A first conclusion to be drawn is the significant differences in the root mean square values (proportional to the uncertainty) proving the disparity of the oils, mainly due to the fabrication processes. From each region, we selected one sample (with a refractive index approaching the average of the indicated region) to be studied in the rest of the work. To identify the degree of adulteration of each sample, we created a map resulting from the study of prepared adulterated samples by spiking adulterant in standard authentic palm oil (ST3POi and ST4POi).
Figure 2. Refractive index first analysis of Ghanaian palm oil samples. (a) Distribution of the refractive index for the samples collected in the indicated regions of Ghana. The grey dots represent the average refractive index of each set and the black dashed line is the refractive index of standard palm oil referred as STDPO. (b) Refractive index of the prepared adulterated palm oil samples by spiking Sudan dyes solution in STDPO (ST3POi in blue and ST4POi in red). All measurements have been done with an Abbe refractometer at λ = 589 nm. The green dashed lines represent the average refractive indices for FDA sample sets. The black dashed line is the refractive index of standard palm oil referred as STDPO. The grey-shaded area corresponds to refractive index of the STDPO, ) where σ is the standard deviation of the measurement.
Spiking an authentic sample with another constituent (Sudan dyes III and IV, in our case) obviously alters the physical, chemical, optical, and other characteristics of the original palm oil. Optical properties such as refractive index and transmittance of the mixture can be used for classification and subsequent detection of adulteration of the authentic product (Reis et al. Citation2009; Iglesias and Reis Citation2016; Kanyathare and Peiponen Citation2018b). The degree and nature of change in these optical properties invariably depend on the amounts of each constituent, i.e. the concentrations or volume fractions of each component (Mehra Citation2003; Kanyathare and Peiponen Citation2018b).
The results of the refractive index as a function of the volume fraction of dye in oil are reported in ). It shows the refractive indices of the authentic palm oil (STDPO) indicated with a black dashed line and the prepared adulterated samples ST3POi and ST4POi with SUDIII and SUDIV respectively.
The refractive indices of the prepared adulterated palm oil samples range, as expected, between the refractive index of the standard palm oil and that of the Sudan dyes (III and IV) stock-based solutions. The refractive index change is in the second-order decimal, which is large and clearly detectable. The variation of refractive index is about 8.5 × 10⁻⁴ and 7.8 × 10⁻⁴ RIU/% for SUDIII and SUDIV, respectively. We observe a linear decrease in the refractive index with an increase in the volume fraction of the adulterant (Sudan III and IV). This linearity holds for both SUDIII and SUDIV volume fraction adulteration of the authentic palm oil, with a correlation coefficient of 0.9921 and 0.9954, respectively.
The RI measurements of the 49 samples indicate a great disparity among the studied palm oils sample in the regions. In addition to any possible adulteration, we have also to consider any change in the fabrication recipe, or simply in the fruits used as base material for the oil. Therefore, we use the average standard deviation (σ) over all the samples as an indicator. The grey shaded zone around the STDPO value shows the refractive indices corresponding to . One can first see that most of the samples studied here are within this limit. On purpose, the chosen samples are close to the standard palm oil, to assess the limit of our methodology. The intersection of the shaded zone and the linear regression of SUDIII and SUDIV give us the threshold after which we can consider, without any doubt, the sample as adulterated. This threshold is determined from ) to be 2.24% and 1.9%, in fraction volume for SUDIII and SUDIV, respectively
Overall, the refractive indices of the samples from various markets are very close to the ones of the standard palm oil certified as unadulterated by the FDA. It becomes clear that a simple measure of the refractive index is not sufficient to affirm palm oil adulteration by the Sudan dyes. This variation of refractive index may also come from the different β-carotene levels that result due to the different environmental conditions as well as the fabrication methods of the different regions.
Spectrophotometric measurements
shows the transmission spectra of the authentic palm oil (STDPO), the solutions of Sudan III dye (SUDIII) and Sudan IV dye (SUDIV) in acetone, acetone, and one example (for each dye) of adulterated palm oil sample (ST3PO20 and ST4PO20). The transmission spectra of all the other prepared adulterated samples are given in Figure S1 of supplementary materials.
Figure 3. VIS-NIR transmission spectra of the standard palm oil (STDPO, black curve), the Sudan III and Sudan IV dyes in solution in acetone (SUDIII and SUDIV, respectively, purple and yellow curves), acetone (green curve), one of the prepared adulterated samples with SUDIII (ST3PO20, red curve) and with SUDIV (ST4PO20, blue curve), as examples. The shaded grey zone represents the wavelength range used for the PCA and difference of transmission.
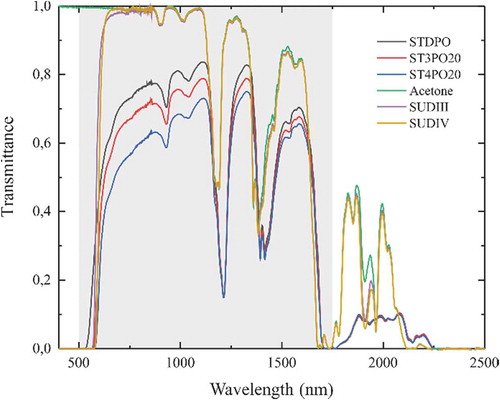
All spectra have a similar shape with three distinct absorption bands at λ ~ 1200 nm, λ ~ 1400 nm, and λ ~ 1700 nm. However, a first observation is the overall higher transmission through SUDIII and SUDIV compared to the oil samples, which can be explained by the translucence of the mixture. Acetone does not absorb in the visible range of the electromagnetic spectrum unlike palm oil. One can also remark a bending of the spectra in the visible part of the adulterated palm oil sample. The near-infrared part of the spectra is drastically different for the prepared samples than for acetone, SUDIII, and SUDIV. One can first think about an effect of acetone, which is however present in the spiked samples, without a so large increase of the transmission in the near-infrared. This huge drop in the peaks corresponds obviously to a chemical activity between the dyes and the oil. Nevertheless, no evident trend can be observed even in the near-infrared region: transmission first drops with the amount of dye and then increases again. This is clear in Figure S1 of the supplementary materials. One can see that there is no linear dependence of the adulterated samples on the volume fraction of SUD III and IV. ST3PO15 and ST3PO25 spectra present a higher transmission than for the 5% and 20% adulteration samples. The transmission for 10% adulteration is below all the others. A similar behaviour is observed for the Sudan IV adulterated samples. Transmission for ST4PO5, ST4PO15, and ST4PO20 curves are lower than for ST4PO25. ST4PO10 presents again the lowest transmission curve. Such a behaviour is another form of chemical activity of the liquid mixture and shows an excess property in transmittance such as the excess refractive index.
We also measured the transmission spectra of the FDA samples and the results are detailed in Figure S2 of the supplementary materials. We observe the same drop in transmission in the near-infrared region and again no relevant conclusions can be drawn directly from the observation of these spectra. It is important to note here, that even if the adulterated samples are prepared with dyes in acetone, which is not the case for FDA samples, there is no clear effect of the presence of acetone in the mixtures, observable on the spectra, especially after heat treatment for 1.5 h.
In conclusion, from the data above, a simple study of the refractive index and the transmittance shows they are insufficient parameters to discriminate between adulterated and authentic oils. We, therefore, propose the combination of the excess refractive index and the difference in the integrated transmission as a novel detection tool.
Excess refractive index and difference of transmission
The excess refractive index is an efficient indicator of reactivity of two compounds mixed together. (Mehra Citation2003; Reis et al. Citation2009; Iglesias and Reis Citation2016; Kanyathare and Peiponen Citation2018b). By monitoring this value for a binary system as a function of the volume fraction, one can estimate the affinity, i.e. the reactivity, of the molecules. Few studies have been carried out using such a method as an anti-counterfeiting technique. (Kanyathare and Peiponen Citation2018a, Citation2018b). For the first time, we apply it in liquid food adulteration detection.
Results are presented as blue curves and dots in for all spiked samples with Sudan III and Sudan IV solutions. Note that the curves represent only the trend of the excess refractive index and have no other physical or mathematical meaning. Only the dots represent the measured data.
Figure 4. Analysis of the excess refractive index. All values are compared to the reference sample STDPO. The dashed lines are the values for FDA samples. Results are presented for the samples before and after heat treatment with both adulterant solutions: SUDIII picked samples before and after heat treatment in black and red, respectively. SUDIII picked samples before and after heat treatment in blue and green, respectively.
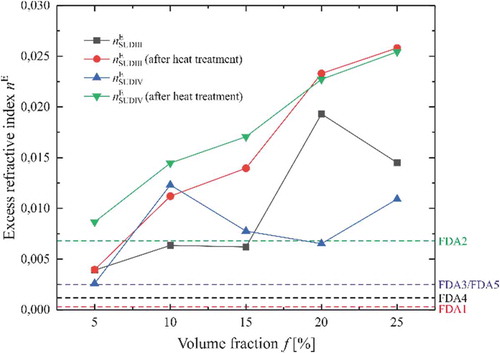
As already noted, the acetone may modify the chemical reactivity of the dye with the oil, although no drastic change in the spectra of FDA and prepared samples were observed. Since there is no acetone in the samples provided by the FDA, it is important to consider this effect. It is clear with the excess refractive index that heating the samples to remove the excess of acetone is needed. The curves in are observed to be changing to monotonic after the heat treatment.
One can clearly see the monotonous and nearly linear increase of . This increase is more visible (higher slope) for Sudan III-based mixture than for SUDIV. This may come from the delocalisation of the electrons inside the molecules of Sudan III, which is more important than for Sudan IV, where two additional methyl groups block the reactivity and increase the volume of the molecule itself. The high values of excess refractive index show that the H-bonds of the molecules inside the mixtures change revealing the interaction of the dye with the oil chain. In case of Sudan III, the hydroxyl group should be more active and the smaller molecule can reach easily the long saturated chain of the oil. Since the excess RI is obtained at λ = 589 nm, the reason for the different values is due to the higher interaction with the electron systems in the liquid. This was chosen to avoid the effect of acetone in the samples.
Considering the refractive index of the standard grade palm oil as a reference, we have determined the difference with the samples provided by the FDA and reported them in as dashed horizontal lines. It is clear that FDA 1 and 4 are very close to the standard values, while FDA 3 and 5 seem adulterated while FDA 2 shows a huge excess corresponding to a high volume of both dyes. However, a variation of excess refractive index may arise from several reasons. Palm oil is a complex liquid including different natural chemicals, such as β-carotene, and many other components. Whatsoever, demonstrates that different samples are well resolved, a fact that may not be so evident from, but dependent on, ).
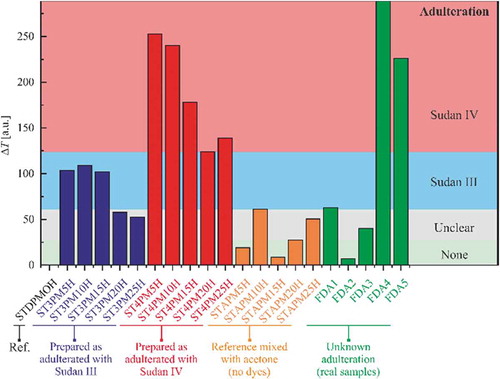
The excess permittivity is usually preferred as an indicator. However, the refractive index is a directly available measurable quantity and it can be accompanied by the transmittance measurements related to the absorption coefficient. After measuring the spectra, we calculated the difference of transmission between the samples and the reference by integrating the signals on the wavelength range where acetone has practically no influence. The results are presented in in blue for Sudan III-based mixtures and in red for Sudan IV-based samples. In both cases, one can observe the same trend. Reporting the values obtained for FDA samples, one can refine our conclusions on the adulteration of collected samples. FDA 2, 3, and 1 are this time the closest to the original oil. FDA 5 can now be clearly discriminated from FDA 3. FDA 4 is clearly adulterated, according to this method of detection.
Figure 5. Analysis of the difference of transmission for SUDIII (blue bars) and SUDIV (red bars) adulterated samples. FDA samples are shown with green bars. Standard palm oil with acetone only at different volume is shown in orange. By monitoring the amplitude of the bars and comparing to the reference samples, one can estimate what is the adulterant.
Principal component analysis
The PCA allows for a deeper and qualitative examination of the differences between authentic and adulterated palm oil samples. It also requires a multivariate analysis engine, which is more difficult to implement in handheld devices. By mapping in a two-dimensional plane representing the eigenvalues of the samples extracted from the transmission spectra, one can select the FDA samples as a function of their potential adulteration. This opens doors for the possibility of applying advanced multivariate analytical techniques, which can be used to create models for future predictions of palm oil adulteration or classification of different palm oil groups. Furthermore, it produces linear combinations of variables that are useful descriptors and predictors of some underlying structure in the data matrix. Moreover, PCA allows extraction of mostly useful information from the data table through dimensionality reduction while allowing discrimination of noise and outliers. In comparison with both refractive index and transmittance data, PCA offers a relevant alternative in terms of precision and comparison, which enables discrimination of pure from adulterated samples with high confidence. We made principal component analysis for data given in and Figures S1 and S2 of the supplementary materials.
Results are presented in . ) is the PCA result corresponding to the Sudan III dye (ST3POi, after heat treatment) together with STDPO and the five solutions of the pure palm oil mixed with acetone and post-heated, and the five FDA samples. ) is the equivalent for SUDIV. For both, we removed the SUDIII and SUDIV solutions from the analysis, which are mainly composed of acetone and considerably change the results of PCA. The values of the principal components (PC1 = 93.1% ≫ PC2 = 3.5%) demonstrate that the spectra change between the different samples we have analysed is rather small. However, the tiny differences in terms of shift or intensity allow us to see a clear trend by looking at the scores of the PCA and how we can group them. The high values of PC1 allow a very good confidence on the conclusion to be drawn from the PCA results.
Figure 6. Principal component analysis. PCA scores plots of authentic palm oil and the different preparation with SUDIII (ST3PMiH), SUDIV (ST4PMiH), and acetone (STAPMiH), and the FDA palm oil samples: (a) adulteration with Sudan III and (b) adulteration with Sudan IV. Insets are the skeletal formula of the Sudan dyes.
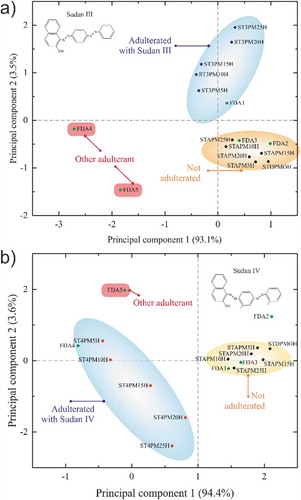
One can first remark that the set of palm oil with different volume fraction of acetone is all in the same quadrant, which is an indicator of the validity of the model. This yellow ellipse group is our reference for non-adulterated palm oil. On the opposite quadrants, one can see the results for the ST3POi and ST4POi samples and note that the higher the concentration in adulterant, the farther the result from the origin. This indicates a greater variation from the authentic palm oil sample. The blue ellipse represents the adulterated group. From the PCA results, one can observe a similar distribution of the scores for Sudan III and Sudan IV. This is in perfect accordance with our expectations, since opposite quadrants represent opposite behaviours.
The results for the FDA samples are represented by green dots. One can see that FDA3 is, in both cases, within the authentic palm oil group. For the others, the interpretation is more complex.
Conclusion
This study is of utmost importance in the fight against adulteration of liquid foods and in food analysis in general, especially in developing countries such as Ghana. The problem we were facing in this article deals with the fact that natural products behave in different manners depending upon the region they come from. This is obviously a problem and one must be extremely careful while affirming that a product is adulterated. This is as much an economical and a public health issue as it is a societal problem. On the other hand, it is also an ethical issue as the hue enhancers, such as Sudan dyes of this study, that give a more appealing hue to palm oil are carcinogenic. The method we proposed is simple and allows only a qualitative estimation of adulteration. This method thus is a rapid detection test for adulteration. When a positive result is recorded, a more sophisticated method, such as HPLC and others must be employed to ascertain the level of adulteration or otherwise of the sample, which may turn out to be false positive. This method thus, saves time, energy and resources by eliminating sample preparation completely and promising on-the-spot results.
We have described here two methods. One is principal component analysis, which is conventional and has already demonstrated its power in other food adulteration analysis (Arvanitoyannis et al. Citation1999; McCann et al. Citation2001; Ahmadi et al. Citation2019). The PCA results lead to the following conclusions. FDA1 is clearly adulterated by Sudan III, but not by Sudan IV. FDA2 is not adulterated with Sudan III but the result for Sudan IV is unclear since it does not belong to any group. It may result from the presence of foreign material(s) different from Sudan dyes III and IV. FDA4 is adulterated by Sudan IV but the result with Sudan III shows that FDA5 may be modified by another chemical. Results for FDA5 are far from all groups in both cases. It tends to indicate that in addition to an adulteration by Sudan dyes, there is potentially another modification of the composition of the oil compared to the authentic one. Finally, our method states that FDA3 is not adulterated at all, although we know from Ghana authorities, that all the samples are adulterated by either SUDIII or SUDIV.
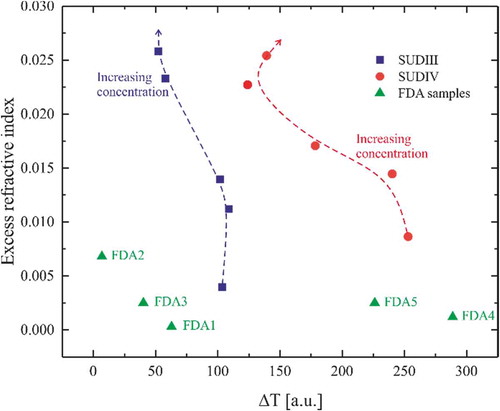
Secondly, our method of detection is novel and relies on the simple measurements of refractive index and transmittance of the oil. With the advent of numerous handheld refractive index measurement devices available, in-the-field measurements and simple analysis performed with a smartphone, for instance, are a matter of when and not if. From , we can draw conclusions on the results obtained for the excess refractive index and the difference of integrated transmission. This map shows clear regions for which the samples are adulterated by Sudan III or Sudan IV. The proposed nE-ΔT mapping method gives similar results to the improved PCA method. The validity of the result of the nE-ΔT mapping is determined by the precision of the map itself. We mentioned that according to the origin of the fruits used for the manufacturing of the palm oil, the refractive index might change. Refining the map requires a higher number of samples coming from a smaller region. This would allow screening the adulteration of palm oil in one city, for instance, with a much higher confidence, very quickly, and without any sample preparation or know-how in physics and chemistry.
Figure 7. nE-ΔT map. Graphical representation of the excess refractive index and difference of transmission. In green are the FDA samples collected from the market in Ghana. In blue are the prepared solutions adulterated with SUDIII. In red are the prepared solutions adulterated with SUDIV.
The method may produce some false positive and false negative results but is very fast and can be implemented in portable devices. Our method can easily be optimised by reducing the number of regions and thus increasing the resolution of the measurements by reducing the difference between the compositions of the samples. Moreover, we can use cloud services and machine learning algorithms to make the method more and more efficient. Currently, our technique allows a fast screening of a large set of samples. Only the samples with unclear reading have to be tested in the laboratory.
Declaration of interest statement
The authors declare no competing interests.
Supplemental Material
Download MS Word (495 KB)Acknowledgments
The authors would like to thank Dr Marti Mäkinen and Dr Sari Suvanto for their assistance and support during measurements. The work is part of the Academy of Finland Flagship Programme, Photonics Research and Innovation (PREIN), decision 320166. Business Finland also supports this work through the ChemiReader project (2387/31/2017).
Supplementary material
Supplemental data for this article can be accessed on the publisher’s website.
Additional information
Funding
References
- Ahmadi S, Mani-Varnosfaderani A, Habibi B. 2019. Characterization of binary edible oil blends using color histograms and pattern recognition techniques. Anal Bioanal Chem Res. 6:111–124.
- Andoh SS, Nuutinen T, Mingle C, Roussey M. 2019. Qualitative analysis of Sudan IV in edible palm oil. J Eur Opt Soc Publ. 15.
- Arvanitoyannis IS, Katsota MN, Psarra EP, Soufleros EH, Kallithraka S. 1999. Application of quality control methods for assessing wine authenticity: use of multivariate analysis (chemometrics). Trends Food Sci Technol. 10:321–336.
- Botek P, Poustka J, Hajšlová J. 2007. Determination of banned dyes in spices by liquid chromatography-mass spectrometry. Czech J Food Sci. 25:17–24.
- Chailapakul O, Wonsawat W, Siangproh W, Grudpan K, Zhao Y, Zhu Z. 2008. Analysis of sudan I, sudan II, sudan III, and sudan IV in food by HPLC with electrochemical detection: comparison of glassy carbon electrode with carbon nanotube-ionic liquid gel modified electrode. Food Chem. 109:876–882.
- Cheung W, Shadi IT, Xu Y, Goodacre R. 2010. Quantitative analysis of the banned food dye sudan-1 using surface enhanced raman scattering with multivariate chemometrics. J Phys Chem C. 114:7285–7290.
- Cunha SC, Oliveira MBPP. 2006. Discrimination of vegetable oils by triacylglycerols evaluation of profile using HPLC/ELSD. Food Chem. 95:518–524.
- Dourtoglou VG, Dourtoglou T, Antonopoulos A, Stefanou E, Lalas S, Poulos C. 2003. Detection of olive oil adulteration using principal component analysis applied on total and regio FA content. JAOCS J Am Oil Chem Soc. 80:203–208.
- [EC/FVO] European Commission/Food and Veterinary Office. 2005. Assess the control systems in place for Sudan dyes adulteration in palm oil [Internet]. http://www.ec.europa.eu/food/fvo/act_getPDF.cfm?PDF_ID=4810.
- Green FJ. 1990. The Sigma-Aldrich Handbook of stains, dyes and indicators. Milwaukee (WI): Aldrich Chem Co, Inc; p. 103–104.
- Hilali M, Charrouf Z, Soulhi AEA, Hachimi L, Guillaume D. 2007. Detection of argan oil adulteration using quantitative campesterol GC-analysis. JAOCS J Am Oil Chem Soc. 84:761–764.
- Hu Y, Feng S, Gao F, Li-Chan ECY, Grant E, Lu X. 2015. Detection of melamine in milk using molecularly imprinted polymers-surface enhanced Raman spectroscopy. Food Chem. 176:123–129.
- Iglesias TP, Reis JCR. 2016. On the definition of the excess permittivity of a fluid mixture. III: dependence on frequency. J Chem Thermodyn. 96:208–209.
- Jiménez-Carvelo AM, González-Casado A, Cuadros-Rodríguez L. 2017. A new analytical method for quantification of olive and palm oil in blends with other vegetable edible oils based on the chromatographic fingerprints from the methyl-transesterified fraction. Talanta. 164:540–547.
- Kanyathare B, Peiponen KE. 2018a. Hand-held refractometer-based measurement and excess permittivity analysis method for detection of diesel oils adulterated by Kerosene in field conditions. Sensors (Switzerland). 18:1551.
- Kanyathare B, Peiponen K-E. 2018b. Wavelength-dependent excess permittivity as indicator of kerosene in diesel oil. Appl Opt. 57:2997.
- Kumar N, Bansal A, Sarma GS, Rawal RK. 2014. Chemometrics tools used in analytical chemistry: an overview. Talanta. 123:186–199.
- Lohumi S, Joshi R, Kandpal LM, Lee H, Kim MS, Cho H, Mo C, Seo YW, Rahman A, Cho BK. 2017. Quantitative analysis of Sudan dye adulteration in paprika powder using FTIR spectroscopy. Food Addit Contam. 34:678–686.
- Lohumi S, Lee S, Lee H, Cho BK. 2015. A review of vibrational spectroscopic techniques for the detection of food authenticity and adulteration. Trends Food Sci Technol. 46:85–98.
- Marikkar JMN, Lai OM, Ghazali HM, Che Man YB. 2002. Compositional and thermal analysis of RBD palm oil adulterated with lipase-catalyzed interesterified lard. Food Chem. 76:249–258.
- McCann SE, Marshall JR, Brasure JR, Graham S, Freudenheim JL. 2001. Analysis of patterns of food intake in nutritional epidemiology: food classification in principal components analysis and the subsequent impact on estimates for endometrial cancer. Public Health Nutr. 4:989–997.
- Mehra R. 2003. Application of refractive index mixing rules in binary systems of hexadecane and heptadecane with n-alkanols at different temperatures. Proc Indian Acad Sci Chem Sci. 115:147–154.
- Ofusu-Budu K, Sarprong D. 2013. Oil palm industry growth in Africa: a value chain and smallholders’ study for Ghana. Rome.
- Rebane R, Leito I, Yurchenko S, Herodes K. 2010. A review of analytical techniques for determination of Sudan I-IV dyes in food matrixes. J Chromatogr A. 1217:2747–2757.
- Reis JCR, Iglesias TP, Douhéret G, Davis MI. 2009. The permittivity of thermodynamically ideal liquid mixtures and the excess relative permittivity of binary dielectrics. Phys Chem Chem Phys. 11:3977–3986.
- Rohman A, Che Man YB, Ismail A, Hashim P. 2010. Application of FTIR spectroscopy for the determination of virgin coconut oil in binary mixtures with olive oil and palm oil. JAOCS J Am Oil Chem Soc. 87:601–606.
- Rohman A, Man YBC. 2009. Monitoring of virgin coconut oil (VCO) adulteration with palm oil using Fourier transform infrared spectroscopy. J Food Lipids. 16:618–628.
- Sciuto S, Esposito G, Dell’Atti L, Guglielmetti C, Acutis PL, Martucci F. 2017. Rapid screening technique to identify Sudan dyes (I to IV) in adulterated tomato sauce, chilli powder, and palm oil by innovative high-resolution mass spectrometry. J Food Prot. 80:640–644.
- Siddique BM, Ahmad A, Ibrahim MH, Hena S, Rafatullahb M, Mohd OAK. 2010. Physico-chemical properties of blends of palm olein with other vegetable oils. Grasas y Aceites. 61:423–429.
- van Duijn G. 2013. Traceability of the palm oil supply chain. Lipid Technol. 25:15–18.
- Yu H, Wang J, Xu Y. 2007. Identification of adulterated milk using electronic nose. Sensors Mater. 19:275–285.
- Zhang L, Li P, Sun X, Wang X, Xu B, Wang X, Ma F, Zhang Q, Ding X. 2014. Classification and adulteration detection of vegetable oils based on fatty acid profiles. J Agric Food Chem. 62:8745–8751.
- Zhu W, Wang X, Chen L. 2017. Rapid detection of peanut oil adulteration using low-field nuclear magnetic resonance and chemometrics. Food Chem. 216:268–274.