
ABSTRACT
Per- and poly-fluorinated substances (PFASs) are man-made chemicals that have been used for a variety of applications and can end up in the food chain. New opinions on the risk assessment were recently published by the European Food Safety Authority, emphasising the need for more sensitive methods. From this, minimum required LOQs for the analytical method for analysis of milk and egg have been calculated for perfluorooctanoic acid (PFOA) and GenX (hexafluoropropylene oxide dimer acid, HFPO-DA). A fully validated method is described for analysis of 13 PFASs, including PFOA and HFPO-DA, in milk and egg. All compounds, except perfluorodecane sulphonate (PFDS), can be quantitatively determined in these matrices with a trueness ranging from 87% to 119% and a relative within-laboratory reproducibility between 12% and 41%. Also the method proved suitable for confirmation of the identity of the individual PFASs. The LOQ for HFPO-DA in milk and egg is 0.05 ng g−1, well below the calculated required LOQ. For PFOA in egg the determined LOQ is 0.025 ng g−1, nicely below the required level of 0.03 ng g−1. In milk the required LOQ was not achieved: 0.005 instead of 0.003 ng g−1. However, on six out of eight days an LOQ of 0.0025 ng g−1 was demonstrated. It is concluded that the required LOQs are achievable when instrument performance is optimal. The current method can be expanded with long chain PFASs by using a cellulose filter instead of the PTFE filter vials. The presented method was applied for a small-scale study in The Netherlands.
GRAPHICAL ABSTRACT
Introduction
Per- and poly-fluoroalkyl substances (PFASs) are man-made chemicals that have been used for a variety of applications (Buck et al. Citation2011). The unique physical and chemical properties of PFASs impart oil and water repellence, temperature resistance and friction reduction to a wide range of products. Due to their persistence and bioaccumulative and toxic (PBT) properties, some PFASs have been phased out by industry, e.g. perfluorooctanoic acid (PFOA) under the PFOA stewardship program established by the United States Environmental Protection Agency (United States Environmental Protection Agency Citation2015). Subsequently, a shift towards alternative PFASs with unknown toxicity and environmental fate was made, including hexafluoropropylene oxide-dimer acid (HFPO-DA), also referred to as GenX.
As there is global concern on the toxicity of PFASs, the European Commission asked European Food Safety Authority (EFSA) for a scientific evaluation on the risks to human health related to the presence of PFOA and perfluorooctane sulphonic acid (PFOS) in food (EFSA Panel on Contaminants in the Food Chain (CONTAM) Citation2018). The most important food products of animal origin that contribute to human exposure to PFOS are eggs and egg products. For PFOA, and especially for toddlers, these are milk and dairy products. It is important to state that PFAS exposure can also originate from other sources, including indoor environment and packaging materials (Sunderland et al. Citation2019).
Previously, tolerable daily intake (TDI) values for PFOA (Zeilmaker et al. Citation2016) and GenX (Beekman et al. Citation2016; Janssen Citation2017) were derived by the Dutch RIVM of respectively 12.5 and 21 ng kg−1 body weight (bw) per day. In the 2018 opinion, the EFSA scientifically evaluated the risk to human health, related to the presence of PFOA and PFOS in food (EFSA Panel on Contaminants in the Food Chain (EFSA CONTAM Citation2018). At that time, for PFOS, the increase in serum total cholesterol in adults and the decrease in antibody response at vaccination in children were identified as the critical effects. For PFOA, the increase in serum total cholesterol was considered the critical effect. Finally, a tolerable weekly intake (TWI) of 13 ng kg−1 bw per week for PFOS and 6 ng kg−1 bw per week for PFOA was established, which is strikingly lower than in previous studies. In 2020 a second assessment was carried out for the sum of four PFASs: PFOA, perfluorononanoic acid (PFNA, C9), perfluorohexane sulphonic acid (PFHxS C6) and PFOS (EFSA Panel on Contaminants in the Food Chain (EFSA CONTAM Citation2020). In this EFSA draft opinion a TWI of 8 ng kg−1 body weight (bw) per week was proposed for the sum of the assessed PFASs.
Based on the established TWI values of PFOA and GenX, the Office for Risk Assessment & Research of the Netherlands Food and Consumer product Authority requested The Dutch National Health Institute (RIVM) and Wageningen University and Research to calculate recommended minimum limits of quantification (LOQ) for analytical methods used for risk assessment studies (NVWA Citation2018). They calculated that analytical methods used for risk assessment studies should at least be able to quantify PFOA at 0.003 ng g−1 in milk and 0.03 ng g−1 in egg. For GenX these were 0.1 ng g−1 in milk and 1.2 ng g−1 in egg.
Currently, monitoring programmes mainly focus on perfluoroalkyl carboxylic acids (PFCAs, like PFOA) and perfluoroalkyl sulphonic acids (PFSAs, like PFOS) and in specific cases perfluoroalkyl ether carboxylic acids (PFECA), like HFPO-DA. Analytical methodologies for PFAS analysis in general were reviewed recently (Pan et al. Citation2020) and several analytical methods for the analysis of PFCAs, PFSAs and/or PFECAs in eggs (Hansen et al. Citation2001; Zafeiraki et al. Citation2016; Wen-Ling et al. Citation2018; Bao et al. Citation2019; Kedikoglou et al. Citation2019), dairy (Still et al. Citation2013; Barbarossa et al. Citation2014; Wen-Ling et al. Citation2018; Sznajder-Katarzyńska et al. Citation2019) or both (Noorlander et al. Citation2011) have been published. All aim for the detection of these substances at low ppb levels. Some methods were published for the analysis of various food matrices, including milk and egg with LOQs in the low ppt range (Noorlander et al. Citation2011; Sadia et al. Citation2020), but in one case limited to PFOA, PFOS and PFHxS (Sadia et al. Citation2020) and in the other only a limited validation study is reported (Noorlander et al. Citation2011).
In the new opinions, EFSA (EFSA Panel on Contaminants in the Food Chain (CONTAM) Citation2018) clearly recommended that analytical methods are required with a severely lower LOQ for egg, and especially for milk. In this manuscript we present a method for analysis of PFCAs (ranging from C5 to C11), PFSAs (including C4, C6-C8 and C10) and HFPO-DA. With this method LOQs, in some cases in the low ppt range were achieved. The method is fully validated for milk and egg according to the Dutch validation standard NEN 7777:2011 (NEN 2011). According to the authors’ knowledge, this is the first time a fully validated analytical method with such low detection limits has been reported (currently applied under ISO 17025 (NEN-EN-ISO/IEC 17025:2018) accreditation) for PFAS analysis in products of animal origin.
Materials and methods
Reagents
Methanol ULC/MS grade (MeOH) and acetonitrile ULC/MS grade (ACN) were purchased at Actu-All Chemicals (Oss, The Netherlands). All other chemicals were obtained from Merck Millipore (Darmstadt, Germany). Milli-Q water, referred to as water from here on, was prepared using a Milli-Q system with a resistivity of at least 18.2 M Ω cm−1 (Merck Millipore). Ammonium hydroxide solution (2%) was prepared by diluting 25% ammonium solution 12.5 times in ACN. Sodium acetate buffer (25 mM) was prepared by dissolving 3.40 g sodium acetate trihydrate in 1 L of water. The pH was adjusted to 4 by glacial acetic acid. Hydrochloric acid (4 M) was prepared by diluting 3.3 mL 37% HCl to 10 mL with water; lower concentrations were prepared from this solution. 200 g L−1 lead acetate solution was prepared by dissolving 200 g lead(II) acetate trihydrate in water. Mobile phase A, 2 mM ammonium acetate in water was prepared by dissolving 0.154 g ammonium acetate in 1 L of water.
Reference standards
The following PFCAs (all of at least 99% purity) were used in this study: perfluoropentanoic acid (PFPeA, C5), perfluorohexanoic acid (PFHxA, C6), perfluoroheptanoic acid (PFHpA, C7), PFOA (C8), PFNA (C9), perfluorodecanoic acid (PFDA, C10) and perfluoroundecanoic acid (PFUnDA, C11). These were obtained as a mixture of 2 µg ml−1 in MeOH from Wellington Laboratories (Guelph, Ontario, Canada). The following PFSAs were used in this study: perfluorobutane sulphonic acid (PFBS, C4), PFHxS (C6), perfluoroheptane sulphonic acid (PFHpS, C7), PFOS (C8) and perfluorodecanesulfonic acid (PFDS, C10). The PFSAs were obtained as a mixture of 2 µg ml−1 in MeOH from Wellington Laboratories. HFPO-DA, a PFECA, was obtained from Apollo Scientific (Denton, Manchester, United Kingdom). Stock solutions of HFPO-DA were made at 1000 mg L−1 in MeOH.
Isotopically labelled compounds were used as internal standards, to cover the whole analytical procedure including extraction, clean-up and instrumental determination. 13C2-PFHxA, 13C4-PFOA, 13C5-PFNA, 13C2-PFDA, 13C2-PFUnDA, 13C2-PFDoDA, 18O2-PFHxS and 13C4-PFOS were obtained from Wellington Laboratories as a 2 µg mL−1 mixture in MeOH. 13C3-PFPeA, 13C4-PFHpA, 13C3-PFBS and 13C3-HFPO-DA were obtained from Wellington Laboratories as individual solutions at the same concentration. Additionally isotopically labelled standards were used as an injection check: 13C8-PFOA and 13C8-PFOS, both obtained from Wellington Laboratories.
Analysis procedure
For the analysis of PFASs in milk and egg, a single method is applied with a different sample intake. For milk, transfer 9 g of homogenised milk into a 50 mL polypropylene (PP) centrifuge tube (Greiner Bio-One, Alphen aan de Rijn, The Netherlands). For egg analysis, 5 g of whole eggs are taken into the procedure. Add 25 µL of internal standard solution to the sub-sample and shake gently. After an incubation of at least 15 minutes at room temperature, add 10 mL lead acetate solution, 10 mL MeOH and 100 µL formic acid. Mix the sample using a vortex mixer (IKA, Staufen, Germany) for 1 min and shake using a rotary tumbler ((Heidolph REAX-2, Schwabach, Germany)) for 30 min. Centrifuge the extract for 10 min at 3500 x g at 2°C. Decant the supernatant into a clean PP centrifuge tube of 50 mL which already contains 25 mL of water. Mix and again centrifuge for 10 min at 3500 x g at 2°C before clean-up using solid phase extraction (SPE).
Condition a Strata-X-AW (mixed mode weak anion exchange, 200 mg/6 mL, 33 µm; Phenomenex, Torrance, USA) with 8 mL MeOH and subsequently 8 mL 0.04 M HCl. Carefully transfer the complete extraction supernatant onto the cartridge and slowly pass it through the cartridge (if needed by applying vacuum) to allow interaction between the SPE material and the PFASs. Rinse the cartridges with 5 mL of 25 mM sodium acetate buffer followed by 3 mL 0.04 M HCl in MeOH. Elute the PFASs with 5 mL 2% ammonium hydroxide in ACN into a 14 ml PP tube (Greiner Bio-One, Kremsmünster, Austria). Evaporate the solvent (40°C, N2) using a TurboVap LV Evaporator (Zymark, Hopkinton, MA, USA) and add 300 µL ACN. Reconstitute the residues by ultrasonication (ultrasonic bath by Branson, Danbury, CT, USA) for 5 min. Add 675 µL mobile phase A and 25 µl of the injection standard mixture containing 13C8-PFOA and 13C8-PFOS. Again ultrasonicate for 5 min and transfer the final extract into a 0.45 µm filter vial (Whatman Mini-UniPrep, PTFE, GE Healthcare, Chicago, Illinois, USA) before LC-MS/MS analysis.
UHPLC-MS/MS
The UHPLC system consists of a Shimadzu LC system containing 2 pumps, LC 20AD xr, Column oven, Shimadzu CTO-20AC, Pump switch, Shimadzu FCV-11AL, Degasser, Shimadzu DGU-20A3, Sample tray holder, Shimadzu SIL-20 AC XR model (Shimadzu Corporation, Kyoto, japan) with a Symmetry C18 analytical column (2.1 x 50 mm, 5 µm, Waters, Milford, MA, USA) as the isolator column between the pump and the injector valve to remove interferences from the mobile phase. An Acquity BEH-C18 analytical column of 2.1 × 50 mm, 1.7 μm (Waters), placed in a column oven at 35°C was used to separate the PFASs. The mobile phase consisted of 2 mM ammonium acetate in water (Mobile phase A) and ACN (Mobile phase B). The gradient: 0–0.1 min, 25% mobile phase B, 0.1–6.0 min, linear increase to 100% B with a final hold of 2.5 min. The gradient was returned to its initial conditions within 0.1 min and the column was allowed to equilibrate for 3.9 min before the next injection was initiated, resulting in a total run of 12.5 min. The flow rate was 0.3 mL min−1 and the injection volume 20 μL.
Detection is carried out by MS/MS using a Sciex QTrap 5500 (Sciex, Framingham, MA, USA) in negative electrospray ionisation (ESI) mode. The operating parameters are: ion spray voltage, −4.5 kV; curtain gas, 30 L h−1; temperature, 350°C; gas 1, 55 L h−1; gas 2, 60 L h−1; and collision gas, high. The PFASs were fragmented using collision-induced dissociation (argon). SRM transitions were selected based on the abundance of the signal and, if multiple options were available, the selectivity of the transition (). Data were acquired using Analyst software and processed using MultiQuantTM (Sciex).
Table 1. SRM transitions of the PFASs.
Method validation
The method was fully validated according to NEN 7777:2011 (NEN Citation7777:2011/C1;:2012 2011) which is designed to facilitate the use of actual contaminated samples during the validation instead of samples that have only been fortified, which eliminates the need of the availability of samples that do not contain any of the PFASs at the very low levels aimed at. The following parameters related to a quantitative confirmatory method were determined: selectivity, stability, trueness (based on spiked samples), within-laboratory reproducibility (expressed as relative standard deviation, RSDRL), repeatability (expressed as relative standard deviation, RSDr), limit of detection (LOD), limit of quantification (LOQ) and limit of confirmation (LOC). The latter is defined as the lowest concentration of the analyte in a sample that allows the detection of both the ion transitions with a matching relative abundance within the criteria of the method (Delatour et al. Citation2007).
The validation was carried out separately for milk and egg, including milk (n = 8) and egg (n = 8) samples randomly selected from routine testing. Both validation procedures covered eight different days each. An overview of the validation plan is included in . On each validation day a specific sample batch (P1 – P8) was selected for matrix-matched calibration and two other sample batches were analysed as is and with addition of all PFASs; one of them in duplicate. On the other days this was repeated (matrix-matched calibration was carried out using a different sample batch on each day) so that each sample was analysed in singular on one day and in duplicate on another. In all cases the sample batch used for the calibration was different from the ones used for calculation of the trueness, RSDr and RSDRL. Also the validation was carried out by two different technicians. Because the sensitivity of the method differs among the PFASs included, and most of them are commercially obtained as a mixture, the matrix calibration was carried out over a wide concentration range including at least the aimed LOQ for PFOA, PFOS and HFPO-DA: (besides 0) for milk from 0.0025 to 1.0 ng mL−1 and for egg 0.025–10 ng g−1. For milk the concentrations at which the samples were fortified were: low, 0.0025; medium, 0.005 and high 0.01 ng mL−1. For egg this was: low, 0.025; medium, 0.05 and high 0.1 ng g−1. Again, in anticipation of sensitivity differences, the fortified concentrations were added to different aliquots of the same batches at the level indicated (low, medium and high) and a factor of 10 and 100 higher. For each individual PFAS the lowest concentration levels that were still detectable and the corresponding calibration range (existing of at least five calibration points) was selected for calculating the performance parameters.
Figure 1. General validation study design. All samples originating from batches B1-8 were analysed as is, at the three spike levels indicated (low, medium, high), and at 10 and 100-fold of these concentrations.
Quantitative results were obtained on the basis of the external matrix-matched calibration after correction of the signals (peak area) of the individual PFASs with the corresponding isotopically labelled internal standards to correct for differences in the recovery, ionisation and other matrix influences. For PFHpS and PFDS no labelled internal standard was available; 18O2-PFHxS was used for PFHpS and 13C2-PFDoDA for PFDS because their retention time was closest to the retention time of the native compounds.
Confirmation of identity
For veterinary drugs in products of animal origin criteria have been established in 2002/657/EC (EC 2002) for the allowed deviation of the relative abundance of both diagnostic ions (ion ratio) resulting from an unknown sample. In this decision the maximum allowed deviation depends on the ion ratio itself. For pesticide residues this is done using SANTE 12682/2019 EC (Citation2019) in which 30% deviation compared to the reference sample is allowed independent of the ion ratio itself. With respect to recent data published (Berendsen et al. Citation2016) and the upcoming revision of 2002/657/EC, we adopted the current guidelines for pesticide residues for PFAS analysis. Furthermore, the relative retention time of a PFAS should not deviate more than 2.5% from the reference relative retention time. In order to assess the possibility to confirm the identity of a detected compound using the presented method the average ion ratio and the average relative retention time of the matrix-matched calibration samples was used as the reference value.
Selectivity
LC-MS/MS is considered to be highly selective, especially in negative ion mode. In order to demonstrate the selectivity, aliquots of eight different presumed blank batches of samples were analysed without addition of any reference standards except the internal standards. Furthermore, each day a blank chemical preparation was carried out in duplicate to correct for incidental contamination originating from the laboratory or from laboratory consumables. PFOS detection may suffer from a co-eluting interference of taurodeoxycholic acid (TDCA), a bile acid, which also shows the same transition as the most sensitive PFOS transition (m/z 499–>80) (Benskin et al. Citation2007). This bile acid is particularly prominent in eggs (Sadia et al. Citation2020). In this method it was chromatographically separated from PFOS preventing any interference.
Stability
Stability of the PFASs in the samples and solvent solutions was not tested as it is generally agreed upon that these substances are very persistent. Stability data for the PFASs in the final extract were determined by reinjection of a set of samples two weeks after the initial analysis.
Limit of detection, limit of quantification and limit of confirmation
Often, the LOD and LOQ are derived from the arithmetic mean plus three times and ten times the standard deviation, of the analyte signal (Barwick et al. Citation2014). However, this is a theoretical estimation of the LOD and LOQ and as it is solely based on data obtained from blanks, it does not indicate that detection and quantification are indeed possible at the determined LOD respectively LOQ. A non-realistic result might be obtained especially if the blank signals are derived from reagent or procedural blanks (not containing matrix). For amongst others chromatographic techniques, it is necessary to use a sample containing a low level of analyte rather than a blank (Barwick et al. Citation2014). In this study, it was decided to determine the LOD, LOQ and LOC on the basis of spiked samples, which will yield an overestimation of the actual LOD, LOQ and LOC.
The limit of detection is considered to be the lowest level of a PFAS that can be detected. As this relates to detection only, the LOD is the concentration that yields a signal for the most abundant ion transition with a signal-to-noise (S/N) of 3. As the LOD can differ among different runs, we reported the lowest calibration level that in at least seven out of the eight series complied with S/N = 3 for the most abundant ion transition.
The LOQ is the concentration at which a quantitative result can be reported. Usually the LOQ complies with S/N = 6. The required LOQ calculated (see introduction) relates to the use of the analytical method for risk assessment studies. In such studies, when a PFAS is not detected in a specific sample, for this sample the LOQ is used as input for the dietary exposure calculations, being a worst case approach. Clearly, for this goal, confirmatory analysis at the LOQ is not relevant. Therefore, in this study, the LOQ is the concentration that yields a signal for the most abundant ion transition with an S/N of 6. Instead of calculating a theoretical LOQ, we chose to actually demonstrate that the LOQ level can be achieved: as the LOQ can differ among different runs, we reported the lowest calibration level that in at least seven out of the eight series complied with S/N = 6 for the most abundant ion transition.
The LOC is considered to be the lowest level of a PFAS that complies with the confirmatory criteria (see above). As the LOC can differ among different runs, we reported the lowest calibration level that in at least seven out of the eight series complied with the confirmatory criteria.
Trueness, repeatability and within-lab reproducibility
For calculation of trueness, repeatability and within-lab reproducibility for each PFAS, the samples at the lowest possible spike level (low, medium and high) and dilution factor (0, 10 of 100) were used at which a significant signal was observed for both ion transitions. The trueness was calculated on basis of spiked samples. The trueness for each individual sample was calculated by dividing the calculated concentration by the actual spiked concentration, in some cases after correction for a signal found in the chemical blank or in the non-fortified sample. The overall trueness is the average of all spiked samples. Repeatability was calculated from all the individual duplicates analysed within a single day. The within-lab reproducibility was calculated from the results obtained for a single batch analysed on the two different days.
The performance criteria were established in advance and derived based on a relevant concentration level of 1 ng g−1. If these were derived from lower concentrations, the criteria would be unrealistically high. Therefore, this approach can be considered a worst case situation. Trueness must lie between 50% and 120%, adopted from 2002/657/EC (Citation2002/657/EC). Acceptance criteria for RSDr and RSDRL are derived from Horwitz et al. (Citation1980). Based on the relevant concentration level, the RSDRL should not exceed 45%. The RSDr is at maximum two-thirds of that: 30% (Citation2002/657/EC).
Application
The developed method was applied for a small study. In this study 17 milk samples (16 cattle, 1 goat) and 2 egg samples were obtained from two areas in The Netherlands that pose a high risk for PFAS exposure. The study focussed on PFOA and HFPO-DA only.
Results and discussion
Sample extraction and concentration
To achieve the required low LOQs for egg and especially milk, a relatively large sample intake and the use of solid phase extraction was deemed necessary. Compared to a method previously running in our facilities, the sample intake was increased from 1 g to 9 g for milk and 5 g for egg. With higher sample intake, the original method of an extraction using alkaline MeOH (10 mL) proved inadequate: proteins were insufficiently removed yielding clogged SPE cartridges. Also an increase in extraction volume alone did not solve this issue. The addition of a saturate lead acetate solution during extraction, promoting protein precipitation, yielded clearer extracts that could be passed through the SPE cartridges. Because all PFASs included are strong acids, a mixed mode weak anion exchange material was used. This effectively cleaned up the sample extracts. Also it allowed elution in an organic solvent which is relatively easy to evaporate.
A main challenge in the sample preparation of PFASs is contamination from the laboratory surrounding and directly from laboratory consumables, especially of PFOA. This is more prominent if required LOQs are in the ppt range whilst on the other hand, some samples contain concentration up to the ppm range (e.g. waste water). It is recommended to work with such samples in different rooms and not interchange the laboratory equipment used. If this is not possible, especially the SPE manifold is a high risk of contamination. The use of disposable PP inserts, placed into the SPE taps is an effective way to prevent contamination. With regard to consumables, pipet tips, centrifuge tubes and filters should not be made from a fluorine containing polymer or be explicitly tested prior to use. Also the SPE cartridge can be a source of PFASs and should be checked by the implementation of a blank chemical control sample that is taken through the complete sample work-up procedure.
LC-MS/MS
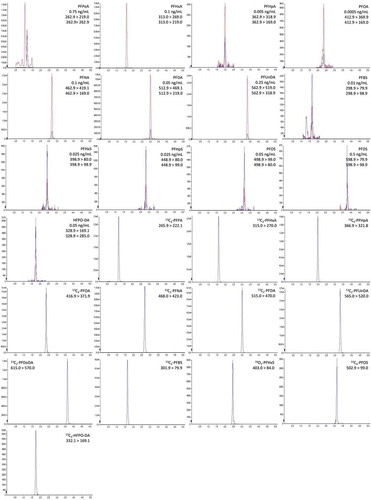
The LC method applied in this application is a very generic separation applying common mobile phases and gradient elution. The use of an isolator column to prevent PFASs from the mobile phase interfering with the PFASs’ signals is mandatory (Luque et al. Citation2012). The detection was carried out using tandem MS in Multiple Reaction Monitoring mode. The precursor ions and product ions were determined by continuous infusion of the compounds and the ionisation setting were optimised. A typical chromatogram of a milk sample spiked at relevant level is presented in .
Figure 2. Representative extracted ion chromatograms of all PFASs in a milk extract at relevant concentration level. The concentration level is indicated for all individual PFASs. Both ion transitions of the native PFASs are presented as overlay. For the internal standards a single ion transition was monitored.
To verify the correct and reproducible injection of the LC and instrument performance for every individual sample, in addition to the internal standards (that are added to the matrix prior to sample preparation), 13C8-PFOA and 13C8-PFOS were added to the final sample extract prior to injection. As this was not taken through the sample preparation, the response of these labelled standards yields information on the correct injection and the stability of the mass spectrometer.
Validation
The main aim of the validation was to assess the quantitative aspect of the method, but the ability to confirm the identity of the PFASs was assessed as well. The results for trueness, repeatability, within-laboratory reproducibility, LOD, LOQ and LOC are presented in for milk and in for egg. Additionally the selectivity and the stability of the final extracts were determined.
Table 2. Determined trueness, repeatability, within-laboratory reproducibility, LOD, LOQ and LOC for milk analysis as determined during the validation. Underlined values do not comply with the quantitative performance criteria.
Table 3. Determined trueness, repeatability, within-laboratory reproducibility, LOD, LOQ and LOC for whole egg analysis as determined during the validation. Underlined values do not comply with the quantitative performance criteria.
Selectivity
The selection of product ions was done based on their abundance (to allow low detection limits) in combination with their selectivity (in case multiple product ions showed sufficiently high signals) (Berendsen et al. Citation2013). The use of common ion transitions, e.g. loss of carboxylic acid, should be omitted if possible. In the case of the PFCAs, the loss of carboxylic acids is in most case by far the most abundant ion transition. As a matter of fact, for the short chain PFCAs, no other ion transitions were available. Furthermore, to be able to achieve the required LOQs, the ion transitions related to the neutral loss of carboxylic acid had to be used. Through the analysis of the different batches of milk and egg without addition of PFASs, it was demonstrated that the selectivity of the method is indeed sufficiently selective. Only in two batches a minor signal was observed for mainly PFOA, PFNA and PFOS and in all these cases a combination of closely related PFASs was observed. The detection of a combination of closely related PFASs indicates the actual presence of these PFASs at very low level and cannot be attributed to a lack of selectivity. As no interferences from the matrix were observed, and we chromatographically separated the possibly interfering TDCA from PFOS, the method was deemed sufficiently selective for its goal.
Stability
Stability data for the PFASs in the final extract were determined by reinjection of a set of samples two weeks after the initial analysis for both milk and egg. It was observed that the outcomes of the reinjection were similar to the initial injection and in both cases complied with the established criteria. As expected, the PFASs can be considered to be stable in the final extract.
LOD, LOQ and LOC
The achieved detection limits differed severely among the different PFASs. A clear trend is observed: the achieved LODs tend to increase for the very short chains and with increasing chain length. Additional research, initiated by the validation outcomes, demonstrated that lower absolute recoveries were obtained for the long chain PFASs. This explains the severe differences in detection limits observed. It was found that these PFASs can adsorb to the filter present in the filter vials under the applied conditions. PFOA proved to adsorb for approximately 10% and this increases with increasing chain length to over 95% for PFUnDA. Also longer chains were tested and they completely adsorb. The use of cellulose filters (Whatman) mitigates this issue and proved to adsorb less than 5% of PFUnDA under the applied conditions. With this revision to the method, an improvement for the long chain PFASs is expected and even longer chain PFASs (up to C18) can be added to the method.
The method aimed for an LOQ for PFOA of at least 0.003 ng g−1 in milk and 0.03 ng g−1 in egg and for HFPO-DA 0.1 ng g−1 in milk and 1.2 ng g−1 in egg. For HFPO-DA the required LOQs were easily achieved for both milk and egg analysis (both 0.05 ng g−1). For PFOA in egg, the aimed LOQ was just achieved: 0.025 ng g−1 and also confirmatory analysis can occur at this level. For PFOA in milk, the determined LOQ is slightly higher than required: 0.005 ng g−1 instead of the required 0.003 ng g−1. However, an LOQ of 0.0025 ng g−1 was achieved on 6 out of the 8 validation days. On day 3 and 8, higher detection limits were observed for all PFAS indicating that the suboptimal performance was not the result of specific matrix effects, but was related to the instrument performance. This indicates that, if instrument performance is critically assessed prior to starting every single batch of samples by injecting relevant performance control samples, the method can be applicable for risk assessment studies as indicated.
For some PFASs, the LOC is severely higher than the LOQ. This is especially the case for PFPeA, PFHxA and PFUnDA. The LOC is determined by the signal of the least abundant diagnostic ion. The relative ion abundance of PFPeA, PFHxA and PFUnDA are respectively 16%, 4% and 12% directly causing a relatively high LOC compared to the LOQ. In some other cases, the LOC is similar to the LOQ indicating only a minor difference in the sensitivity of the two diagnostic ions.
Quantitative performance
For the PFASs, the trueness in milk ranges from 87% to 113%. The RSDr of the method for milk analysis ranges from 6% to 17% except for PFDS: 60%. The RSDRL for milk ranges from 12% to 39%, again with the exception for PFDS: 85%. It is concluded that the quantitative parameters of the reported method for milk analysis comply with the established criteria except for PFDS. For egg trueness is between 96% and 119%, with the exception of PFDS which shows a trueness out of 125%: outside the allowed tolerance. The RSDr of the method for egg analysis ranges from 12 to 30 and the RSDRL from 13% to 41%. The lack of quantitative performance for PFDS is a direct consequence of the lack of an isotopically labelled internal standard for this specific compound and its relatively low recovery due to adsorption to the filter (see above). It is concluded that the quantitative parameters of the reported method for milk and egg analysis comply with the established criteria except for PFDS.
Application
The developed method was applied to a small exposure study with a special focus on PFOA and HFPO-DA. In this study 17 milk samples (16 cattle, 1 goat) and 2 egg samples taken in hotspot areas in the Netherlands were analysed. All milk samples were found negative for PFOA and GenX applying the reported detection limits, while in one of the two egg samples PFOA was detected at 0.14 ng g−1. Based on these and other results, a risk assessment was carried out by the Office of Risk Assessment and Research of the Netherlands Food and Consumer Product Safety Authority (Office for Risk Assessment and Research Citation2019).
Conclusion
A fully validated quantitative confirmatory method for the analysis of 13 PFASs including PFCAs, PFSAs and HFPO-DA, a PFECA in milk and egg is presented. For PFOA the method aimed for an LOQ in the low ppt range. The method is able to achieve the low LOQs required for all analytes, but for PFOA in milk (aimed at 0.003 ng g−1) only if the instrument performance is optimal. Long chain PFASs suffer from adsorption to the filter in the final step of the procedure, but this can be mitigated by using cellulose filters. The method was demonstrated to be applicable for quantitative confirmatory analysis for all compounds included, except PFDS. PFDS suffers from poor trueness and high uncertainty and can only be determined qualitatively.
Acknowledgments
The work presented was funded by the Dutch Ministry of Economic affairs (project WOT-02-001-011 and 017). We thank our colleagues from the WFSR quality department for critically assessing the validation plan and report.
Disclosure statement
No financial interest or benefit has arisen from the direct applications of the presented research.
Additional information
Funding
References
- Bao J, Yu W-J, Liu Y, Wang X, Jin Y-H, Dong G-H. 2019. Perfluoroalkyl substances in groundwater and home-produced vegetables and eggs around a fluorochemical industrial park in China. Ecotox Environ Safe. 171:199–205. doi:10.1016/j.ecoenv.2018.12.086.
- Barbarossa A, Gazzotti T, Zironi E, Serraino A, Pagliuca G. 2014. Short communication: monitoring the presence of perfluoroalkyl substances in Italian cow milk. J Dairy Sci. 97:3339–3343. doi:10.3168/jds.2014-8005.
- Barwick V, Bravo PPM, Ellison SL, Engman J, Gjengedal EL, Lund UO, Magnusson B, Müller H-T, Patriarca M, Pohl B, et al. 2014. The fitness for purpose of analytical methods. Eurachem.
- Beekman M, Zweers P, Muller A, de Vries W, Janssen P, Zeilmaker M. 2016. Evaluation of substances used in the GenX technology by chemours. Dordrecht: National Institute for Public Health and the Environment (RIVM), Bilthoven.
- Benskin JP, Bataineh M, Martin JW. 2007. Simultaneous characterization of perfluoroalkyl carboxylate, sulfonate, and sulfonamide isomers by liquid chromatography−tandem mass spectrometry. Anal Chem. 79(17):6455–6464. doi:10.1021/ac070802d.
- Berendsen BJA, Meijer T, Wegh R, Mol HGJ, Smyth WG, Armstrong Hewitt S, van Ginkel L, Nielen MWF. 2016. A critical assessment of the performance criteria in confirmatory analysis for veterinary drug residue analysis using mass spectrometric detection in selected reaction monitoring mode. Drug Test Anal. 8(5–6):477–490. doi:10.1002/dta.2021.
- Berendsen BJA, Stolker LAM, Nielen MWF. 2013. The (un)certainty of selectivity in liquid chromatography tandem mass spectrometry. J Am Soc Mass Spectr. 24:154–163. doi:10.1007/s13361-012-0501-0.
- Buck RC, Franklin J, Berger U, Conder JM, Cousins IT, de Voogt P, Jensen AA, Kannan K, Mabury SA, van Leeuwen SPJ. 2011. Perfluoroalkyl and polyfluoroalkyl substances in the environment: terminology, classification, and origins. Integr Environ Asses. 7:513–541. doi:10.1002/ieam.258.
- Delatour T, Mottier P, Gremaud E. 2007. Limits of suspicion, recognition and confirmation as concepts that account for the confirmation transitions at the detection limit for quantification by liquid chromatography–tandem mass spectrometry. J Chromatogr A. 1169:103–110. doi:10.1016/j.chroma.2007.08.065.
- [EFSA CONTAM] European Food Safety Authority Panel on Contaminants in the Food Chain. 2018. Risk to human health related to the presence of perfluorooctane sulfonic acid and perfluorooctanoic acid in food. EFSA J. 16(12):5194. doi:10.2903/j.efsa.2018.5194
- [EFSA CONTAM] European Food Safety Authority Panel on Contaminants in the Food Chain. 2020. Draft Scientific Opinion on the risk to human health related to the presence of perfluoroalkyl substances in food. EFSA J.
- [EC] European Commission. 2002. Commission Decision 2002/657/EC implementing council directive 96/23/EC concerning the performance of analytical methods and the interpretation of results, 2002. Off J Europ Commun. L221:8–36.
- [NVWA] Netherlands Food and Consumer Product Safety. 2018. Discussion on required limit of quantification for risk assessment studies of PFOA and GenX in food products. Utrecht: Dutch Food and Consumer Product Safety Authority (NVWA).
- Hansen KJ, Clemen LA, Ellefson ME, Johnson HO. 2001. Compound-specific, quantitative characterization of organic fluorochemicals in biological matrices. Environ Sci Technol. 35:766–770. doi:10.1021/es001489z.
- Horwitz W, Kamps LVR, Boyer KW. 1980. Quality assurance in the analysis of foods for trace constituents. Off Anal Chem. 63:1344–1354.
- Janssen P. 2017. Derivation of a lifetime drinking-water guideline for 2,3,3,3-tetrafluoro-2-(heptafluoropropoxy)propanoic acid (FRD-903) – revised version January 2017. Bilthoven: Rijksinstituut voor Volksgezondheid en Milieu (RIVM). Appendix to letter 0148/2016/M&V/EvS/AV.
- Kedikoglou K, Costopoulou D, Vassiliadou I, Leondiadis L. 2019. Preliminary assessment of general population exposure to perfluoroalkyl substances through diet in Greece. Environ Res. 177:108617. doi:10.1016/j.envres.2019.108617.
- Luque N, Ballesteros-Gómez A, van Leeuwen S, Rubio S. 2012. A simple and rapid extraction method for sensitive determination of perfluoroalkyl substances in blood serum suitable for exposure evaluation. J Chromatogr A. 1235:84–91. doi:10.1016/j.chroma.2012.02.055.
- [NEN] Nederlands Normalisatie Instituut. 2011. 7777:2011/C1:2012. Environment and food - Performance characteristics of measurement methods. Delft: Stichting Koninklijk Nederlands Normalisatie Instituut (NEN).
- [NEN] Nederlands Normalisatie Instituut. 2018. NEN-EN-ISO/IEC 17025:2018. General requirements for the competence of testing and calibration laboratories. Delft: Stichting Koninklijk Nederlands Normalisatie Instituut (NEN).
- Noorlander CW, van Leeuwen SPJ, Te Biesebeek JD, Mengelers MJB, Zeilmaker MJ. 2011. Levels of perfluorinated compounds in food and dietary intake of PFOS and PFOA in The Netherlands. J Agr Food Chem. 59:7496–7505. doi:10.1021/jf104943p.
- Office for Risk Assessment and Research. 2019. Advice on PFOA and GenX in food. Letter to the minister of mediacal care and sports. Utrecht: Dutch Food and Consumer Product Safety Authority (NVWA).
- Pan Y, Wang J, Yeung LWY, Wei S, Dai J. 2020. Analysis of emerging per- and polyfluoroalkyl substances: progress and current issues. TrAC Trend Anal Chem. 124:115481. doi:10.1016/j.trac.2019.04.013.
- Sadia M, Yeung LWY, Fiedler H. 2020. Trace level analyses of selected perfluoroalkyl acids in food: method development and data generation. Environ Pollut. 263:113721. doi:10.1016/j.envpol.2019.113721.
- [EC] European Commission. 2019. SANTE/12682/2019. Analytical quality control and method validation procedures for pesticide residues analysis in food and feed.
- Still M, Schlummer M, Gruber L, Fiedler D, Wolz G. 2013. Impact of industrial production and packaging processes on the concentration of per- and polyfluorinated compounds in milk and dairy products. J Agr Food Chem. 61:9052–9062. doi:10.1021/jf4020137.
- Sunderland EM, Hu XC, Dassuncao C, Tokranov AK, Wagner CC, Allen JG. 2019. A review of the pathways of human exposure to poly- and perfluoroalkyl substances (PFASs) and present understanding of health effects. J Expos Sci Environ Epidemiol. 29:131–147. doi:10.1038/s41370-018-0094-1.
- Sznajder-Katarzyńska K, Surma M, Wiczkowski W, Cieślik E. 2019. The perfluoroalkyl substance (PFAS) contamination level in milk and milk products in Poland. Int Dairy J. 96:73–84. doi:10.1016/j.idairyj.2019.04.008.
- [US EPA] United States Environmental Protection Agency. 2015. Available from: https://www.epa.gov/assessing-and-managing-chemicals-under-tsca/fact-sheet-20102015-pfoa-stewardship-program#mfg
- Wen-Ling C, Fang-Yu B, Ying-Chia C, Pau-Chung C, Chia-Yang C. 2018. Concentrations of perfluoroalkyl substances in foods and the dietary exposure among Taiwan general population and pregnant women. J Food Drug Anal. 26:994–1004. doi:10.1016/j.jfda.2017.12.011.
- Zafeiraki E, Costopoulou D, Vassiliadou I, Leondiadis L, Dassenakis E, Hoogenboom RLAP, van Leeuwen SPJ. 2016. Perfluoroalkylated substances (PFASs) in home and commercially produced chicken eggs from the Netherlands and Greece. Chemosphere. 144:2106–2112. doi:10.1016/j.chemosphere.2015.10.105.
- Zeilmaker MJ, Janssen P, Versteegh A, Pul A, Vries W, Bokkers B, Wuijts S, Oomen A, Herremans J. 2016. Risicoschatting emissie PFOA voor omwonenden.