
 ?Mathematical formulae have been encoded as MathML and are displayed in this HTML version using MathJax in order to improve their display. Uncheck the box to turn MathJax off. This feature requires Javascript. Click on a formula to zoom.
ABSTRACT
The current migration assessment requirements regarding safety of plastic food contact materials in Europe (e.g. kitchen utensils, kitchen appliances, packaging, etc.) widely rely on migration testing. According to Annexe V of Regulation (EU) No 10/2011 migration testing requirements consider the specificities of repeated use applications only to a limited extent. Repeated use food contact materials should be tested for three consecutive times at the worst-case contact time and temperature. If diffusion controlled, the migration decreases with increasing number of repeated uses. Compared to single use applications, repeated use food contact materials typically exhibit much shorter contact times, much lower ratios of surface in contact with a given amount of food, and in some cases higher temperatures. Compared to real use, in many cases highly overestimated migration testing result are observed. Overestimation by testing at the beginning of use may be coupled with underestimation at later times. National legislation of the Netherlands on food contact materials has established a classification for repeated use rubber materials based on the R-value indicating whether migration testing is required or not. The R-value considers in more detail specificities of repeated use applications. This publication investigates to which extent it is possible to apply the approach to plastics food contact materials in Europe. It is practically impossible to perform migration tests for various materials by putting them many times in contact with food over a long period of time, typically several years, at several temperatures and areas to food amount ratios migration. Modelling has therefore been used to predict migration from various food contact materials under different repeated use scenarios. Realistic diffusion properties of materials and migrant partitioning behaviour have been assumed to minimise the risk of underestimation.
Introduction and background
Food contact materials (FCM) face safety requirements regarding intentionally and non-intentionally added substances limiting the use of new materials in food contact applications, raw materials substitution and new material concepts. On the other hand, high-quality foods and sustainable food production require new and innovative material solutions.
Plastic food contact materials most likely contain intentionally added substances (IAS) and may contain non-intentionally added substances (NIAS) like impurities, breakdown products, low molecular weight oligomers, etc., which require a safety assessment in accordance with internationally recognised scientific principles on risk assessment (Regulation (EU) No 10/2011).
Aim of this work is to provide a reliable approach for risk assessment of non-intentionally added substances (NIAS) and it is not foreseen to be used for intentionally added substances already authorised. From safety point of view the Cramer Classes and related exposure threshold values are considered as a suitable point of departure for this scientific work (Cramer et al. Citation1978).
Consumer exposure by substances released from food contact materials is assessed based on the assumption that 1 kg of food is in contact with an area of 6 dm2 of food contact material and that the whole food consumed per day (in Europe on average 1 kg for a 60 kg person) is in contact with one and the same material to be evaluated. The assumption that the whole food consumed per day is in contact with one and the same material to be evaluated represents the worst-case exposure in case no detailed exposure scenario for a given substance is available. The material area to food amount ratio of 6 dm2/kg represents a reasonable worst case for single-use applications like packaging but is a highly overestimating approach with respect to repeated use food contact materials and articles, where the area to amount ratio is typically much lower.
In the food contact legislation of the Netherlands (Warenwetregeling verpakkingen en gebruiksartikelen 2017) rubbers are considered mainly as repeated use articles, which are classified in three categories. To distinguish these categories a criterion based on an “R-value” is introduced, (see below):
defined sensitive applications, R does not apply
R > 0.001
R < 0.001
The R-criterion was developed and implemented to decide whether the migration from rubber food contact materials to food can be considered negligible or not, i.e. migration testing is required or not. Four individual factors R1 through R4 are introduced, relating to:
the relative contact surface,
the contact temperature,
the contact time and
the number of times that the consumer article is reused.
The product of the four factors, in the following called the ‘R-criterion’, defines in which category the rubber product falls.
This criterion does not apply to articles falling within Category I, which includes rubber products that require particular care in light of their use, particularly infant pacifiers and articles intended to be taken into the mouth of infants or toddlers, as well as articles intended to come into contact with baby foods; the latter, however, only if they would not fall within Category III based on the R-criterion calculation.
Category III includes rubber products for which the R-criterion is less than 0.001, so that any migration of components is considered negligible and no migration testing is required. Category II includes rubber products for which the R-criterion is greater than 0.001, when migration tests must be undertaken.
The factor R4 is of particular interest, because in principle the migration amount per use from a plastic food contact material decreases with increasing number of uses. The R-criterion concept is designed such that the average migration related the total number of uses is considered rather than the worst-case migration related to the first use. This is the main reasoning why applying the concept to authorised substances is not recommended.
In the present work extension of the repeated use model from rubber to plastic food contact materials is considered including consideration of its specificities and introduction of additional factors which have an impact on migrating amounts.
Rubbers are high diffusivity polymers, due to the high mobility of the polymer chains at molecular level. Mobility of the polymer chains correlates with the polymer’s glass transition temperature (Tg). Migration of substances in polymers requires cooperative movement of both the migrant himself and the surrounding polymer chains, i.e. migration rates are high for polymers with high mobility and low for polymers with low mobility. Extension of the R-criterion concept from rubber to plastics includes a wide range of polymers with different mobility at molecular level, e.g. high diffusivity polymers like low density polyethylene (LDPE, low Tg) or low diffusivity polymers like polyethylene terephthalate (PET, high Tg). A dependency of the R-value from the diffusivity of polymer can be expected.
Due to the unlimited variety of real cases and relevant parameters, migrating amounts from plastic food contact materials to food cannot be determined by testing, but estimated by migration modelling.
Materials and methods
Materials and parameter selection
From scientific literature and experimental investigations performed in the frame of several EU projects it turns out that migration of low molecular weight substances (monomers, additives, etc.) from typical plastic materials used for manufacturing of food contact materials obeys Fick’s 2nd Law of Diffusion (Piringer and Baner Citation2008). The phenomenological observation that diffusion properties of polymers expressed as polymer specific constants (Begley et al. Citation2005) exhibit a linear correlation with their glass transition temperature was published by Brandsch (Citation2017).
To cover the full range of plastic food contact materials used in repeated use food contact applications the materials were selected based on their frequency in use and their diffusion properties at a reference thickness of 2 mm. The reference thickness of 2 mm is considered to be representative for repeated use food contact articles like kitchen utensils or kitchen appliances which contact food one-sided (e.g. tubs, bowls, coffee hopper, etc.) or by full immersion (e.g. spoon, knife, spatula, etc.).
Selected polymers
Polyolefins are high volume plastics in food contact applications. Kitchen utensils manufactured from low density polyethylene (LDPE) or polypropylene homopolymer (PP, homo) are widespread repeated use articles. Glass transition temperatures of low-density polyethylene are in the range of −125 °C to −90 °C and these can be considered as high diffusivity polymers. Glass transition temperatures of polypropylene homopolymers are in the range of −20 °C to 0 °C and can be considered as medium diffusivity polymers.
Typical rubbers used in food contact applications exhibit glass transition temperatures in the range of −90 °C to −60 °C (Brandrup et al. Citation2003) and hence show diffusion properties which are between those of LDPE and PP, homo.
Polyamide 6 (PA6) is a high-volume plastic used in repeated use applications in kitchen appliances and food processing equipment. PA6 can be considered as a medium diffusivity polymer with a glass transition temperature in the range of 50 °C to 60°C.
Polyethylene terephthalate (PET) is a high-volume plastic used in repeated use applications to package beverages as well as in kitchen appliances and food processing equipment. PET can be considered as a low diffusivity polymer with a glass transition temperature of approximate 70 °C.
Polystyrene (PS) is a high-volume plastic used in repeated use applications in kitchen appliances and food processing equipment. PS can be considered as a low diffusivity polymer with a glass transition temperature of approximate 100 °C.
Selected migrants
To cover the full range of potential migrants used in repeated use food contact applications the migrants were selected based on their molecular mass. Each polymer considered was tested with a small-sized (molecular mass 100 g/mol), a medium-sized (molecular mass 250 g/mol and 500 g/mol) and a large-sized migrant (molecular mass 750 g/mol) at a reference concentration of 0.1%. For molecules with a molecular mass above 750 g/mol diffusion rates become very low resulting in very low migrating amounts, for which reason larger molecules were not considered.
Selected food type related partitioning
To cover the full range of potential foods in contact with repeated use materials or articles, contact was considered with high solubility (partition coefficient between plastic and food of 1 and 500) and low solubility (partition coefficient between plastic and food of 1000 and 10000).
Migration modelling
Migration models for plastic materials are typically based on Fick’s 2nd Law of Diffusion (Poças et al. Citation2012), because migration of related substances obeys Fick’s 2nd Law of Diffusion. The diffusion process is the rate determining step in the overall mass transfer process from the plastic mono- or multi-layer material to food or food simulants. This simplification implies the main boundary conditions of the resulting diffusion model (a) that the mass of migrant in the system is constant, i.e. the substances are not generated nor consumed in the time frame of the simulation, and (b) the diffusion properties of the materials involved are constant, e.g. no swelling of the materials by the contact medium and no loss of plasticiser from the material to the contact medium during simulation occurs. Furthermore, no boundary resistance is considered at the interface of the layers including the contact medium.
Fick’s 2nd Law of Diffusion is a partial differential equation which can be solved numerically for mono- and multi-layer materials in contact with a finite volume of contact medium, e.g. food or food simulant, drinking water, etc. (Roduit et al. Citation2005). For simple cases, i.e. a monolayer material in contact with a finite volume of a well-mixed liquid or even an infinite volume of contact medium so called analytical solution of the diffusion equation are available in Crank’s book Mathematics of Diffusion (Citation1975).
The solution of the diffusion equation describes the dependence of the migration process on a set of inputs. The set of inputs comprises:
the initial concentration of the migrant in all layers,
the diffusion coefficients of the substance in each layer, and partition coefficients between the adjacent layer,
the density of all layers,
the geometry of the system, i.e. thickness of all layers, contact area, volume of the contact medium and
time and temperature.
Current estimation procedures for diffusion coefficients rely on several parameters. Most of the parameters need to be determined experimentally with more or less effort. From a feasibility/economic point of view experimental determination of the required parameters in most of the published estimation procedures is of limited applicability, for which reason simple empirical estimation procedures were developed as published by Begley et al. (Citation2005) or more advanced estimation procedures as published by Welle (Citation2012) or Brandsch (Citation2017). The referenced estimation procedures use an Arrhenius type relationship to consider the dependence of diffusion coefficients on temperature.
Numerical solution of the diffusion equation
For the numerical solution of Fick’s 2nd Law of Diffusion, the migraSIM solver is used. The migraSIM solver is built by the SAFE+ Algorithmics GmbH. It is the in-house modelling tool and available as a web service for third parties. The results of the solver are in good agreement with the results of other solvers (for example AKTS SML Advanced and MIGRATEST EXP) and validated by a lot of examples/projects (UBA Citation2008). The numerical algorithm of migraSIM is built with well-established numerical methods and is based on the following description:
The matrix consists of multiple layers over the one-dimensional domain
where
for
are the positions of the boundaries between the layers
and
. For each migrant, the concentration profile
is computed by solving the diffusion equation:
where is the diffusion coefficient of layer
, the concentration
is the value on the left side of the boundary
, the concentration
is the value of the concentration on the right side of the boundary
, and
is the partition coefficient of the migrant between the two layers. The diffusion equation is discretised with a full implicit cell-centred Finite Volume scheme of 2nd order in space and 1st order in time. The outer boundary of the layers
and
are modelled as no-flux boundaries. The implicit scheme makes it possible to choose large time steps for simulation (resulting in a feasible small simulation time) without running into numerical stability problems (see for example Baumann et al. Citation2006). For improvement of the accuracy, a grid refinement is used: for a fix number
, the first
grid cells near the boundaries are bisected. This bisection is repeated several times, so that the grid gets finer near the boundary and stays coarser in the middle of the layers. The resulting system of linear equations can be formulated as a tridiagonal matrix and is solved directly with a sparse form of the LU decomposition algorithm with partial pivoting (Kanzow Citation2005).
Diffusion coefficients
Diffusion behaviour of a substance in a polymer, depends on the substance and polymer properties and temperature as can be expressed by the Arrhenius relationship (Atkins and de Paula Citation2010). The Arrhenius equation describes the temperature dependence of the diffusion coefficient in a diffusion process. The equation was first proposed by J. H. van’t Hoff in 1884 and five years later Svante Arrhenius provided a physical justification and interpretation for it. Nowadays it should be better understood as an empirical relationship.
According to Arrhenius the diffusion coefficient of a substance in a polymer depends on the activation energy (EA) required to facilitate the cooperative motion of polymer and molecule, the temperature independent pre-exponential factor (D0) which is related to the intrinsic mobility of matrix and migrant and on the temperature (T). Polymer morphology, i.e. the amorphous and crystalline phases, shows a significant impact on the diffusion process which occurs predominantly in the amorphous phase of the polymer while the crystalline phase is impermeable for the migrant. To change a dissolved molecule’s place in the amorphous phase of a polymer requires the cooperative movement of both the polymer chain and the molecule. Movement ability of the polymer chain in the amorphous phase is related to its intrinsic mobility and free volume, and the mobility of the molecule is related to its size. Increasing the temperature will increase the Brownian motion of the molecule and the polymer matrix by relieving the diffusion process. Overall, the diffusion process can be understood as a random walk of molecules in the polymer matrix where the gradient in the chemical potential is the driving force.
Diffusion coefficients of migrants in polymers were estimated for the various scenarios investigated with Piringer’s estimation procedure (Begley et al. Citation2005), an Arrhenius type relationship, based on the mean value of the polymer specific constant of the polymer, the molecular mass of the migrant and the temperature.
Partition coefficients
In case of two non-miscible media in contact with each other, e.g. octanol in contact with water, a substance added to the system will partition between the two media such that at equilibrium the substance exhibits the same chemical potential in the two media resulting in two distinct equilibrium concentrations. The ratio of the two equilibrium concentrations gives the partition coefficient. Related to food contact materials partitioning occurs between the food contact layer, cP∞ (equilibrium concentration of the substance in the food contact layer) and the food (or food simulant), cF∞ (equilibrium concentration of the substance in the food), KP,F as well as between adjacent layers in multi-layer materials including set-off for materials stored in reels or in a stack.
The most pragmatic approach consists in estimating partition coefficients based on the solubility of the substance in the two media in contact; however solubility except in water are not readily available in the scientific literature.
Another practicable estimation procedure for partition coefficients is based on the log-log linear relationship between the octanol/water partition coefficient of a substance and the plastic/simulant partition coefficient. For the typical food simulants encountered in practice (e.g. ethanol 10%, ethanol 50%, ethanol 95% and vegetable oil) the log-log relationship was determined experimentally (Ozaki et al. Citation2010). More refined log-log relationships including allocation to individual food groups were developed in the EU-Project “FACET – FP7-KBBE 211686” (Seiler et al. Citation2014).
From published experimental data it can be concluded that partition coefficients are below 1 for migrants which are soluble in the food or simulating solvent and above 1000 for migrants which are not soluble in the food or simulating solvent (Hoekstra Citation2015). The values 1, 500, 1000 and 10000 have been used to cover the full range of foods in contact with repeated use materials or articles.
Repeated use model
The approach implemented in the food contact legislation of the Netherlands (Warenwetregeling verpakkingen en gebruiksartikelen 2017) was taken as starting point to develop and implement a more generic criterion which is used to decide whether the migration from repeated use plastic food contact materials to food can be considered negligible or not.
The following four factors R1 through R4 are introduced in the food contact legislation of the Netherlands for rubber:
relating to the relative contact surface area,
the contact temperature,
the contact time and
the number of times that the consumer article is reused.
Despite some efforts to trace back the design of the four R-factors, it was not possible to find out the scientific basis. The product of the four factors, called the “R-criterion” in the following, defines in which category the repeated use plastic food contact material falls.
Criterion R1 relates to the relative contact area (RA) between the rubber article and the foodstuff or beverage, expressed as cm2 of rubber area per kg of foodstuff or beverage. For a relative area less than or equal to 100 cm2/kg the value of R1 is determined by the formula:
From experience the following range of R1-values was considered relevant for repeated use food contact applications: 10 (100 cm2/0.1 kg); 5 (100 cm2/0.2 kg); 1 (100 cm2/1 kg); 0.1 (100 cm2/1 kg); 0.01 (100 cm2/10 kg)
Criterion R2 relates to the temperature at which the contact between the rubber product and the foodstuff or beverage takes place. For a temperature (T) expressed in °C lower than or equal to 130 °C, the value of R2 is determined by the formula:
It is assumed that a maximum temperature of 130°C was considered relevant for repeated use rubber articles. From experience the following range of R2-values was considered relevant for repeated use food contact applications: 0.5 (100 °C); 0.25 (70 °C); 0.158 (50 °C); 0.1 (30 °C); 0.05 (0 °C); 0.0316 (−20 °C). For some plastic materials like PET higher temperatures up to 175°C might be relevant and for others like PS temperatures are feasible only up to 70 °C.
Criterion R3 relates to the time t during which a rubber product is in contact with the foodstuff or beverage, expressed in hours. For a contact time shorter than or equal to 10 hours, the value of R3 is determined by the formula:
From experience the following range of R3-values was considered relevant for repeated use food contact applications: R3: 1 (10 h); 2 (5 h); 10 (1 h); 100 (0.1 h).
Criterion R4 relates to the number of consecutive times N that a particular rubber article is brought into contact with the foodstuffs or beverages. For a number of consecutive times N, R4 is calculated according to the formula:
From experience the following range of R4-values was considered relevant for repeated use food contact applications: 0.04; (N = 5000); 0.0625; (N = 4000); 0.11; (N = 3000); 0.25; (N = 2000); 1 (N = 1000); 4 (N = 500); 100 (N = 100); 10000 (N = 10).
The repeated use model for rubber foresees for all factors a cut-off limit depending on the value of the specific parameter, i.e. relative contact area (RA), temperature (T), time (t), number of consecutive uses (N). No reasonable justification was found in the Warenwet (Commodities Act) and no plausible scientific reasoning could by identified for the cut-off limits. Cut-off limits are designed such that for example with increasing temperature the factor R2 is not increasing any more, or with increasing contact time the factor R3 is not increasing any more. Because increasing temperature or contact time have an impact on the migration amount, i.e. to stay on the safe side from migration point of view and to not limit the applicability of the repeated use model for plastics, no cut-off limits were foreseen.
Based on the predicted migration of substance of different size, i.e. molecular mass, from the selected repeated use plastic food contact materials by migration modelling and related exposure, the applicability of the R-criterion is considered for the safety evaluation of repeated use plastic food contact materials in the context of existing or new materials.
In most of the practical cases the release of substances from plastic food contact materials to food is diffusion and partitioning controlled, for which reason the migration to food is proportional to the initial concentration of the migrant in the material. To account in the repeated use model for plastics this additional parameter with an impact on the migration to food, introduction of an additional factor R5 related to the initial concentration of the migrant in the material will be considered and discussed.
This study makes the assumption that the consumer fulfils the European consumption criteria, i.e. 1 kg food per person per day will be ingested.
Statistical evaluation
The selected range of simulation parameters (see chapter 4) for molecular weight, partition coefficients, contact time, amount of food, and number of repeated use covers the realistic range encountered in practice for these parameters. Looking to all scenarios with the same R-value but different factors R1 to R4, the migration expressed as mass fraction of migrant in food is exponentially distributed, this means the probability density function for the material is
, with
. Different percentiles p (with p = 95 %, 99 %, 99,9 %, 99,9999%) of the mass fraction distribution are computed for the single R-values, i.e. R is determined from the equation
with the different p values. This means the migration of p percent of the scenarios is below these R-values. To interpolate the values between the R-values obtained from the different scenarios and with the assumption, that with increasing R the migration increases as well, the percentile curve of the mass fraction over the R-values was extended to the convex hull of the percentiles of the individual R-values.
Results and discussion
To evaluate if and to which extent the rubber approach implemented in the Netherlands can be applied for repeated use plastic food contact materials simulations are computed for different scenarios covering a realistic range of the materials and parameters. Six polymers were selected:
two high diffusivity polymers (low density polyethylene and rubber),
two medium diffusivity polymers (polypropylene homopolymer and polyamide 6), and
two low diffusivity polymers (polyethylene terephthalate and polystyrene)
all of them in contact with
high solubility compounds (partition coefficient between plastic and food of 1 and 500) and
low solubility compounds (partition coefficient between plastic and food of 1000 and 10000) food
and containing
a small sized (molecular mass 100 g/mol),
two medium sized (molecular mass 250 g/mol and 500 g/mol), and
a large sized migrant (molecular mass 750 g/mol)
at a mass fraction of 0.1% of the polymer mass.
Diffusion coefficients were estimated by Piringer’s estimation procedure (Begley et al. Citation2005) from the polymer specific constant (AP = AP’ – tau/T) of the polymers, molecular mass of the migrants and temperatures selected.
The migrating amounts were estimated for the migrants selected (M = 100 g/mol, 250 g/mol, 500 g/mol and M = 750 g/mol) based on the reference mass fraction of 0.1%, the estimated diffusion coefficients of the migrants in the rubber and selected partition coefficients (K = 1, K = 500, K = 1000 and K = 10000) for the times (10, 1, 0.1 hours) and number of repeated uses (N = 1000, 100, 10). In the same time the corresponding R-criterion was calculated:
The migrating amounts were plotted against the R-criterion on a logarithmic scale. The R-criterion historically represents the threshold value at which the migrating amount of the substance of concern released from the food contact material under consideration to food is low enough such that no migration testing is required.
Migrating amounts of substances from food contact materials are associated with different safety concerns depending on the substances potential hazard and more precisely on its toxicology. The R-criterion is used to decide whether the migration from rubber food contact materials and more generally from plastic food contact material to food can be considered of no safety concern. Therefore, in the view of risk assessment the R-criterion should relate to the toxicology-based exposure threshold of the substance under consideration. In other words, if the safety concern related to the substance under consideration is low, a higher migrating amount and related consumer exposure and hence a higher R-criterion is acceptable and vice versa.
The Threshold of Toxicological Concern (TTC) approach is a screening and prioritisation tool for the safety assessment of chemicals when hazard data are incomplete and human exposure can be estimated. TTC is not applicable when compound specific assessment and toxicity data are available or are required under existing regulations (EFSA Citation2016).
Substances with known chemical identity can be allocated to a Cramer Class for example by one of the decision trees implemented in Toxtree (software available at: http://toxtree.sourceforge.net/). Assuming that the daily food consumption per person is 1 kg, if the entire amount of food is packaged in the material or article to be evaluated and the exposure to the substances is below the TTC for the corresponding substance, the probability of a health hazard is low.
If the R-criterion is below the threshold value for the corresponding Cramer Class, i.e. the consumer exposure related to the substance and the food contact material under investigation is of no safety concern, no migration testing is required.
Example calculation
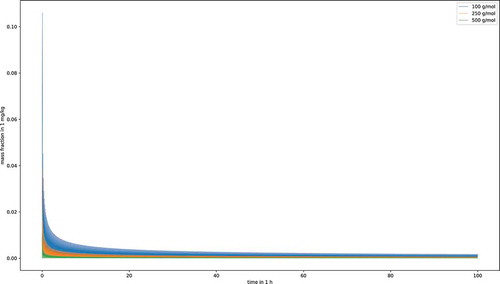
To exemplify the outcome of the migration simulation, one specific case, i.e. one single set of parameters, has been considered. The migration simulation results are shown in the Figure below. On the x-axis the total use time of a rubber article (2 mm thickness) is displayed and, on the y-axis, the migrating amount of three migrants (100, 250 and 500 g/mol) expressed as mass fraction in mg/kg food. The total use time sums up from the assumed 1000 repeated uses each of 0.1 hour. After each use the food in contact with the material is exchanged, for which reason the migration drops to zero from where it starts increasing until the next use. Over time the migrating amount within 0.1 h contact time decreases. The small migrant (blue line in the figure below) shows a migrating amount of > 0.1 mg/kg food after the first contact period which decreases after 200 uses (20 minutes in the figure below) to < 0.01 mg/kg food ().
The whole scenario is described by the following parameters:
rubber sheet:thickness = 2 mm density = 1.00 g/cm3
migrants:molecular mass 100, 250 and 500 g/mol
diffusion coefficients at 30 °C:1.264E-9 cm2/s (M = 100 g/mol)
1.712E-10 cm2/s (M = 250 g/mol)
1.558E-12 cm2/s (M = 500 g/mol)
initial concentration:1000 ppm
solubility:high (K = 1)
R1:1 (100 cm2/1 kg)
R2:0.1 (30 °C)
R3:0.01 (0.1 h)
R4:1 (N = 1000)
Figure 1. Migrating amount in mg/kg food repeated use at 30°C for 0.1 hour 1000 times
The results of the migration estimation and R-criterion calculation (first 30 rows from 962) are presented in the following Table for the rubber material with a thickness of 2 mm and the small size migrant with molecular mass of 100 g/mol with an initial concentration of 1000 mg/kg ().
The following figures are generated from the individual migration simulation results for the materials investigated. Each migration simulation result is associated to an R-value. On the x-axis the R+-criterion is plotted on a logarithmic scale against the migration expressed as weight fraction (w) in mg/kg food on the y-axis (quadratic scale). E.g. for a material with a surface area of 100 cm2 in contact with 1 kg food (R1 = 1) at 30 °C (R2 = 0.0997) for 10 hours (R3 = 1) and 5000 repeated uses (R4 = 0.04) an R-value of 0.004 corresponding to a migration result of 4.44 E-14 mg/kg food.
To get a better understanding the scenario investigated for each material was extended to a broader set of parameters (contact area, food amount, time, temperature, number of uses) considered from practice to be relevant for repeated use plastic food contact materials.
Rubber case example
The following boundary conditions were considered for migration prediction:
rubber sheet:thickness = 2 mm density = 1.00 g/cm3
AP’ = 8.1, tau = 0 (based on Tg ≈ −90 °C)
migrants:molecular mass 100, 250, 500, 750 g/mol
concentration:1000 ppm
solubility:K = 1, 500, 1000, 10000
R1:10 (100 cm2/0.1 kg); 5 (100 cm2/0.2 kg); 1 (100 cm2/1 kg); 0.1 (100 cm2/1 kg); 0.01 (100 cm2/10 kg)
R2:0.5 (100 °C); 0.25 (70 °C); 0.158 (50 °C); 0.1 (30 °C); 0.05 (0 °C); 0.0316 (−20 °C)
R3:1 (10 h); 2 (5 h); 10 (1 h); 100 (0.1 h)
R4:0.04; (N = 5000); 0.0625; (N = 4000); 0.11; (N = 3000); 0.25; (N = 2000); 1 (N = 1000); 4 (N = 500); 100 (N = 100); 10000 (N = 10)
Figure 2. Plot of logarithm of R-criterion against migrating amount in mg/kg food for rubber case
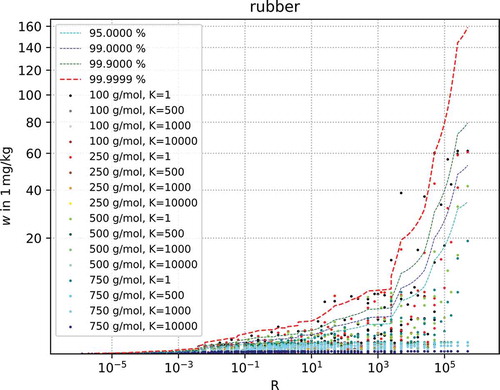
The migrating amounts are plotted in the above against the R-criterion on a logarithmic scale. Different percentiles p (with p = 95 %, 99 %, 99.9 %, 99.9999%) are computed for the single R-values. This means the migration of p percent of the scenarios are below these R-values.
The following R-criteria (99.9999 percentile) result, corresponding to the Cramer Classes related TTC:
For a substance which can be attributed to a Cramer Class which is present in a food contact rubber material under conditions of use resulting in an R-value which is below the corresponding R-criterion no migration testing is required. For example, if the substance under consideration belongs to Cramer Class III and the R-value resulting from the conditions of use of the food contact rubber is < 0.00398 no migration testing is required.
The same conclusion applies to the typical food contact polymers investigated below.
Low density polyethylene case example
The following boundary conditions were considered for migration prediction:
LDPE sheet:thickness = 2 mm density = 0.913 g/cm3
AP’ = 10, tau = 0 (acc. to Piringer publication)
migrants:molecular mass 100, 250, 500, 750 g/mol
concentration:1000 ppm
solubility: K = 1, 500, 1000, 10000
R1:10 (100 cm2/0.1 kg); 5 (100 cm2/0.2 kg); 1 (100 cm2/1 kg); 0.1 (100 cm2/1 kg); 0.01 (100 cm2/10 kg)
R2:0.5 (100 °C); 0.25 (70 °C); 0.158 (50 °C); 0.1 (30 °C); 0.05 (0 °C); 0.0316 (−20 °C)
R3:1 (10 h); 2 (5 h); 10 (1 h); 100 (0.1 h)
R4:0.04; (N = 5000); 0.0625; (N = 4000); 0.11; (N = 3000); 0.25; (N = 2000); 1 (N = 1000); 4 (N = 500); 100 (N = 100); 10000 (N = 10)
Figure 3. Plot of logarithm of R-criterion against migrating amount in mg/kg food for PP.homo case
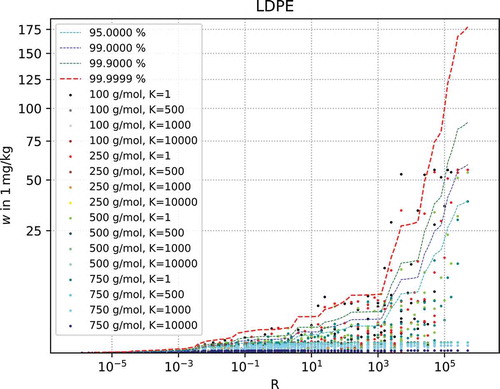
The migrating amounts are plotted in the above against the R-criterion on a logarithmic scale. The dots are the migration values of one scenario. Different percentiles p (with p = 95 %, 99 %, 99.9 %, 99.9999%) are computed for the single R-values. The convex hull of the percentiles are drawn as lines. This means the migration of p percent of the scenarios are below these R-values.
The following R-criteria (99.9999 percentile) result, corresponding to the Cramer Classes related TTC:
Polypropylene homopolymer case example
The following boundary conditions were considered for migration prediction:
PP sheet:thickness = 2 mm
density = 0.91 g/cm3
AP’ = 9.4, tau = 1577 (acc. to Piringer publication)
migrants:molecular mass 100, 250, 500, 750 g/mol
concentration:1000 ppm
solubility:K = 1, 500, 1000, 10000
R1:10 (100 cm2/0.1 kg); 5 (100 cm2/0.2 kg); 1 (100 cm2/1 kg); 0.1 (100 cm2/1 kg); 0.01 (100 cm2/10 kg)
R2:0.5 (100 °C); 0.25 (70 °C); 0.158 (50 °C); 0.1 (30 °C); 0.05 (0 °C); 0.0316 (−20 °C)
R3:1 (10 h); 2 (5 h); 10 (1 h); 100 (0.1 h)
R4:0.04; (N = 5000); 0.0625; (N = 4000); 0.11; (N = 3000); 0.25; (N = 2000); 1 (N = 1000); 4 (N = 500); 100 (N = 100); 10000 (N = 10)
Figure 4. Plot of logarithm of R-criterion against migrating amount in mg/kg food for PP.homo case
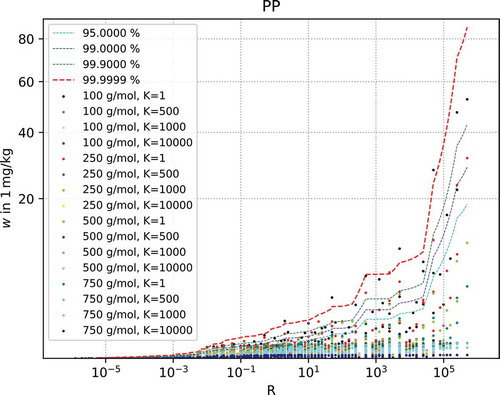
The migrating amounts are plotted in the above against the R-criterion on a logarithmic scale. Different percentiles p (with p = 95 %, 99 %, 99,9 %, 99,9999%) are computed for the single R-values. This means the migration of p percent of the scenarios are below these R-values.
The following R-criteria (99.9999 percentile) result, corresponding to the Cramer Classes related TTC:
Polyamide 6 case example
The following boundary conditions were considered for migration prediction:
PA6 sheet:thickness = 2 mm
density = 1.05 g/cm3
AP’ = −1.54, tau = 0 (acc. to Piringer publication)
migrants:molecular mass 100, 250, 500, 750 g/mol
concentration:1000 ppm
solubility:K = 1, 500, 1000, 10000
R1:10 (100 cm2/0.1 kg); 5 (100 cm2/0.2 kg); 1 (100 cm2/1 kg); 0.1 (100 cm2/1 kg); 0.01 (100 cm2/10 kg)
R2:0.5 (100 °C); 0.25 (70 °C); 0.158 (50 °C); 0.1 (30 °C); 0.05 (0 °C); 0.0316 (−20 °C)
R3:1 (10 h); 2 (5 h); 10 (1 h); 100 (0.1 h)
R4:0.04; (N = 5000); 0.0625; (N = 4000); 0.11; (N = 3000); 0.25; (N = 2000); 1 (N = 1000); 4 (N = 500); 100 (N = 100); 10000 (N = 10)
Figure 5. Plot of logarithm of R-criterion against migrating amount in mg/kg food for PA6 case
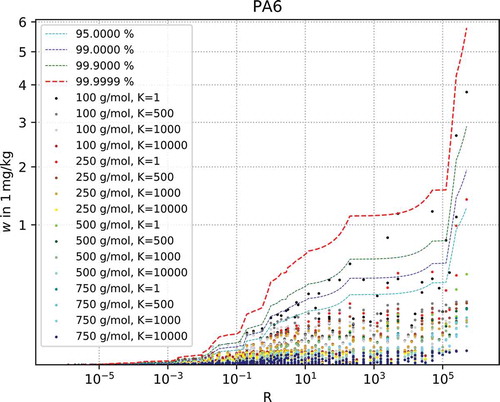
The migrating amounts are plotted in the above against the R-criterion on a logarithmic scale. Different percentiles p (with p = 95 %, 99 %, 99,9 %, 99,9999%) are computed for the single R-values. This means the migration of p percent of the scenarios are below these R-values.
The following R-criteria (99.9999 percentile) result, corresponding to the Cramer Classes related TTC:
Polyethylene terephthalate case example
The following boundary conditions were considered for migration prediction:
PET sheet:thickness = 2 mm
density = 1.38 g/cm3
AP’ = 2.2, tau = 1577 (acc. to Piringer publication)
migrants:molecular mass 100, 250, 500, 750 g/mol
concentration:1000 ppm
solubility:K = 1, 500, 1000, 10000
R1:10 (100 cm2/0.1 kg); 5 (100 cm2/0.2 kg); 1 (100 cm2/1 kg); 0.1 (100 cm2/1 kg); 0.01 (100 cm2/10 kg)
R2:0.5 (100 °C); 0.25 (70 °C); 0.158 (50 °C); 0.1 (30 °C); 0.05 (0 °C); 0.0316 (−20 °C)
R3:1 (10 h); 2 (5 h); 10 (1 h); 100 (0.1 h)
R4:0.04; (N = 5000); 0.0625; (N = 4000); 0.11; (N = 3000); 0.25; (N = 2000); 1 (N = 1000); 4 (N = 500); 100 (N = 100); 10000 (N = 10)
Figure 6. Plot of logarithm of R-criterion against migrating amount in mg/kg food for PET case
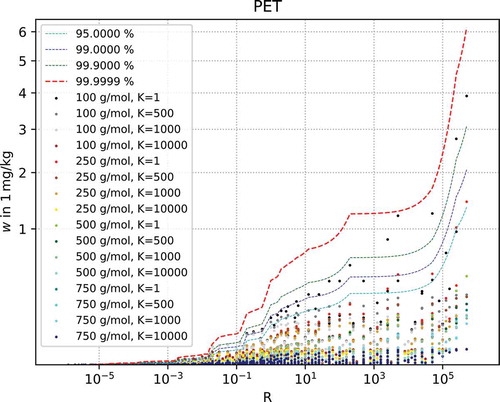
The migrating amounts are plotted in the above against the R-criterion on a logarithmic scale. Different percentiles p (with p = 95 %, 99 %, 99,9 %, 99,9999%) are computed for the single R-values. This means the migration of p percent of the scenarios are below these R-values.
The following R-criteria (99.9999 percentile) result, corresponding to the Cramer Classes related TTC:
Polystyrene case example
The following boundary conditions were considered for migration prediction:
PS sheet:thickness = 2 mm
density = 1.05 g/cm3
AP’ = −2.8, tau = 0 (acc. to Piringer publication)
migrants:molecular mass 100, 250, 500, 750 g/mol
concentration:1000 ppm
solubility:K = 1, 500, 1000, 10000
R1:10 (100 cm2/0.1 kg); 5 (100 cm2/0.2 kg); 1 (100 cm2/1 kg); 0.1 (100 cm2/1 kg); 0.01 (100 cm2/10 kg)
R2:0.5 (100 °C); 0.25 (70 °C); 0.158 (50 °C); 0.1 (30 °C); 0.05 (0 °C); 0.0316 (−20 °C)
R3:1 (10 h); 2 (5 h); 10 (1 h); 100 (0.1 h)
R4:0.04; (N = 5000); 0.0625; (N = 4000); 0.11; (N = 3000); 0.25; (N = 2000); 1 (N = 1000); 4 (N = 500); 100 (N = 100); 10000 (N = 10)
Figure 7. Plot of logarithm of R-criterion against migrating amount in mg/kg food for PS case
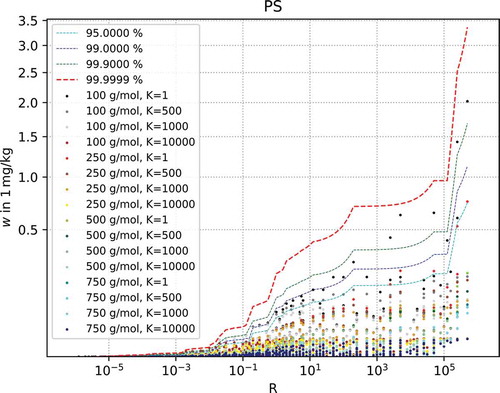
The migrating amounts are plotted in the above against the R-criterion on a logarithmic scale. Different percentiles p (with p = 95 %, 99 %, 99,9 %, 99,9999%) are computed for the single R-values. This means the migration of p percent of the scenarios are below these R-values.
The following R-criteria (99.9999 percentile) result, corresponding to the Cramer Classes related TTC:
Repeated use model extension
The initial concentration of the migrant in the material (cP,0) is not considered as a parameter in the classification approach and related R-criterion calculation implemented in the food contact legislation of the Netherlands. This is considered as a significant deficiency of the approach, because the migration of a substance to the contact medium which follows the law of diffusion is proportional to the initial concentration of the migrant in the material.
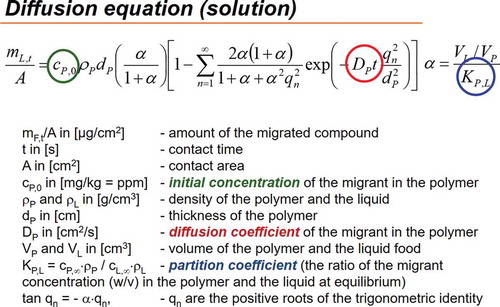
The initial concentration of the migrant (cP,0) is a multiplicative factor in the solution of the diffusion equation (Fick’s Second Law of Diffusion), reason for which an increase or decrease in the initial concentration will result in a proportional increase or decrease of the migration (mL,t/A), provided all other parameters are unchanged. This dependency becomes transparent in the case of the analytical solution of the diffusion equation for a monolayer plastic material in contact with a finite volume of a well-mixed liquid (diffusion process in the liquid is neglected) according to Crank (1975) ():
Figure 8. Analytical solution of diffusion equation for a monolayer material
Consequently, it should be considered in the repeated use model for plastics that the migration from plastic food contact materials to food is proportional to the initial concentration of the migrant in the material. The initial concentration of the migrant in the material expressed in mg/kg can be included as an additional parameter R5 in the calculation of the R-criterion to be calculated according to the formula:
The new R+-criterion is the product of the factors R1, R2, R3, R4 and R5:
The R+-criterion will show a proportional increase or decrease with an increase or decrease of the initial concentration. The R-criterion is equal to the R+-criterion for the initial concentration of 1000 mg/kg considered for all migrants in the migration simulations above, because the factor R5 = 1000/1000 = 1.
Experimental example
Experimental test and simulation of specific migration according to the predefined repeated use scenario by generally recognised diffusion models based on scientific evidence according to Article 18 in conjunction with Annexe V (migration modelling) of the plastics Regulation (EU) No 10/2011.
Sample
PP plaques (63 x 63 × 1 mm) from PP homopolymer with Irganox 1076 (CAS no 2082-79-3)
PP plaques (63 x 63 × 1 mm) from PP homopolymer with Metilox (CAS no 6386-38-5)
Conditions of use
Initial concentration
The initial concentration of the two migrants in the PP plaques was determined by repeated full extraction with ethyl acetate and quantified by LC/MS. Initial concentration of Irganox 1076 was determined at 1200 mg/kg plastic and of Metilox at 875 mg/kg plastic respectively.
Migration investigations
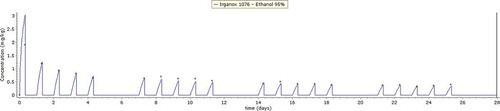
The migration tests were performed under repeated use conditions by full immersion of one plaque into 70 ml simulant, i.e. total contact area = 82 cm2 (both sides) as duplicate determination ().
The quantification of Irganox 1076 and Metilox was performed directly from the migration solution without sample workup by LC/MS based on external calibration (; ).
Figure 9. Migration of Irganox 1076 in ethanol 95% (K = 1). Experimental values as dots and migration simulation as blue curve
R+-criterion
For the experimental scenario the R+-criterion can be calculated based on the following parameters:
Contact area RA = 82 cm2 from which R1 = RA/100 = 82/100 = 0.82 results.
Testing temperature T = 60 °C from which R2 = 0.05 ⋅ exp(0.023 ⋅ 60) = 0.2 results.
Testing time t = 8 hours from which R3 = t/10 = 8/10 = 0.8 results.
Number of uses N = 20 from which log R4 = 6 – 2 ⋅ log 20 = 3.39794 or R4= 2500 results.
Initial concentration for Irganox 1076 is 1200 mg/kg from which R5 = 1200/1000 = 1.2
Due to the relatively small number of repeated uses (N = 20) the value of R4 is high for which reason the R+-criterion for PP indicates that migration testing is required for Irganox 1076. In the case where the number of repeated uses is extended to a daily use over two years (N = 730) the R4-value is 1.88 which indicates that for a substance belonging to Cramer Class I no migration testing is required.
The experimentally determined migration after N = 20 uses and the related consumer exposure of 0.4 mg/person/day (1 kg of food consumed per day) is already well below 1.8 mg/person/day and is even lower after N = 730 uses. This demonstrates the applicability of the repeated use model based on the R+-criterion.
Conclusions and outlook
The comparison between the R+-criterion and related migration for the range of polymers (based on diffusion properties), migrants (based on molecular mass) and foods (based on partition coefficients) demonstrates that for a typical sample thickness of 2 mm and an initial concentration of low molecular weight substances in plastics of 1000 ppm (mg/kg material) the migration from the plastics correlates with the R+-criterion. It can be concluded that for repeated use plastic food contact materials the approach implemented in the national legislation of the Netherlands for rubber can be extended to plastics as well.
The R+-criterion must take into consideration the toxicological hazard (when administered orally) which can be estimated by the Cramer Class from the molecular structure. On the other hand, the R+-criterion depends on the type of plastic considered due to different migration rates of components in polymers and related consumer exposure.
In repeated use food contact applications for a rubber article for example,
the migration of a component belonging to Cramer Class III can be considered negligible and no migration evaluation may be required, if the R+-criterion is less than 0.00398.
In case the R+-criterion is greater than 0.00398 migration evaluation by tests or modelling is mandatory.
gives a summary of the R+-criterion for various plastics (LDPE, Rubber, PP, PA6, PET and PS) below which no migration testing may be required depending on the Cramer Class of the migrant.
Table 1. Summary (first 30 rows from 962) of calculation for migrant with molecular mass of 100 g/mol (migration amount > 0.09 mg/kg food marked in red) for rubber
Table 2. Repeated use scenario
Table 3. Migration of Irganox 1076 in ethanol 95% (repeated use time/temperature scenario)
Table 4. R+-criterion for plastics below which no migration testing may be required depending on the Cramer Class of the migrant
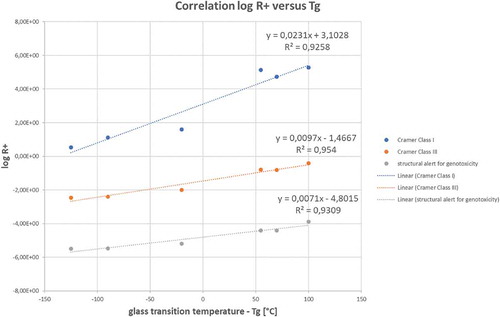
The R+-criterion correlates with the migrating amount of substance. For a given Cramer Class the value of the R+-criterion increases from high diffusivity polymers like LDPE (low Tg) to low diffusivity polymers like PS (high Tg), because migrating amounts decrease with decreasing diffusivity of the plastic. Therefore, the lower the diffusivity of a polymer the higher the cut-off value (R+-criterion) is at which migration is below the threshold value and no migration testing is required.
Furthermore, for a lower TTC threshold value a lower migration is acceptable and therefore a lower R+-criterion applies.
For plastics not considered the R+-criterion can be interpolated for substances belonging to a specific Cramer Class from the linear correlation of the log R+-criterion with the glass transition temperature of the plastic to be considered ().
Figure 10. Correlation of log R+-criterion versus glass transition temperature (Tg) of the polymer
Because no cut-off limits were considered for the individual parameters (RA, T, t, N, cP,0) the applicability of the repeated use model for plastics is not limited from a parameter point of view. However, the applicability of the repeated use model beyond the parameter bandwidth investigated by migration modelling should be considered carefully and validated by experimental testing:
thickness of material:< 2 mm
initial concentration:< 1000 ppm (no swelling)
migrant molecular mass:< 1000 g/mol
partitioning (K):< 1000000
R1:10 (100 cm2/0.1 kg); 5 (100 cm2/0.2 kg); 1 (100 cm2/1 kg); 0.1 (100 cm2/1 kg); 0.01 (100 cm2/10 kg)
R2:0.5 (100 °C); 0.25 (70 °C); 0.158 (50 °C); 0.1 (30 °C); 0.05 (0 °C); 0.0316 (−20 °C)
R3:1 (10 h); 2 (5 h); 10 (1 h); 100 (0.1 h)
R4:0.04; (N = 5000); 0.0625; (N = 4000); 0.11; (N = 3000); 0.25; (N = 2000); 1 (N = 1000); 4 (N = 500); 100 (N = 100); 10000 (N = 10)
R5:1 ((1000 mg/kg)/1000)
Furthermore, the applicability of the repeated use model is limited to the boundary conditions of the migration model used to generate the migration values.
Limitations
Identifying migration risk and potential safety concerns in the early stage of material development should facilitate a dedicated selection of materials which exhibit the required technical properties under application conditions.
Migration modelling has been used to predict migration from various plastic food contact materials under different repeated use scenarios. This implies that the migration process follows the law of diffusion based on migrant mass and migrant diffusion coefficients which are constant over time. This will not be the case where the boundary condition of the diffusion model are not respected, i.e. swelling of the plastic food contact material by the food or food simulant which will cause changing diffusion coefficients over time due to plasticising effect or decomposition of the material resulting in increased migrant mass over time.
The R+-value as derived in this work can be applied only if material swelling and/or material decomposition are negligible.
Migration is decreasing with the number of uses which is considered in the R-value approach by the factor R4. For items which are used only several times, e.g. only up to ten (10) times a higher risk of exceeding the applicable restriction can be expected during the total time period of use compared to materials which are used thousands of times before they are replaced. In cases an item is used only a few times (e.g. 10 times) and then replaced, the average exposure over those 10 times should be below the TTC. Validation of the risk assessment by migration modelling by use of moderate overestimating diffusion properties, i.e. mean value plus standard deviation for the material and/or validation by a minimum of dedicated experimental testing is strongly recommended.
Declaration of interest statement
The authors declare that they have no conflict of interest.
Acknowledgements
The authors gratefully acknowledge financial support by PlasticsEurope AISBL Risk Assessment Repeated Use Working Group (RARU).
References
- Atkins PW, de Paula J. 2010. Physical Chemistry. 9th. Oxford: Oxford University Press.
- Baumann WW, Bunge U, Frederich O, Schatz M, Thiele F. 2006. Finite-volumen-methode in der numerischen thermofluiddynamik, technical report/Scriptum Universität Berlin. https://www.cfd.tu-berlin.de/Lehre/CFD2/skript/fvm-skript.pdf(lookup2019-09-17)
- Begley T, Castle L, Feigenbaum A, Franz R, Hinrichs K, Lickley T, Mercea P, Milana M-R, O’Brien A, Rebre S, et al. 2005. Evaluation of migration models that might be used in support of regulations for food-contact plastics. Food Addit Contam. 22:73–90.
- Brandrup J, Immergut EH, Grulke EA, Abe A, Bloch DR. 2003. Polymer Handbook. 4th. Hoboken (NJ): Wiley & Sons. ISBN 978-0-471-47936-9.
- Brandsch R. 2017. Probabilistic migration modelling focused on functional barrier efficiency and low migration concepts in support of risk assessment, food addict. Contam Part A. doi:10.1080/19440049.2017.1339235.
- Cramer GM, Ford RA, Hall RL. 1978. Estimation of toxic hazard - a decision tree approach. J Cosmet Toxicol. 16:255–276. Pergamon Press.
- Crank, J. 1975. The Mathematics of diffusion, Oxford: Clarendon Press. ISBN: 9780198533443
- EFSA [European Food Safety Authority] and WHO [World Health Organization]. 2016. Review of the Threshold of Toxicological Concern (TTC) approach and development of new TTC decision tree. EFSA Supp Public. 2016(EN–1006):50.
- Hoekstra E, Ed.. 2015. Practical guidelines on the application of migration modelling for the estimation of specific migration. JRC Technical Reports. EUR 27529 EN, Ispra, Italy.
- Kanzow C. 2005. Numerik linearer Gleichungssysteme: direkte und iterative Verfahren. Berlin/Heidelberg: Springer.
- Ozaki A, Grunar A, Störmer A, Brandsch R, Franz R. 2010. Correlation between partition coefficients polymer/food simulant, KP,F, and Octanol/ Water,Log POW – a new approach in support of migration modeling and compliance testing. Deut Lebensm rundsch. 106:203–208.
- Piringer O-G, Baner AL, Ed. 2008. Plastic packaging materials for food. barrier function, mass transport, quality assurance and legislation- interactions with food and pharmaceuticals. 2nd ed. Weinheim (New York): WILEY-VCH.
- Poças MF, Oliveira JC, Brandsch R, Hogg T. 2012. Analysis of mathematical models to describe the migration of additives from packaging plastics to foods. J Food Process Eng. 35:657–676. doi:10.1111/j.1745-4530.2010.00612.x.
- Roduit B, Borgeat CH, Cavin S, Franginiere C, Dudler V. 2005. Application of Finite Element Analysis (FEA) for the simulation of release of additives from multilayer polymeric packaging structures. Food Addit Contam. 22:945–955.
- Seiler A, Bach A, Driffield M, Paseiro Losada P, Mercea P, Tosa V, Franz R. 2014. Correlation of foodstuffs with ethanol-water mixtures with regard to the solubility of migrants from food contact materials. Food Addit Contam. 31:498–511.
- Umweltbundesamt – UBA. 2008 Oct. Leitlinie zur mathematischen Abschätzung der Migration von Einzelstoffen aus organischen Materialien in das Trinkwasser (Modellierungsleitlinie); Stand: 7.
- Welle F. 2012. A new method for the prediction of diffusion coefficients in poly(ethylene terephthalate). J Appl Polym Sci. doi:10.1002/app.38885.