
ABSTRACT
A method for the determination of deoxynivalenol (DON) and its major conjugates in cereals was developed including an immunoaffinity column (IAC) clean-up coupled in-line with high-performance liquid chromatography, post-column derivatisation and fluorescence detection. An IAC for DON with cross-reactivity to 15-AcDON, 3-AcDON and DON-3-G enabled this approach. The isolated analytes were introduced into the chromatographic system without aliquotation employing the hot water elution technique, resulting in the desired low LOQ values for monitoring these analytes in cereals. The absence of any organic solvent during sample preparation in combination with an in-line IAC clean-up renders the method simple, fast, and environmentally friendly. Special attention was paid to inherent IACs properties such as cross-reactivity, analytes’ competition and capacity. The method was applied to determine DON and its major conjugates in barley, wheat and maize in the range of 10–1000 µg kg−1 of DON, 10–300 µg kg−1 of DON-3-G and 15-AcDON and 10–100 µg kg−1 of 3-AcDON. The apparent recoveries varied from 87% to 110% (average of 98%) and the intermediate precision was below 13.5% RSD (except for DON-3-G in wheat). Fifteen maize, wheat and barley samples were analysed revealing levels of DON conjugates that accounted from 9% to 60% of the “total DON” content (m/m). In general, the frequency and the measured mass fractions decreased in the following order: DON>DON-3-G>15-AcDON>3-AcDON.
GRAPHICAL ABSTRACT
Introduction
Contamination of food and feed with mycotoxins is a long-lasting topic of worldwide concern both due to their negative human/animal health effects and the economic losses associated with spoilt goods (Josephs et al. Citation2004; Broekaert et al. Citation2013). Acute deoxynivalenol (DON) poisoning via the food can cause abdominal distress (such as emesis, diarrhoea and melaena), whereas chronic exposure may lead to anorexia, growth retardation, immune system dysregulation, and impaired reproduction and development (Boevre et al. Citation2013; Broekaert et al. Citation2013; EFSA Citation2013).
DON is the most ubiquitous trichothecene in cereals and the one reaching the highest amounts (EFSA Citation2013; Suman et al. Citation2013; Gratz Citation2017). The acetylated derivatives, 3-acetyl-DON (3-AcDON) and 15-acetyl-DON (15-AcDON) are intermediate fungal metabolites in the biosynthesis of DON and are often encountered alongside with DON in cereal commodities (Berthiller et al. Citation2013; EFSA Citation2013). Cereal crops infected with DON-producing fungi (mainly Fusarium spp) are capable of metabolising this mycotoxin by conjugating it with a glucose moiety. The resulting deoxynivalenol-3-glucoside (DON-3-G) is then expelled from the cytosol and sequestered in the vacuole (Berthiller et al. Citation2011; Desmarchelier and Seefelder Citation2011; Stroka and Gonçalves Citation2019). However, DON-3-G and the acetylated derivatives are partially hydrolysed back into DON during mammalian digestion (Desmarchelier and Seefelder Citation2011; Boevre et al. Citation2012; Berthiller et al. Citation2013; EFSA Citation2013; Broekaert et al. Citation2015; Nagl and Schatzmayr Citation2015; Kovač et al. Citation2018). Due to this property, they are referred to as “masked” or “modified DON” and they contribute to the “total DON” exposure (Rychlik et al. Citation2014).
The joint FAO/WHO Expert Committee on Food Additives (JECFA) considered the toxicity of 3-AcDON and 15-AcDON as equal to that of DON, whereas DON-3-G was not included in the group provisional maximum tolerable daily intake (PMTDI) of 1 µg kg-1 b.w. due to a lack of toxicological data (Codex Alimentarius Commission Citation2011).
A number of studies, some with a pan-European coverage, have reported the presence of masked DON in cereals (European Commission Citation2003; EFSA Citation2013). The European Food Safety Authority (EFSA) conducted a survey on the presence of DON, 3-AcDON, 15-AcDON and DON-3-G in food in 21 Member States and Norway between 2007 and 2012 (EFSA Citation2013). DON was found in 44.6%, 43.5% and 75.2% of unprocessed grains of undefined end-use, food and feed samples, respectively. The average mass fractions of 3-AcDON and 15-AcDON in unprocessed grains of undefined end-use were 12.8 and 48.5 μg kg−1, respectively, while these contaminants were quantified in <5% of the food samples. In maize grains, the average mass fractions of 3-AcDON and 15-AcDON were 19.5 and 65.4 μg kg−1, respectively. The average relative mass contribution of 3-AcDON and 15-AcDON to the sum of DON and its derivatives in maize grains ranged from 2% to 20% and from 10% to 15%, respectively (EFSA Citation2013). Very few data (177 analytical results from one Member State) were available for DON-3-G. Around 5% of the samples contained DON-3-G and represented on average 5.6% of the lower bound sum of DON and DON-3-G (EFSA Citation2013). DON conjugates could make up to 70% of the DON mass fraction and in special cases DON-3-G alone exceeded the amount of DON (Berthiller et al. Citation2013).
EFSA recommended a harmonised monitoring of DON conjugates in order to better characterise their potential contribution to the total exposure to DON and hence to enable a thorough risk assessment. This was welcomed by the European Commission (EU Citation2011) as knowledge on all relevant DON conjugates is essential for a sound risk assessment (Kovač et al. Citation2018).
Different approaches have been proposed to determine the total amount of DON in food samples, each one with its pros and cons: indirect (involving chemical or enzymatic hydrolysis), immunochemical and chromatographic methods and their combinations (Malachová Citation2013; Malachová et al. Citation2015).
The chromatographic methods published up to now for the determination of DON and its derivatives in food samples are mostly based on liquid chromatography-tandem mass spectrometry (LC-MS/MS) and do not cover all relevant analytes (Sulyok et al. Citation2006; Vendl et al. Citation2010; Desmarchelier and Seefelder Citation2011; Cirlini et al. Citation2012; Simsek et al. Citation2012; Suman et al. Citation2013; Broekaert et al. Citation2015) with a few exceptions (Boevre et al. Citation2012; Zhao et al. Citation2014; Scarpino et al. Citation2019).
In 2014, Stroka and Seidler (Citation2014) proposed the principle of hot water elution for the immunoaffinity purification of DON from maize samples. In this paper, we have expanded that concept developing a method for the determination of DON along with its major conjugates without resorting to mass spectrometry. IACs for DON with sufficient cross-reactivity to all relevant conjugates were coupled in-line with high-performance liquid chromatography (HPLC) followed by post-column derivatisation (PCD) via the Hantzsch reaction (Sano et al. Citation1987) and fluorescence detection (FLD). HPLC-FLD systems are widely available in control laboratories and the methodology benefits from high selectivity and sensitivity provided by both the IAC clean-up and detection of a highly fluorescent derivative yielded after post-column derivatisation (Muscarella et al. Citation2012). Furthermore, the hot water elution approach enables the quantitative transfer of the whole purified IAC eluate into the chromatographic system improving dramatically the sensitivity of the method (Stroka and Seidler Citation2014). Additional advantages are the absence of any organic solvent in the sample preparation step, avoidance of evaporation and reconstitution of the extracts (cutting down the number of analytical steps) and the possibility to be automated (Stroka and Seidler Citation2014). Moreover, it is widely recognised that optical detectors as the FLD are fairly tolerant to matrix effects as long as the co-extractives are chromatographically resolved or have different maximum absorbance/emission wavelengths.
This study demonstrates how a rather straightforward method principle could be used to gather information on the co-occurrence of DON, DON-3-G, 3-AcDON and 15-AcDON in cereal samples. This approach is the first describing the simultaneous determination of DON and its conjugates by optical detection in compliance with the EU requirements for mycotoxins monitoring. The feasibility and key aspects of this strategy such as cross-reactivity, competition and blank IACs have been discussed in depth before (Gonçalves and Stroka Citation2016). After in-house validation, the method was applied to analyse 15 barley, wheat and maize samples where the analytes of interest have been previously identified using a multi-mycotoxin LC-MS/MS screening method.
Materials and methods
Materials and reagents
The present paper is a continuation of the previous study devoted to the characterisation of the cross-reactivity of various DON IACs aiming at the simultaneous analysis of DON and its major conjugates in cereal samples (Gonçalves and Stroka Citation2016). Therefore, partially the same materials, reagents and instrumental setup have been used. Thus, these sections are shortened in this paper. The solvents used in the preparation of the HPLC mobiles phases, the post-column derivatisation reagents and the analytical standards were purchased from Merck (Darmstadt, Germany), Acros Organics (Geel, Belgium) and Romer Labs (Tulln, Austria), respectively. A mixed stock solution for calibration purposes was prepared from the individual standards at the following concentrations: DON 1 mg L−1; DON-3-G and 15-AcDON 300 µg L−1 each, and 3-AcDON 100 µg L−1. According to our previous study, only the immunoaffinity column DONTest WB (Vicam, Milford, USA) showed sufficient cross-reactivity to enable the concomitant determination of DON and all relevant conjugates, therefore this IAC was selected to establish and validate a method for the determination of these mycotoxins in cereal samples. Oasis HLB cartridges (200 mg, 6 mL) from Waters (Milford, USA) were used to enrich the analytes for confirmatory analysis by LC-MS/MS.
Sample preparation
Cereal samples (barley, wheat and maize, five samples each) known to contain variable levels of DON were kindly supplied by the Department for Agrobiotechnology (IFA-Tulln) of the University of Natural Resources and Life Sciences, Vienna, Austria. The samples were milled with a Retsch centrifugal mill, Model ZM 200 (Retsch GmbH, Haan, Germany) to pass a sieve of 1 mm and stored at 4°C until analysis. Test portions of these samples were extracted with Milli Q water according to Stroka and Seidler (Citation2014) and purified with IACs as described by Gonçalves and Stroka (Citation2016). Briefly, 20 g sample aliquots were extracted with 100 mL water in 250 mL Nalgene PPCO bottles by shaking for 1 h in a reciprocating shaker GFL 3018 (Labortechnik mbH, Burgwedel, Germany). Subsequently, the samples were centrifuged at 3200 g for 5 min and filtered through folded filter paper Whatman 113 V (Whatman Int., Maidstone, England). Two mL of the filtered extract were diluted to 10 mL and percolated quantitatively through the IACs. In preliminary experiments, 10 mL raw extract was directly applied onto the IACs. Later on, this volume was reduced to 2 mL to avoid the IAC overload. Next, the IACs were washed with 5 mL of Milli Q water. The in-line hot water elution of the analytes was performed as described in the section below.
For confirmation of the analytes’ identity by LC-MS/MS, 2 mL of the extract were diluted to 10 mL with Milli Q water and percolated through an Oasis HLB cartridge, previously conditioned with 5 mL of methanol and 5 mL of water. The cartridge was then washed with 2 mL of water, dried under vacuum for 15 min and eluted with 4 mL of methanol. The eluate was evaporated to dryness under a gentle stream of nitrogen and redissolved with 200 µL of methanol/aqueous acetic acid 0.1% + ammonium acetate 1 mM (20:80) solution.
In-line hot water elution and chromatographic analysis
DON and its conjugates were analysed by HPLC-PCD-FLD. The chromatographic system (Gilson, Villiers Le Bel, France), the post-column derivatisation module (Pickering, CA, USA), the detector (Waters, Milford, USA) and the data acquisition system (Gilson, Villiers Le Bel, France) were described in detail before (Gonçalves and Stroka Citation2016). The only instrumental modification relative to a regular chromatographic system was the installation of a 2.1 mL injection loop. The in-line elution from the IAC into the HPLC was performed as follows:
the IAC was loaded with 1.5 mL of Milli Q water, capped and placed in a Huber thermostatic bath (Offenburg, Germany) at 85 ºC for 5 min. This leads to the denaturation of the antibodies and thus to the release of the mycotoxins into the water;
immediately after, the content of the IAC was quantitatively transferred into the injection loop, applying positive pressure on the IAC;
400 µL of Milli Q water were additionally added to the IAC and forced into the loop. Care was taken that the total applied volume was below the capacity of the injection loop;
after a 1-min waiting period to allow the injection loop to cool down the chromatographic separation was started by flushing the whole loop content onto the HPLC column with mobile phase.
The analytes were resolved with a Zorbax SB C18 column (25 cm x 4.6 mm i.d., 5 µm particle size) using a gradient of water and acetonitrile. The dead volume time of the system was approximately 4 min at a mobile phase flow rate of 1 mL min−1. The detection of DON and its conjugates was accomplished after specific alkaline hydrolysis to formaldehyde and subsequent formation of a fluorescent dihydropyridine derivative according to the Hantzsch reaction (Hantzsch Citation1881; Saini et al. Citation2008). The reagents used and the respective derivatisation conditions were described in detail in a previous publication (Gonçalves and Stroka Citation2016).
Results and discussion
Preliminary optimisation of the separation, detection and in-line elution step
The adequate chromatographic separation of 15-AcDON and 3-AcDON is known to be challenging. Four analytical columns were tested: Discovery C18 from Supelco (Bellefonte, PA, USA), Luna Phenyl-hexyl from Phenomenex (Torrance, CA, USA) and Zorbax SB C18 from Agilent (Palo Alto, CA, USA), all of them with 25 cm x 4.6 mm i.d., 5 µm particle size and the last one also in the 15 cm format. The Discovery C18 column was not suitable since the acetyl derivatives coeluted. The Luna Phenyl-hexyl column offered the best resolution of these two isomers at the cost of a broader peak shape for DON-3-G. Zorbax SB C18 provided a satisfactory resolution of the above-mentioned isomers preserving the peak shape of DON-3-G. The 15 cm Zorbax column did not provide enough resolution for this analysis. Therefore, the Zorbax SB C18 25 cm column was chosen. Figure 1S (Supplementary material) shows representative chromatograms obtained with all the tested columns.
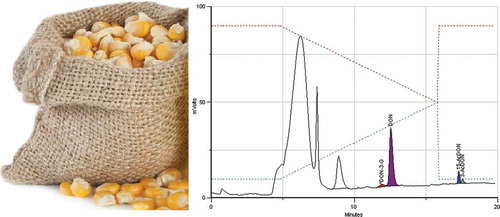
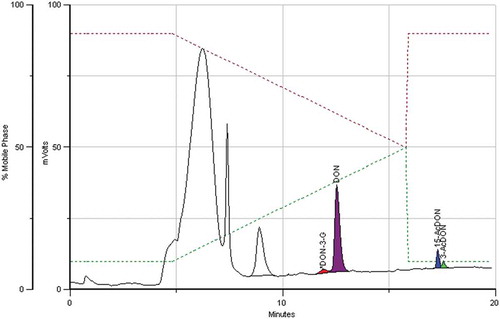
Figure 1. IAC-HPLC-PCD-FLD chromatogram of a standard equivalent to 100/30/10 μg kg−1 of DON/DON3 G and 15-AcDON/3-AcDON.
As acetoacetanilide has been demonstrated to be a promising Hantzsch coupling reagent in terms of reactivity at low temperatures, selectivity and fluorescence yield (Li et al. Citation2007), this reagent (acetoacetanilide 0.05 M + ammonium acetate 2 M in 40% aqueous ethanol) was tested in comparison to the more commonly used methyl acetoacetate (Buttinger and Krska Citation2003; Muscarella et al. Citation2012). Acetoacetanilide provided a signal intensity improvement of 17% for the AcDONs, on average, but it was accompanied by a surprising signal decrease of 9% on average for DON and DON-3-G. Taking also into account the considerably higher system backpressure due to the reagents’ higher viscosity in addition to a pronounced baseline drift, methyl acetoacetate was finally chosen. The reaction temperature for derivatisation was tested between 80 and 130ºC. A signal intensity increase of approximately 50% (average for the four investigated analytes) was observed when rising the temperature from 110ºC to 120ºC, which remained stable until 130ºC. Therefore, 120ºC was applied in subsequent experiments. It was also demonstrated that using a 0.3 M NaOH solution the signal intensity of DON and DON-3-G improved by more than 12% compared to a 0.15 M NaOH solution (Stroka and Mischke Citation2007; Muscarella et al. Citation2012). A further increase up to 0.5 M NaOH resulted in a decrease of the signal intensity. Therefore, a 0.3 M NaOH solution was used in subsequent studies as Reagent 1 in the PCD.
Temperature and incubation time are critical parameters for an efficient and complete hot water desorption of the analytes from the IAC. It was demonstrated that an incubation temperature of 70ºC was rather inefficient (recoveries <5%), and desorption at 80ºC was still incomplete (recoveries of 44–90%). Employing 85 ºC resulted in a quantitative elution of all four analytes. Furthermore, an experiment was conducted to test the thermal stability of DON and its conjugates during IAC heating. DON-3-G proved to be stable at 85ºC up to 120 min, while an 11% and 18% conversion of 3-AcDON and 15-AcDON to DON, respectively, was observed during this prolonged heating period. In summary, hot water elution is an efficient and convenient strategy, but the IACs must be kept at a sufficiently high temperature for the shortest period of time that enables a quantitative elution of the analytes without their degradation (5 min). Furthermore, the eluate has to be transferred immediately (within ≈ 30 s) into the injection loop, to preclude unspecific re-adsorption of the analytes onto the IAC substrate (agarose gel).
Optimised procedure for the determination of DON and its conjugates
After the optimisation described above, the method allowed a straightforward analysis of DON and its conjugates in cereals, avoiding any manipulation of the IAC eluate (in-line desorption) resulting in good precision and sensitivity. In contrast to what is often observed in chromatographic systems using large injection volumes, the chromatographic resolution was not deteriorated by injecting 1.9 mL of IAC eluate. This was due to the fact that the water loaded into the injection loop had a significant lower eluotropic power than the mobile phase, focussing the analytes in the column head prior to separation.
Only the DONTest IAC retained 15-AcDON with good performance in addition to the other three analytes as discussed thoroughly before (Gonçalves and Stroka Citation2016). Additionally, the affinity of the immobilised antibodies to the analytes is not equal for all of them and competition may take place. These effects had to be taken into account when designing a method for the determination of all four DON forms in cereal samples. In particular, the aliquot volume of the sample extract used for IAC clean-up and the relative amounts of the four analytes had to be considered.
As a result, the sample extract aliquot was reduced to 2 mL, instead of 10 mL, limiting the maximum load of DON to 400 ng for a sample contaminated at 1000 µg kg−1. Thereby, the IAC was loaded with less matrix components and the amount of DON remained sufficiently below the IAC’s maximum capacity (1250 ng). Furthermore, the calibration range of the individual analytes was adjusted to: 10–1000 µg kg−1 for DON (load of 4 to 400 ng); 6–300 µg kg−1 for DON-3-G and 15-AcDON (load of 2.4 to 120 ng) and 5–100 µg kg−1 for 3-AcDON (load of 2.0 to 40 ng) minimising competition and loss of linearity. An illustrative chromatogram of a standard equivalent to 100 μg kg−1 of DON, 30 μg kg−1 of DON-3-G and 15-AcDON, and 10 μg kg−1 of 3-AcDON is shown in . These ranges were defined taking into consideration the expected amounts and the relative abundance of the four analytes, as derived from the literature including 806 samples of maize, wheat, barley, rice, oats and rye (Boevre et al. Citation2012; Soleimany et al. Citation2012; Yoshinari et al. Citation2012; Abia et al. Citation2013; Mishra et al. Citation2013; Rodríguez-Carrasco et al. Citation2013; Juan et al. Citation2014; Pereira et al. Citation2014). This survey resulted in relative mass fractions of DON conjugates in relation to DON of: 14.8% for DON-3-G; 4.6% for 15-AcDON and 5.5% for 3-AcDON. Furthermore, 90% of the samples showed levels of DON < 533 µg kg−1; DON-3-G < 29 µg kg−1; 15-AcDON <17 µg kg−1 and 3-AcDON <1.0 µg kg−1 which confirms that the selected working range is suitable to analyse the majority of samples in routine control.
Validation results
The method has been in-house validated to demonstrate its compliance with the method performance requirements laid down by Commission Regulation (EC) No 401/2006 (European Commission Citation2006a). The obtained figures of merit can be found in and . For simplifying the estimation, the limits of detection (LODs) were calculated as the mass fraction of the analytes that produced a chromatographic peak obtained from spiked samples with a signal-to-noise (S/N) ratio of 3, while the limits of quantification (LOQs) were similarly estimated with a S/N of 10. The LOQs were verified in practice by duplicate analysis of maize, wheat and barley blanks spiked at the estimated levels. The obtained LOQs (10 µg kg−1 for the four analytes) are well below the lowest maximum limit for DON in food laid down by EU legislation (200 µg kg−1 in baby food) (European Commission Citation2006b) and allow monitoring of DON conjugates at levels recommended by EFSA and JECFA for exposure assessment. The LODs achieved were similar or lower than those reported in the literature for procedures based on GC-MS (Lattanzio et al. Citation2009; Capriotti et al. Citation2012; Broekaert et al. Citation2013), HPLC-FLD (Lattanzio et al. Citation2009; Capriotti et al. Citation2012; Muscarella et al. Citation2012; Broekaert et al. Citation2013) and LC-MS/MS (Berthiller et al. Citation2005; Sulyok et al. Citation2006; Lattanzio et al. Citation2009; Vendl et al. Citation2009; Capriotti et al. Citation2012; Broekaert et al. Citation2013; Suman et al. Citation2013; Zhao et al. Citation2014; Romera et al. Citation2018; Scarpino et al. Citation2019). The low detection thresholds of the described method are a consequence of the complete injection of the IAC eluate into the chromatographic system, combined with both the selectivity and sensitivity provided by post-column derivatisation with fluorescence detection. This feature allowed to lower the LODs fourfold compared to a similar method with a solid-phase extraction (SPE) clean-up (Muscarella et al. Citation2012).
Table 1. Figures of merit of the developed method for the simultaneous determination of DON and conjugates by IAC in-line with HPLC-PCD-FLD.
The recoveries of the IAC column were calculated as the ratio of the slopes of a calibration in Milli Q water versus the corresponding calibration with standards in pure solvent. Matrix effects were estimated as the ratio of the slopes of matrix-matched calibration curves (barley, wheat and maize) versus a calibration in Milli Q water. The recoveries () indicate an almost quantitative procedure and matrix effects are not significant (α – 0.05) based on the confidence interval of the slopes of the linear calibration functions (except for 3-AcDON in wheat, bias 14%). 3-AcDON is generally the least frequently detected DON conjugate and quality control will enable to compensate this matrix effect. The apparent recoveries in cereal matrices varied from 87% to 110% with an average of 98.4%. Therefore, a calibration in Milli Q water ensures a sufficiently accurate quantification, having in mind the legislative performance requirements for such methods when used in official control. This is an advantage compared to other methodologies where matrix effects have a strong impact on the apparent recovery requiring correction by either isotope-labelled internal standards, matrix matched calibration or standard additions. The advantage of methods without a significant matrix effect was highlighted also by Berthiller et al. (Citation2005). The trueness of the results generated by this method was further evaluated by analysing surplus material from the 2013 proficiency test for the Member States’ National Reference Laboratories for mycotoxins (Kujawski et al. Citation2014) showing a recovery for DON of 98.5% with respect to the assigned value (1100 µg kg−1).
The precision was evaluated as relative standard deviation of repeatability (RSDr, n = 6) and intermediate precision (RSDIP, 5 days, n = 10) by analysing naturally contaminated barley (BAT27), wheat (WDE35) and maize (MAT16) samples (). More data can be found in . The repeatability was always below 13% and the intermediate precision was below 13.5%, except for DON-3-G in wheat (20.8%). This figure can be explained by the less stable baseline and the broader peak shape of DON-3-G at k’ = 1.7. Given its mass fraction (below 100 µg kg−1), this outcome is still compliant with Commission Regulation 401/2006 (European Commission Citation2006a). The concept of organic solvent-free elution of DON from IACs developed at the JRC (Seidler Citation2007) led to a commercial system realised by Wuppermann and Aulwurm (Citation2013) for aflatoxins and ochratoxin A. However, the application of this methodology for the determination of DON and its relevant conjugates as described in this paper is new.
The method showed to be linear for all matrices in the respective working range (from LOQ to the highest standard) with average coefficients of determination (R2) between 0.996 for 15-AcDON and 0.9997 for DON data, respectively. The working range can be extended by using a smaller volume of sample extract (e.g., 1 mL) applied onto the IAC for purification. The presented performance parameters are fit for the purpose of monitoring DON and its major conjugates in cereals.
DON and its conjugates in cereal samples
The developed method was used to determine DON and the respective conjugates in selected barley, wheat and maize samples. The results are presented in and Table 2S. Selected samples from each matrix type underwent confirmatory analysis by LC-MS/MS after SPE using Oasis HLB cartridges, as described in section 2.2. The results obtained by HPLC-PCD-FLD were positively confirmed by LC-MS/MS analysis comparing the observed ion ratios (quantifier ion peak area/qualifier ion peak area) with the predicted ions ratios with a tolerance of 20%. The applied LC-MS/MS method provided acceptable recoveries and LOQs. The instrumental acquisition details used for the LC-MS/MS analysis and relevant validation parameters can be found in Tables 3S and 4S, respectively.
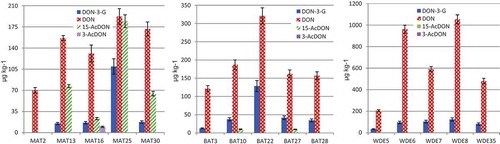
Figure 2. Mass fractions of DON and respective conjugates (µg kg−1) found in maize (MAT), barley (BAT) and wheat (WDE). The error bars represent the measurement uncertainty (k = 2).
As the analysed samples were selected for the co-occurrence of DON conjugates, the statistics on the prevalence of DON conjugates presented here can not be extrapolated for a population of random samples. According to the literature, the amount of DON conjugates usually follows the pattern: DON>DON-3-G>15-AcDON>3-AcDON (Desmarchelier and Seefelder Citation2011; Yoshinari et al. Citation2012; EFSA Citation2013; Suman et al. Citation2013; Zhao et al. Citation2014), although sometimes the proportion of AcDONs can be the reverse (Berthiller et al. Citation2005; Boevre et al. Citation2013).
DON-3-G was present in all samples except one. The levels in maize were up to 57% of DON with a maximum of 110 µg kg−1. A similar situation was observed for barley with DON-3-G amounting to 10–40% of DON and a maximum of 128 µg kg−1. In wheat, DON-3-G was in the range of 10–18% of DON with a maximum of 124 µg kg−1. The average mass fractions of DON-3-G were 40 µg kg−1 in maize, 51 µg kg−1 in barley and 88 µg kg−1 in wheat. Only minor amounts of 15-AcDON were found in barley and no acetylated derivative was quantifiable in wheat. However, significant amounts of 15-AcDON were quantified in four maize samples (40% of DON, on average, and a maximum of 184 µg kg−1) and 3-AcDON was additionally measurable in one sample.
Somewhat in contrast to our observations, Palacios et al. (Citation2017) have reported the presence of DON along with its three main derivatives in durum wheat in Argentina in the period 2012–2014. The amounts were fairly high, with DON detected ubiquitously with mass fractions up to 9480 µg kg−1 and DON-3-G was detected in 94% of the samples with mass fractions up to 850 µg kg−1. AcDONs were quantified in 49% of the samples with mass fractions up to 190 µg kg−1, but no individual isomer values were provided (Palacios et al. Citation2017).
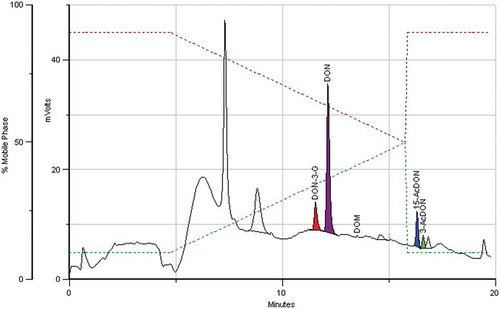
presents the cumulative amounts (%) of DON and its conjugates in the analysed samples for a better visualisation of the contribution of the DON conjugates to “total DON”. The previously mentioned occurrence pattern of the DON conjugates depends on two variables, the preferred fungal metabolic pathway leading to the acetylated forms of DON and the capability of the plant to convert DON to DON-3-G. This explains the occurrence of unusual conjugate patterns as described in other studies. Fan et al. (Citation2016) detected higher amounts of 3-AcDON and in particular of 15-AcDON compared to DON-3-G in feed samples in China. In the maize samples analysed here 15-AcDON reached also higher levels than DON-3-G (from 1.4 to 5.1 fold). These maize samples were characterised by the presence of a wide variety of DON conjugates in relevant amounts. In particular, the amount of DON conjugates in sample MAT25 exceeded that of DON, and MAT16 was the only sample containing quantifiable amounts of 3-AcDON. depicts a chromatogram of this sample.
Figure 3. Cumulative amounts (%) of DON and its conjugates in maize (MAT), barley (BAT) and wheat (WDE).
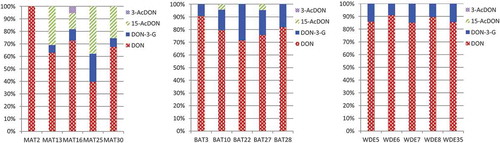
Figure 4. Chromatogram of a maize sample containing 17, 131, 23 and 10 μg kg−1 of DON-3-G, DON, 15-AcDON and 3-AcDON, respectively.
The “total DON” amounts varied between 70 and 486 µg kg−1 in maize, between 134 and 449 µg kg−1 in barley and between 240 and 1177 µg kg−1 in wheat.
Conclusions
The cross-reactivity of the antibodies used in IACs for mycotoxins is an interesting feature allowing widening the scope of the methods in terms of analytes’ coverage, while it might also be a drawback for ELISA-based methods. The method proposed here does not require organic solvents during sample preparation, and is therefore an environmentally friendly option for routine analysis. The analysis of the complete IAC eluate and the reduction of the number of analytical steps by resorting to in-line hot water elution are key features of this method. High selectivity and sufficiently low detection limits allowed the monitoring of DON and its conjugates far below the maximum limits regulated in food and feed.
Nevertheless, a good understanding of the antigen–antibody interaction (e.g., cross-reactivity, competition and capacity) is crucial. The working ranges were set up differently for each analyte, avoiding analyte competition and loss of linearity, yet complying with the expected levels in cereal samples.
As the analysed samples were selected for the co-occurrence of the relevant analytes to challenge the method, no generalisation should be attempted on the prevalence of the DON conjugates herein reported. However, it is legitimate to evaluate their relative and absolute amounts. Maize showed the greatest diversity and amounts of DON conjugates. Barley contained only DON-3-G and 15-AcDON besides DON, and in wheat only DON-3-G was found along with DON. The levels of DON were the highest in wheat in contrast with the lowest proportion of DON-3-G (<15%). The levels of DON were similar in barley and maize, with the latter containing particularly high amounts of conjugates in which 15-AcDON even surpassed DON-3-G. Overall, the results show that neglecting the contribution of the DON conjugates would result in a considerable underestimation of the potential toxicity of the cereal samples.
Disclaimer
The reference to trade names or commercial products in this publication is solely for the purpose of providing factual information and does not imply recommendation or endorsement by the European Commission. The views expressed herein are purely those of the authors and may not in any circumstances be regarded as stating an official position of the European Commission.
Supplemental Material
Download MS Word (141.3 KB)Supplemental Material
Download MS Word (33.7 KB)Supplemental Material
Download MS Word (36.3 KB)Supplemental Material
Download MS Word (35.1 KB)Supplemental Material
Download MS Word (33.8 KB)Acknowledgments
Michael Sulyok and Franz Berthiller (BOKU Vienna, Dept. IFA-Tulln) are greatly acknowledged for supplying contaminated cereal samples. Hendrik Emons is greatly acknowledged for his careful review of this paper.
Supplementary material
Supplemental data for this article can be accessed on the publisher’s website.
Related Research Data
References
- Abia WA, Warth B, Sulyok M, Krska R, Tchana AN, Njobeh PB, Dutton MF, Moundipa PF. 2013. Determination of multi-mycotoxin occurrence in cereals, nuts and their products in Cameroon by liquid chromatography tandem mass spectrometry (LC-MS/MS). Food Control. 31(2):438–453. doi:10.1016/j.foodcont.2012.10.006.
- Berthiller F, Crews C, Dall’Asta C, Saeger SD, Haesaert G, Karlovsky P, Oswald IP, Seefelder W, Speijers G, Stroka J. 2013. Masked mycotoxins: A review. Molecular Nutrition & Food. Research 57(1):165–186. doi:10.1002/mnfr.201100764.
- Berthiller F, Dall’Asta C, Schuhmacher R, Lemmens M, Adam G, Krska R. 2005. Masked Mycotoxins: determination of a Deoxynivalenol Glucoside in Artificially and Naturally Contaminated Wheat by Liquid Chromatography−Tandem Mass Spectrometry. Journal of Agricultural and Food Chemistry. 53(9):3421–3425. doi:10.1021/jf047798g.
- Berthiller F, Krska R, Domig KJ, Kneifel W, Juge N, Schuhmacher R, Adam G. 2011. Hydrolytic fate of deoxynivalenol-3-glucoside during digestion. Toxicology Letters. 206(3):264–267. doi:10.1016/j.toxlet.2011.08.006.
- Boevre MD, Jacxsens L, Lachat C, Eeckhout M, Mavungu JDD, Audenaert K, Maene P, Haesaert G, Kolsteren P, Meulenaer BD, et al. 2013. Human exposure to mycotoxins and their masked forms through cereal-based foods in Belgium. Toxicology Letters. 218(3):281–292. doi:10.1016/j.toxlet.2013.02.016
- Boevre MD, Mavungu JDD, Maene P, Audenaert K, Deforce D, Haesaert G, Eeckhout M, Callebaut A, Berthiller F, Peteghem CV, et al. 2012. Development and validation of an LC-MS/MS method for the simultaneous determination of deoxynivalenol, zearalenone, T-2-toxin and some masked metabolites in different cereals and cereal-derived food. Food Additives & Contaminants: Part A. 29(5):819–835. doi:10.1080/19440049.2012.656707
- Broekaert N, Devreese M, Baere SD, Backer PD, Croubels S. 2015. Modified Fusarium mycotoxins unmasked: from occurrence in cereals to animal and human excretion. Food and Chemical Toxicology. 80:17–31.
- Broekaert N, Devreese M, Mil TD, Fraeyman S, Baere SD, Saeger SD, Backer PD, Croubels S. 2013. Determination of deoxynivalenol (DON) and its derivatives: current status of analytical methods. Food Control. 34(1):138–148. doi:10.1016/j.foodcont.2013.04.026.
- Buttinger G, Krska R. 2003. Determination of B-trichothecenes in wheat by post column derivatisation liquid chromatography with fluorescence detection (PCD-HPLC-FLD). Mycotoxin Research. 19(2):139–143. doi:10.1007/BF02942953.
- Capriotti AL, Caruso G, Cavaliere C, Foglia P, Samperi R, Lagana A. 2012. Multiclass mycotoxin analysis in food, environmental and biological matrices with chromatography/mass spectrometry. Mass Spectrometry Reviews. 31(4):466–503. doi:10.1002/mas.20351.
- Cirlini M, Dall’Asta C, Galaverna G. 2012. Hyphenated chromatographic techniques for structural characterization and determination of masked mycotoxins. Journal of Chromatography A. 1255:145–152. doi:10.1016/j.chroma.2012.02.057.
- Codex_Alimentarius_Commission. 2011. Joint FAO/WHO Food Standards Programme, Codex Committee on Contaminants in Foods, Fifth Session. Working document for information and use in discussions related to contaminants and toxins in the GSCTFF, CF/5 INF/1. Netherlands:The Hague.
- Desmarchelier A, Seefelder W. 2011. Survey of deoxynivalenol and deoxynivalenol-3-glucoside in cereal-based products by liquid chromatography electrospray ionization tandem mass spectrometry. World Mycotoxin Journal. 4(1):29–35. doi:10.3920/WMJ2010.1236.
- [EFSA] European Food Safety Authority. 2013. European Food Safety Authority Scientific report: deoxynivalenol in food and feed: occurrence and exposure. EFSA Journal. 11:3379. doi:10.2903/j.efsa.2013.3379
- [EU] European Union. 2011. European Union comments for the Codex Committee on Contaminants in food. 5th Session, Proposed Draft Maximum Levels for Deoxynivalenol (DON) and its Acetylated Derivates in Cereals and Cereal-based Products (CX/CF 11/5/6). The Netherlands:The Hague.
- European_Commission. 2003. Collection of occurrence data of fusarium toxins in food and assessment of dietary intake by the population of EU Member States, Report on Tasks for Scientific Cooperation (SCOOP) 3. 2.10 European Commission, 2003, Brussels/Belgium. http://ec.europa.eu/food/fs/scoop/task3210.pdf (accessed 25th March 2014).
- European_Commission. 2006a. Commission Regulation No 401/2006 of 23 February 2006, laying down the methods of sampling and analysis for the official control of the levels of mycotoxins in foodstuffs. In: Official Journal of the European Union L 70/12.
- European_Commission. 2006b. Commission Regulation No 1881/2006 of 19 December 2006, setting maximum levels for certain contaminants in foodstuffs. In: Official Journal of the European Union L 364/5.
- Fan Z, Bai B, Jin P, Fan K, Guo W, Zhao Z, Han Z. 2016. Development and validation of an ultra-high performance liquid chromatography-tandem mass spectrometry method for simultaneous determination of four type B trichothecenes and masked deoxynivalenol in various feed products. Molecules. 21(6):747. doi:10.3390/molecules21060747.
- Gonçalves C, Stroka J. 2016. Cross-reactivity features of deoxynivalenol (DON)-targeted immunoaffinity columns aiming to achieve simultaneous analysis of DON and major conjugates in cereal samples. Food Additives & Contaminants: Part. A 33(6):1053–1062. doi:10.1080/19440049.2016.1188436.
- Gratz SW. 2017. Do plant-bound masked mycotoxins contribute to toxicity? Toxins. 9(3):85. doi:10.3390/toxins9030085.
- Hantzsch A. 1881. Condensationsprodukte aus Aldehydammoniak und ketonartigen Verbindungen. Berichte der deutschen chemischen Gesellschaft. 14(2):1637–1638. doi:10.1002/cber.18810140214.
- Josephs RD, Derbyshire M, Stroka J, Emons H, Anklam E. 2004. Trichothecenes: reference materials and method validation. Toxicology Letters. 153:123–132.
- Juan C, Raiola A, Mañes J, Ritieni A. 2014. Presence of mycotoxin in commercial infant formulas and baby foods from Italian market. Food Control. 39:227–236. doi:10.1016/j.foodcont.2013.10.036.
- Kovač M, Šubarić D, Bulaić M, Kovač T, Šarkanj B. 2018. Yesterday masked, today modified; what do mycotoxins bring next? Archives of Industrial Hygiene and Toxicology. 69(3):196–214. doi:10.2478/aiht-2018-69-3108.
- Kujawski M, Mischke C, Bratinova S, Stroka J 2014. Report on the 2013 Proficiency Test of the European Union Reference Laboratory for Mycotoxins, for the Network of National Reference Laboratories: Determination of Fumonisin B1, Deoxynivalenol and Aflatoxin B1 in Cereals.
- Lattanzio VMT, Pascale M, Visconti A. 2009. Current analytical methods for trichothecene mycotoxins in cereals. TrAC Trends in Analytical Chemistry. 28(6):758–768. doi:10.1016/j.trac.2009.04.012.
- Li Q, Oshima M, Motomizu S. 2007. Flow-injection spectrofluorometric determination of trace amounts of formaldehyde in water after derivatization with acetoacetanilide. Talanta. 72(5):1675–1680. doi:10.1016/j.talanta.2007.01.054.
- Malachova A Indirect methods for the determination of conjugated forms of deoxynivalenol in cereals. Proceedings of the 6th International Symposium on Recent Advances in Food Analysis, 5-8th of November. 2013.
- Malachová A, Štočková L, Wakker A, Varga E, Krska R, Michlmayr H, Adam G, Berthiller F. 2015. Critical evaluation of indirect methods for the determination of deoxynivalenol and its conjugated forms in cereals. Analytical and Bioanalytical Chemistry. 407:6009–6020.
- Mishra S, Ansari KM, Dwivedi PD, Pandey HP, Das M. 2013. Occurrence of deoxynivalenol in cereals and exposure risk assessment in Indian population. Food Control. 30(2):549–555. doi:10.1016/j.foodcont.2012.07.041.
- Muscarella M, Iammarino M, Nardiello D, Palermo C, Centonze D. 2012. Determination of deoxynivalenol and nivalenol by liquid chromatography and fluorimetric detection with on-line chemical post-column derivatization. Talanta. 97:145–149.
- Nagl V, Schatzmayr G. 2015. Deoxynivalenol and its masked forms in food and feed. Current Opinion in Food Science. 5:43–49.
- Palacios SA, Erazo JG, Ciasca B, Lattanzio VMT, Reynoso MM, Farnochi MC, Torres AM. 2017. Occurrence of deoxynivalenol and deoxynivalenol-3-glucoside in durum wheat from Argentina. Food Chemistry. 230:28–734.
- Pereira VL, Fernandes JO, Cunha SC. 2014. Mycotoxins in cereals and related foodstuffs: A review on occurrence and recent methods of analysis. Trends in Food Science & Technology. 1-41.
- Rodríguez-Carrasco Y, Ruiz MJ, Font G, Berrada H. 2013. Exposure estimates to Fusarium mycotoxins through cereals intake. Chemosphere. 93:2297–2303.
- Romera D, Mateo EM, Mateo-Castro R, Gómez JV, Gimeno-Adelantado JV, Jiménez M. 2018. Determination of multiple mycotoxins in feedstuffs by combined use of UPLC–MS/MS and UPLC–QTOF–MS. Food Chemistry. 267:140–148.
- Rychlik M, Humpf H-U, Marko D, Dänicke S, Mally A, Berthiller F, Klaffke H, Lorenz N. 2014. Proposal of a comprehensive definition of modified and other forms of mycotoxins including “masked” mycotoxins. Mycotoxin Research. 30:197–205.
- Saini A, Kumar S, Sandhu JS. 2008. Hantzsch reaction. Recent advances in Hantzsch 1,4 dihydropyridines. Journal of Scientific and Industrial Research. 67:95–111.
- Sano A, Matsutani S, Suzuki M, Takitani S. 1987. High-performance liquid chromatographic method for determining trichothecene mycotoxins by post-column fluorescence derivatization. Journal of Chromatography A. 410:427–436. doi:10.1016/S0021-9673(00)90072-4.
- Scarpino V, Reyneri A, Blandino M. 2019. Development and comparison of two multiresidue methods for the determination of 17 Aspergillus and Fusarium mycotoxins in cereals using HPLC-ESI-TQ-MS/MS Frontiers in. Microbiology. 10:361.
- Seidler J 2007. Development and validation of solvent-free elution procedures for the isolation of mycotoxins by immunoaffinity. Thesis presented to the Aalen University of Applied Sciences (Aalen, Germany) for obtaining the Diploma Degree “Diplom-Ingenieur (FH) - Chemie”, JRC-Geel, Belgium. 106 pages.
- Simsek S, Burgess K, Whitney KL, Gu Y, Qian SY. 2012. Analysis of Deoxynivalenol and Deoxynivalenol-3-glucoside in wheat. Food Control. 26:287–292.
- Soleimany F, Jinap S, Faridah A, Khatib A. 2012. A UPLC–MS/MS for simultaneous determination of aflatoxins, ochratoxin A, zearalenone, DON, fumonisins, T-2 toxin and HT-2 toxin, in cereals. Food Control. 25(2):647–653. doi:10.1016/j.foodcont.2011.11.012.
- Stroka J, Gonçalves C 2019. Mycotoxins in food and feed: an overview. Encyclopedia of Food Chemistry. Elsevier Inc. p. 401–419.
- Stroka J, Mischke C 2007. Report on the method validation study - Determination of Deoxynivalenol in Baby Food and Animal Feed by Immunoaffinity Column Clean-up with High Performance Liquid Chromatography using Post-Column Derivatisation with Fluorescence Detection: Collaborative Study.
- Stroka J, Seidler J. 2014. Immunoaffinity clean-up of mycotoxins with organic solvent-free elution. World Mycotoxin Journal. 7(2):115–120. doi:10.3920/WMJ2013.1661.
- Sulyok M, Berthiller F, Krska R, Schuhmacher R. 2006. Development and validation of a liquid chromatography/tandem mass spectrometric method for the determination of 39 mycotoxins in wheat and maize. Rapid Communications in Mass Spectrometry. 20(18):2649–2659. doi:10.1002/rcm.2640.
- Suman M, Bergamini E, Catellani D, Manzitti A. 2013. Development and validation of a liquid chromatography/linear ion trap mass spectrometry method for the quantitative determination of deoxynivalenol-3-glucoside in processed cereal-derived products. Food Chemistry. 136(3–4):1568–1576. doi:10.1016/j.foodchem.2012.06.085.
- Vendl O, Berthiller F, Crews C, Krska R. 2009. Simultaneous determination of deoxynivalenol, zearalenone, and their major masked metabolites in cereal-based food by LC–MS–MS. Analytical and Bioanalytical Chemistry. 395(5):1347–1354. doi:10.1007/s00216-009-2873-y.
- Vendl O, Crews C, MacDonald S, Krska R, Berthiller F. 2010. Occurrence of free and conjugated Fusarium mycotoxins in cereal-based food. Food Additives & Contaminants: Part A. 27(8):1148–1152. doi:10.1080/19440041003801166.
- Wuppermann F, Aulwurm U Automated highly sensitive method for Aflatoxin B/G or Ochratoxin A clean-up and analysis – A novel approach in mycotoxin analysis. Proceedings of the 35th Mycotoxin Workshop, 2013.
- Yoshinari T, Ohnishi T, Kadota T, Sugita-Konishi Y. 2012. Development of a purification method for simultaneous determination of deoxynivalenol and its acetylated and glycosylated derivatives in corn grits and corn flour by liquid chromatography–tandem mass spectrometry. Journal of Food Protection. 75(7):1355–1358. doi:10.4315/0362-028X.JFP-11-555.
- Zhao Z, Rao Q, Song S, Liu N, Han Z, Hou J, Wu A. 2014. Simultaneous determination of major type B trichothecenes and deoxynivalenol-3-glucoside in animal feed and raw materials using improved DSPE combined with LC-MS/MS. Journal of Chromatography B. 963:75–82. doi:10.1016/j.jchromb.2014.05.053.