
 ?Mathematical formulae have been encoded as MathML and are displayed in this HTML version using MathJax in order to improve their display. Uncheck the box to turn MathJax off. This feature requires Javascript. Click on a formula to zoom.
ABSTRACT
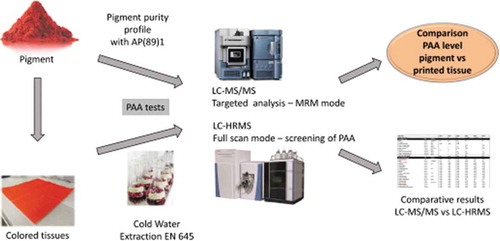
A collaborative study was conducted to understand the correlation between pigments purity profile (primary aromatic amine content of the pigments) and the behaviour of these PAAs during cold water extraction (CWE) tests according to EN 645. From a selection of organic pigments based on seven colour indexes (PR122, PR184, PO13, PY74, PY111, PY138 and PY155), the pigment purity profile was established according to European Resolution AP (89) 1, then mono-pigmented inks were prepared and napkins printed with these inks. In a second step, cold water extraction and PAA determination were performed by two independent laboratories. In one laboratory, an analytical method based on LC-MS/MS was used, whereas in the other laboratory a method based on LC-HRMS using Orbitrap technology was developed for the simultaneous analysis of 35 PAAs. Good qualitative results were obtained if we consider that at significant levels the PAAs were positively detected in both laboratories, except for 3-amino-4-methoxybenzanilide and 8-amino-2-methyl-quinoline, for which inter-laboratory differences were observed. It was also shown that no contamination from unexpected PAAs was detected. The comparison between pigment analysis and CWE results shows that if the pigment purity profile is of major importance, other parameters such as pigment surface treatment, ink grinding process or ink formulation could have an important influence on the CWE results. For such sensitive applications, for example napkins or other Food Contact Materials (FCM), it is therefore recommended not only to select a pigment with a good purity profile but also to test the pigment in the final application. Finally, this work highlights the difficulty of validating a product on a single analysis and shows the importance of a multilevel global assessment on worst case application.
Graphical abstract
Introduction
Organic pigments have been used in ink applications for many years thanks to the outstanding properties they offer in terms of gloss, colour strength, transparency and resistance. There is no alternative available within mineral chemistry providing the same kind of properties, and attractive packaging requires the use of inks prepared from organic pigments. For several years (Koster et al. Citation2015; Campanella et al. Citation2015), organic pigments have been suspected as a possible source of contaminants, specifically primary aromatic amines (PAAs).
PAAs are a heterogeneous group of substances. A series of these PAAs are classified according to the European Commission Regulation (EC) No. 1272/2008 (EC Citation2008) as either proven human carcinogens (carcinogenicity category 1A, e.g. 2-naphthylamine) or potential carcinogens (carcinogenicity category 1B, e.g. o-anisidine), whereas others have no adverse health effects, as demonstrated by negative in vitro and in vivo genotoxic assays and absence of sensitisation (e.g. 3-amino-4-methoxybenzanilide, REACH data). PAAs may be present as non-intentionally added substances in food contact materials, such as nylon kitchen utensils (Sendón et al. Citation2010; McCall et al. Citation2012; Paseiro-Cerrato et al. Citation2014; Sanchis et al. Citation2015; Perez et al. Citation2019). Another source of PAAs in food contact materials is multilayer food packaging and (especially) polyurethane adhesives in flexible lamination application. In these applications, PAAs could be released from laminates to the foodstuff due to the reaction of residual aromatic diisocyanate with water (Mortensen et al. Citation2005; Mattarozzi et al. Citation2013; Lambertini et al. Citation2014). Also, PAAs have been identified in cold water extracts of coloured napkins (Merkel et al. Citation2015, Citation2018; Yavuz et al. Citation2016).
Azo-based pigments used as colourants of printing inks for napkins, such as Pigment Yellow (PY) 74, are often considered as PAA-contaminated pigments, as they are synthesised from PAA(s) as raw material. However, PAAs are also starting substances for the synthesis of polycyclic pigments such as quinacridone-based Pigment Red (PR) 122 or quinophthalone-based PY138. The presence of trace amounts of PAAs on the pigment may be originating from either incomplete pigment synthesis or partial degradation of key raw materials during the pigment synthesis, the pigment processing or ink production. The research on the origin of these non-intentionally added substances is becoming a very important topic in the supply chain of materials coming into contact with food (Koster et al. Citation2015), hence the interest in collecting data about PAAs and their transfer potential from pigments and ink formulations used in printed Food Contact Materials (FCMs) to foodstuff.
In order to safeguard the health of the population, the European Union has issued the Framework Regulation (EC) No 1935/2004 (EC Citation2004), which states that substances may not migrate from food contact materials in a quantity that would present a risk to health. Also, migration of PAAs from plastic food contact materials into foodstuff was restricted in 2011 by the European Commission according to European Regulation (EU) No. 10/2011 (EC Citation2011), with a maximum allowed value of 0.01 mg kg−1 foodstuff for each individual PAA and their sum, unless the individual PAA is mentioned in Annex I of the Union list of said regulation. Even though the European Union has not regulated the release of PAAs from paper and board into foodstuff, the industry generally refers to Regulation (EU) No. 10/2011 which governs plastic materials and articles. Furthermore, the German Federal Institute for risk assessment BfR states in its recommendation XXXVI (BfR Citation2019) that the release of PAAs from paper and board must be limited to 0.01 mg kg−1 foodstuff for each individual substance and their sum. Additionally, the BfR discusses in its opinion 021/2014 (BfR Citation2013) and recommends in recommendation XXXVI to further restrict the release of the PAA of carcinogenicity categories 1A and 1B according to the European Commission Regulation (EC) No. 1272/2008 (EC Citation2008) to 0.002 mg kg−1 foodstuff for each PAA concerned from said FCMs. Finally, the BfR recommends the residual amount of PAAs leaching from printed paper and board into the foodstuff to be determined via cold water extraction according to EN 645 (DIN Citation1993).
The European Commission Regulation (EC) No. 2023/2006 on good manufacturing practice (GMP) for materials and articles intended to come into contact with food states that each stakeholder is to ensure that these materials and articles are consistently produced and controlled to achieve conformity with the applicable rules and with the appropriate quality standards, in order not to endanger human health, not to cause an unacceptable change in food composition, and not to induce deteriorated organoleptic characteristics. This regulation, requiring the establishment of a documented quality assurance system, is applicable to all stages within the value chain for food contact materials and articles, including printing inks, but excludes the production of the starting substances for these materials, such as pigments. Ink producers and pigment producers are conscious of the mentioned regulations and recommendations, nevertheless, they cannot ensure on their own compliance of their products to applicable regulations and recommendations of the food contact material, as the restrictions on the extraction or migration of PAAs from the final FCM into foodstuffs are applicable to stakeholders further down the value chain. On that account, it is important to gain knowledge on the influence of the pigment purity profile (PAA content) to the level of PAA quantified after cold water extraction. Extended collaboration between ink and pigment manufacturers will, therefore, increase data availability and improve general understanding in this field.
The low permissible residual quantity of said PAAs in foodstuff requires a robust methodology for qualitative and quantitative analyses. In 2005, Mortensen et al. (Citation2005) have shown that a method using LC-MS/MS is suitable for the analysis of 22 PAAs with a LOD < 3 µg L−1 in aqueous simulants water and 3% acetic acid. In this study, PAAs originating from the production of polyurethanes or azo-based colourants were analysed from plastic laminates and kitchen tools. Since 2009, other studies were conducted (Aznar et al. Citation2009; Sendón et al. Citation2010; McCall et al. Citation2012) in which migration of PAAs from kitchen utensils was analysed using LC-MS/MS to quantify 6 and 8 PAAs in, respectively, water and 3% aqueous acetic acid.
Lambertini et al. (Citation2014) have developed a method using an ion trap LC-MS to study the release of PAAs from food contact materials in both water and 3% aqueous acetic acid. The suitability of the method was demonstrated for a wide range of commercial samples. Regarding the measurement of PAAs in CWE of printed tissue samples, analytical methods based on LC-ESI-MS/MS were identified as the most suited in a round-robin study (Merkel et al. Citation2015); 14 out of 20 participants used this method. This is due to the fact that LC-MS/MS is the most sensitive analytical equipment for targeted analysis and quantification. Later, Yavuz et al. (Citation2016) performed an extensive study on 93 coloured napkins according to the cold water extraction method. A method using LC-MS/MS was used for the quantification of 36 PAAs in said CWE and the highest concentration of PAAs were obtained in yellow, orange, red and multi-coloured samples. Yet another study has been conducted by the BfR in 2018 (Merkel et al. Citation2018) showing a multi-analyte method using LC-MS/MS for the quantification of 26 PAAs in cold water extract with sensitivity from 0.025 µg L−1 to 1 µg L−1. In this study, a series of food samples were wrapped into napkins to study the transfer of PAA from the napkins to foodstuff.
Recently, European Standard EN 17163 (DIN Citation2019) has been published, describing the determination of 23 PAAs in a water extract of paper, board and pulp samples using a method based on either LC-MS/MS or LC-DAD. The standard provides a general approach for the quantification of PAAs classified as carcinogen categories 1A and 1B according to the CLP regulation (EC Citation2008) plus aniline in a working range from 1 to 20 µg L−1. Additionally, it provides a good benchmark for robustness by the incorporation of two independent inter-laboratory trials. The inter-laboratory reproducibility based on the first trial by 7 participants ranged from 11% to 22% for spiked cold water extracts at 10 µg L−1. For the second inter-laboratory trial by 16 participants, the reproducibility ranged from 11% to 28% at 4 and 10 µg L−1 for a spiked cold water extract, and from 25% to 36% for spiked napkins at 1 to 5 µg L−1.
Regarding the analytical method, the high-resolution separation coupled with an accurate mass measurement from HRMS techniques has begun to be recognised as a possible methodology. Mattarozzi et al. (Citation2013), having used an LC-HRMS method, have shown that high-resolution mass spectrometry is also suitable for PAA quantification. In this article, 22 PAAs were quantified in food simulant 3% aqueous acetic acid after the incubation of plastic laminates for 2 hours at 70°C using an LC-Orbitrap-HRMS system in Full Scan mode. According to this work, 17 of the 22 PAAs were showing good LOD (<1 µg kg−1 foodstuff), whereas 5 PAAs had a LOD between 2 and 5 µg kg−1 foodstuff. Sanchis et al. (Citation2015) have also used a method based on LC-HRMS to quantify 8 targeted PAAs in kitchen tool utensils with a LOD below 2.5 µg kg−1 foodstuff. The mentioned article additionally shows the benefit of high-resolution mass spectrometry, as a post-processing method was used for the screening of 77 molecules. The migration tests in the said study were performed with water and 3% aqueous acetic acid as food simulants, with data acquisition in full scan mode.
The objective of the current study, initiated by a collaboration of two independent stakeholders within the industry of pigment manufacturers and printing inks, was to compare the residual PAA content on the pigments (or pigment purity profile), used in coloured inks, and their transfer from printed tissues into a cold water extract. To the knowledge of the authors, this study is the first to provide data on pigment purity profile and cold water extraction results from napkins prepared from said pigments. To achieve this study, mono-pigmented inks were prepared with a selection of azo or high performance polycyclic organic pigments, and napkins were printed with these inks. The colour indexes were selected from the actual Siegwerk portfolio of ink products for the tissue market. According to the authors, these are standard colour index numbers that can meet industry requirements on product performance and especially with respect to regulation (see ). The pigments under scope were sourced from different pigment suppliers, without any disclosure by the suppliers of their manufacturing process for confidentiality reasons.
Table 1. Overview of the pigment colour indexes used
Cold water extractions (CWE) according to EN 645 were then performed to simulate direct food contact, and quantify the trace amount of PAAs originating from the pigments present in the inks and thus the printed napkins. In parallel, pigment analyses according to European Resolution AP (89) 1 (CoE Citation1989) were conducted for the pigments used in the above-mentioned inks. Furthermore, the goal of this study was to determine the robustness of Orbitrap-based LC-HRMS as a good alternative to LC-MS/MS for multi-analyte quantification, reaching a sensitivity of at least 2 µg kg−1 foodstuff per individual PAA. Finally, we discuss different matrix effects and the signal alteration of PAAs by compounds present in the cold water extracts, for both analytical methodologies utilised (based on either LC-MS/MS or LC-HRMS).
Materials and methods
Experiments and analyses performed at Ferro Performance Pigments Belgium (further referred as Ferro Be)
Chemicals and reagents
Pure analytical grade standards of a selection of the PAAs listed in were bought from Acros (Geel, Belgium), Alfa Aesar (Ward Hill, MA, USA), Combi-Blocks (San Diego, CA, USA), LGC Standards (Teddington, UK), Tokyo Chemical Industry Co. (Tokyo, Japan) and VWR (Rednor, PA, USA) with the exception for a certified standard of 10 µg mL−1 3,3ʹ-dichlorobenzidine in acetonitrile (LGC Standards). LC-MS grade methanol was bought from BioSolve (Valkenswaard, The Netherlands). Analytical grade absolute ethanol, 37 wt% aqueous hydrochloric acid, LC-MS grade formic acid and LC-MS grade ammonium formate were bought from VWR (Rednor, PA, USA), and LC-MS/MS grade methanol was bought from Merck (Darmstadt, Germany). Milli-Q water having a TOC < 3 µg L−1 was freshly prepared using a MilliPore Integral 15S Water Purification system (Merck, Darmstadt, Germany). With the exception of 3,3ʹ-dichlorobenzidine, stock solutions of 500 µg mL−1 and 10 µg mL−1 of each individual standard were prepared in LC/MS grade methanol, taking into account the certified purity of the individual analytical standard, and stored for up to 3 months at ambient temperature with exclusion of visible light. An aqueous 100 mM ammonium formate buffer was prepared with LC-MS grade ammonium formate in Milli-Q water and stored for up to 2 weeks at ambient temperature. A 2 M acidified ethanol solution was prepared by diluting 37 wt% aqueous hydrochloric acid in absolute ethanol, and the acid content was determined by acid-base titration prior to use. A 0.02 vol% aqueous formic acid solution was prepared by diluting LC-MS grade formic acid in Milli-Q water.
Table 2. Overview of the PAA analysed
Standard solutions preparation
Intermediate standard solution 1 at 50 µg L−1 of a mix of PAAs was prepared in a volumetric flask by diluting appropriate amounts of the 10 µg mL−1 stock solutions of each targeted PAA in 100 mM aqueous ammonium formate buffer and LC-MS/MS grade methanol in a final ratio buffer/methanol (9:1). Intermediate standard solution 2 at 5 µg L−1 of a mix of PAA was prepared in a volumetric flask by diluting the appropriate amount of intermediate solution 1 with 100 mM aqueous ammonium formate and LC-MS/MS grade methanol in a final ratio buffer/methanol (9:1). Intermediate solutions 1 and 2 were freshly prepared prior to the analyses.
Acidified ethanol pigment extraction according to AP (89) 1 (1989)
About 4 g of the pigment was precisely weighed to 0.1 mg in a 125 ml glass bottle, to which 20 mL of 2 M acidified ethanol and 4 mL of Milli-Q water was added. The solution was shaken for 15 minutes with an orbital shaker device (LAU, Hemer, Germany). The pigment slurry was poured in a 200 mL beaker and the glass bottle was carefully rinsed with 72 mL of Milli-Q water. The slurry was filtered on a 0.7 µm glass fibre filter (Macherey-Nagel, Düren, Germany) and the mother liquor was quantitatively transferred to a 200 mL volumetric flask. The pigment filter cake was quantitatively transferred to the 125 mL glass bottle, and the above-mentioned pigment extraction and subsequent filtration procedure (including rinsing) were repeated. The mother liquor of the second extraction was quantitatively transferred to the 200 mL volumetric flask, and the beaker was rinsed with Milli-Q water. The volumetric flask was made to volume with Milli-Q water, homogenised by manual shaking, and transferred to a 250 mL glass container; 10 mL of the extract was filtered on a 0.2 µm cellulose filter (Sartorius, Belgium) and diluted prior to injection 10-fold or 100-fold with 100 mM aqueous ammonium formate buffer and methanol in a ratio extract/buffer/methanol of, respectively, (1:8:1) or (1:89:10), depending on the expected residual quantity of the PAAs under scope.
Cold water extraction experiments
Cold water extraction experiments were performed according to an adapted method based on CEN standard EN 645, in duplicate depending on tissue availability. Coloured tissues (or blank tissues for the references) were cut into small pieces of about 1 cm2 each. Portions of 4 g of the cut tissues were weighed to 0.1 g in a 300 mL Erlenmeyer and 80 ± 0.1 g of Milli-Q water was added. The Erlenmeyer was provided with a magnetic stirring rod, and the Erlenmeyer was left standing for 24 hours at 23 ± 2°C. Every 2 hours, the contents of the Erlenmeyer were stirred for 10 minutes at 500 rpm. After 24 hours, the medium was transferred to a 100 mL volumetric flask. The pieces of tissue in the Erlenmeyer were washed threefold with Milli-Q water and the wash fluid was transferred to the volumetric flask. The volumetric flask was made to volume with Milli-Q water, and contents of the flask were homogenised by manual shaking. The contents of the volumetric flask were then transferred to a beaker and about 30 mL was filtered on a 0.2 µm cellulose filter (Sartorius, Belgium) into a glass bottle. The glass bottle was stored at −32°C for intermediate storage if the dilution prior to the analysis was not performed on the same day.
Aqueous cold water extraction simulants after work-up were diluted two-fold with 100 mM aqueous ammonium formate buffer and LC-MS/MS grade methanol to a final ratio extract/buffer/methanol (5:4:1). For each sample, one of the duplicate cold water extracts (where available) was diluted two-fold and spiked with the PAA working solutions at 1, 5 and 10 µg L−1 to determine possible matrix effects due to the interaction of other components transferred to the cold water extract.
Equipment and chromatographic conditions
Chromatographic separation was carried out on a Waters Acquity UPLC I-Class (Milford, MA, USA) equipped with a high-pressure gradient pump, a 10 µL fixed loop and a column heater. The targeted compounds were separated on a Waters BEH C18 column (2.1 x 150 mm, 1.7 µm), provided with a Waters BEH C18 pre-column (2.1 x 5 mm, 1.7 µm) at 45°C. Optimal conditions for separation were found using solution A (0.02 vol% of formic acid in Milli-Q water) and solution B (LC-MS/MS grade methanol). The gradient programme, during which the flow was maintained at 0.3 mL min−1, comprised the following steps: 0–2 min, 95% A; 2–16 min, linear gradient to 100% B; 16–18 min, 100% B, 18–20 min, 95% A. The injection volume was 10 µL using full loop injection mode, and the samples were stored at 10°C. The injection needle was washed after injection with 300 µL of LC-MS/MS grade methanol, followed by 900 µL of a mixture Milli-Q water/methanol (4:1 vol:vol).
A XEVO TQ-S micro triple quadrupole mass spectrometer from Waters, provided with MassLynx software, was used for data-acquisition and data-processing. It was operated in positive and negative ion mode with an electrospray ionisation source in unit mass resolution at 0.75 Da FWHM. Nitrogen gas at 95% purity was used as nebulising gas by means of a nitrogen generator (Parker Balston, Maidstone, United Kingdom). 99.9+% argon (Air Liquide, Paris, France) was used as collision gas. The ionisation parameters were as follows: Capillary voltage, 2 kV; Desolvation temperature, 500°C; Source temperature, 150°C; Desolvation gas flow, 1000 L h−1; Cone gas flow, 50 L h−1. The analytical parameters of the Ferro PAA analyses are described in .
Table 3. Analytical parameters – part Ferro Be (LC-MS/MS)
External calibration curves were constructed by diluting the working solutions of PAA at 5 and 50 µg L−1 with 100 mM aqueous ammonium formate buffer and LC/MS-MS grade methanol to a working concentration range of 0.1–50 µg L−1 (0.1, 0.5, 1, 5, 10, 35 and 50 µg L−1) in a final ratio buffer/methanol (9:1). Linear or quadratic regression curves were calculated by least squares regression using Waters TargetLynx software, and accuracy and repeatability were determined by 3 injections at 1 and 10 µg L−1. The data for the calibration curve of each primary aromatic amine are reported in .
Experiments and analyses performed in the Siegwerk analytical laboratory of Annemasse (further referred as Siegwerk Fr)
Chemicals and reagents
LC-MS grade solvents were obtained from Fisher Chemicals (Illkirch, France). Acetonitrile and water were used as mobile phases. Formic acid was purchased from BioSolve (Dieuze, France). For the calibration and quantification of the PAAs, a certified custom aryl amine mixture containing 35 PAAs was obtained from Techlab (Metz, France). Each of the 35 PAA standards are provided in acetonitrile at 10 µg mL−1. The standard solution was divided into separate 1 mL vials and carefully kept at −10°C. For each run of analysis, a new 1 mL vial of PAA standard was opened and used for quantification.
Production of test samples (printed tissues) used for the CWE test
In a first step, 250 g of mono-pigmented ink base was prepared using a Disperser DAS H-200 (Lau, Hemer, Germany) with zircon beads, at selected conditions for grinding time and temperature. Then, 100 g of ink were prepared by mixing 60% of a pigment base with 40% of an uncoloured tissue extender from production (see ). A Collomix Rotogen 1000 (Collomix, Gaimersheim, Germany) equipment was used for mixing the pigment base and the extender for 2 min at 320 rpm, resulting in a final pigment percentage between 21% and 27% in the final ink. The ink was printed quickly after the preparation step. Blank napkins for the CWE were provided by Metsä Germany, having a grammage of 48 g m−2, and the napkins were printed single-sided at Siegwerk using a Saueressig FP100/300 machine (Saueressig Engineering, Vreden, Germany) with a 48/1/140° anilox, which is a hard cylinder used for flexographic printing. The anilox is usually made of steel and engraved with small cells or lines. It is characterised by its volume and will determine the amount of ink that the anilox roll delivers to the plate according to the theoretical value. The theoretical volume of the anilox used for this study was 13.25 g cm−3.
Table 4. Formulation overview of the pigment base and extender used for the preparation of the inks
Depending on the dry content and the pigment concentration, the dry deposit was estimated between 2.5 and 5 g m−2. Print design was full tone colour and the deposit used is intended to simulate a “worst case” sample. Several pieces of tissue samples were printed for the cold water extractions. After printing, the samples were dried in an oven to evaporate the residual water content. Blank napkins were prepared with extenders only.
Cold water extraction experiments
Extractions of napkins were performed according to EN 645, with modifications. Compared to standard EN 645, the amount of sample and water were divided by a factor of 5 but keeping the ratio tissue/amount of water as defined in the standard. Samples were performed in duplicate. Approximately 2 ± 0.05 g of printed napkins were cut into small pieces (1–2 cm2 in size) and put into an 80 mL conical flask and 50 mL of deionised water was added. The flasks were covered with aluminium foil to protect from UV light in order to avoid degradation of PAAs. Prepared samples were stored for 24 h at 23°C and shaken with an orbital shaker for 2 h and then 2 h again before the end of the test. After 24 h, sample extracts were transferred into a 100 mL glass flask. After transfer, the napkins were pressed to extract a maximum amount of water and the flask was completed up to 50 mL. Then, 2 mL of extract was filtered on a 0.2 µm Nylon filter and put into an amber vial to avoid light. Analyses were done the same day as the extraction step to avoid any degradation of PAA.
Equipment and chromatographic conditions
Mobile phases A and B were daily prepared and consisted of 0.1% formic acid (FA) in water and 0.1% FA in acetonitrile, respectively. Chromatographic separation was carried out on a Vanquish flex system (ThermoFisher Scientific, Bremen, Germany) equipped with a high-pressure gradient pump, a 10 µL fixed loop and a column heater. LC column was a Hypersil Gold C18 reversed-phase column (100 mm x 2.1 mm, 1.9 µm) from ThermoFisher. Elution gradient started at 2% mobile phase B for 1 min, up to 98% of mobile phase B in 8 min and was then held for 1.5 min before column equilibration (2.4 min), for a total run time of 13 min. The injection volume was 10 µL using a full loop injection mode, and the samples were stored at 7°C on the carousel. The injection needle was washed after injection with a mixture of H2O/methanol (9:1).
A Q-Exactive Focus mass spectrometer (ThermoFisher Scientific, Bremen, Germany) with HESI source in positive mode was used. The source conditions were as follows: sheath gas flow rate: N2: 45 arbitrary unit, auxiliary gas flow rate: 15 arbitrary unit, spray voltage: 3.2 kV, capillary temperature: 320°C, auxiliary gas heater temperature: 310°C.
Data acquisition was performed using the Full Scan mode (mass range from 70 to 300 Da) at a resolution of 70 000 FWHM (m/z 400). The automatic gain control (AGC target) was set up at 1e6. Calibration (in positive mode) of the mass spectrometer was performed weekly with the standard Calmix solution, Thermo Scientific PierceTM LTQ Velos ESI (reference 88323). The accuracy of the system was better than 5 ppm for all the masses evaluated. For qualitative identification, mass windows of 5 ppm were set up. Target PAAs were identified using their [M + H]+ adduct. Data processing was performed using Trace Finder 4.0 software from ThermoFisher. The analytical parameters of the Siegwerk PAA analyses are described in .
Table 5. Analytical parameters – part Siegwerk Fr (LC-HRMS)
Results and discussions
Discussion on method development and validation – LC-MS/MS – Ferro Be
Method development – LC-MS/MS
In order to maximise the allocated measurement time (or dwell time) for each PAA, the individual analytes were selected on the basis of their possible presence according to the colour indexes used in the inks for the printed tissues (see ), as it was found that at low dwell times (e.g. lower than 10 ms) the signal-to-noise ratio dropped significantly. The ionisation conditions of cone voltage, collision energy and fragment mass were optimised for each PAA according to for two adduct to fragment transitions where possible, and maximum peak to peak signal-to-noise response for the most abundant fragment, via the infusion of a 200 µg L−1 solution of each individual PAA in 100 mM aqueous ammonium formate buffer.
The chromatographic conditions were optimised to separate the PAAs under scope from both their isomer(s) and their corresponding precursor(s). Depending on the chemical stability and ionisation potential, a precursor may undergo in-source fragmentation during electrospray ionisation and form the corresponding PAA. If chromatographic separation of precursor and corresponding PAA is not achieved, in-source fragmentation of the precursor can introduce a false-positive measurement of the PAA.
Mobile phase A comprising 0.02 vol% formic acid in Milli-Q water was shown to have the optimal balance between chromatographic separation and signal response, increasing the signal of aniline tenfold, and improving the chromatographic separation of, for example, PAA 5-chloro-2-methoxyaniline and precursor 5ʹ-chloro-2ʹ-methoxyacetoacetanilide (CAS 52793–11-0).
The working calibration solutions, the cold water extracts and 50 µg L−1 aqueous solutions of the precursors of the corresponding PAA were determined to be stable for up to 2 days at 10°C by using at least 20 mM ammonium formate buffer at pH ± 6, with the exception of p-phenylenediamine, for which no stable solution could be found. The choice of the buffer type and concentration was based on preliminary stability tests for 2 days at 20°C, which showed that 50 µg L−1 solutions in Milli–Q water of a series of PAA precursors such as 5ʹ-chloro-2ʹ-methoxyacetoacetanilide were hydrolysed to their corresponding PAA, reducing the signal of 5ʹ-chloro-2ʹ-methoxyacetoacetanilide by up to 30%. Ammonium formate was also chosen for its higher volatility as compared to pentafluoropropionic acid (PFPA, as used by Mortensen et al. Citation2005), thus eliminating the risk of potential instrument fouling. Furthermore, a constant ratio of aqueous phase/methanol of 9:1 was used for both working calibration solutions and cold water extracts, resulting in a substantial improvement in signal-to-noise ratio and linearity for 3,3ʹ-dichlorobenzidine.
For PAAs 2-amino-terephthalic acid, 1-methyl-2-aminoterephthalate and 2-amino-4-(MeO-carbonyl)-benzoic acid a linear regression was applied according to the linear least-squares method, whereas for the other PAAs we applied a negative quadratic regression to account for the signal saturation at higher standard concentrations (up to 50 µg L−1). The calculated correlation coefficient r or the coefficient of determination r2 of the corresponding calibration curves was generally above 0.999 (see ).
Determination of LOD and LOQ – LC-MS/MS
In their guidance document for the estimation of LOD and LOQ, the European Union Reference Laboratory supports the calculation of said limits for compounds under test by either blank/pseudo blank analytes according to standard DIN 32645:2008–11, or by calibration according to ISO 11843–2:2000 having taken into account procedural blank samples (EURL Citation2016).
For the analyses via LC-MS/MS contained within the current article, the standard addition experiments by spiking were constructed in a concentration range above the threshold of ten times the anticipated LOD. Therefore, the LOD was calculated according to the EURL guideline, by using a selection of unspiked CWE samples having very low trace amounts of PAA according to the following formula.
In this formula, m is the number of replicate analyses of the test sample (by default equal to 1), n the number of replicate analyses on the blank sample, tα,v the 1-tailed t-distribution value, α the probability level 0.05 (95% confidence interval), v the (n-1) degrees of freedom, sy,b the standard deviation of the area blank, b the average slope of the regression lines of the standard addition experiments and d the dilution factor of the cold water extracts (by default equal to 2). Correspondingly, the LOQ was calculated according to the following formula: LOQ = 3.3 x LOD. The determined LOD was within the range of the anticipated and visually observed detection limits.
The intra-lab precision of the cold water extraction was determined based on both repeatability and reproducibility of cold water extracts having PAAs above the quantification limit. The repeatability was defined as the standard error of within-day duplicate cold water extracts on identical-coloured tissues. Reproducibility was defined as the square root of the sum of squares of the repeatability for each compound for at least four measurements. The repeatability of the duplicate cold water extracts was found to be fair to very good, having an average within-sample repeatability ranging from 1% to 4.8%, whereas the overall reproducibility per quantified compound was within a general range of 4% to 9%, with an outlier for 4-chloro-2,5-dimethoxyaniline at 11.4%. These numbers, summarised in , were consistently below the Horwitz equation (Thompson Citation2004), and below the tendency of an invariant RSD of about 20% to 25% at concentrations below 10 µg L−1.
Table 6. Within sample repeatability and intra-lab reproducibility – Ferro BE
CWE work-up, dilution, recovery and matrix effect – LC-MS/MS
All CWE were filtered on a 0.2 µm cellulose filter to exclude instrument clogging by insoluble colloids, after having confirmed that no loss in PAA was observed by filtration as compared to centrifugation. The CWE were then diluted two-fold with 100 mM aqueous ammonium formate buffer and methanol in a ratio extract/buffer/methanol (5:4:1) to stabilise the extract, to have a solution as close as possible to the working standard solutions, and to limit possible fouling of the instrument.
Stability test of cold water extracts frozen at −32°C was performed, showing no adverse effect of the freeze/thaw procedure. These results confirm the findings of Merkel et al. (Citation2015) that compounds aniline, o-toluidine, 2,4-dimethylaniline and o-anisidine did not suffer degradation after having been stored for 5 days at 4°C in the dark.
The possible matrix effects (or signal alteration) during the analysis of the PAAs via LC-MS/MS were assessed by spiking of the CWE after extraction, a procedure specifically chosen to determine possible equipment-specific interactions between PAA and unknown compounds present in the CWE. Similar to Mortensen et al. (Citation2005), the trueness was evaluated by the determination of the recovery in the spiked samples at concentrations of 5 and 10 µg L−1 for each sample, over a period of more than 1 year, as shown in .
Figure 1. Ferro Be - Recovery after standard addition by spiking at 5 and 10 µg L-1.
The mean of the recoveries by spiking ranged from 47% to 125% at the two defined spiking concentrations, showing a high matrix effect. Of the 15 targeted PAAs, only 47% achieved a mean recovery within the range of 85% to 115%. Moreover, high overall standard deviations were observed for a number of PAA such as 3,3ʹ-dichlorobenzine and 3-amino-4-methoxybenzoic acid, whereas the specific standard deviations of 3,3ʹ-dichlorobenzine and 3-amino-4-methoxybenzoic acid for samples using comparable ink compositions (i.e. identical colour index) were much lower (data not included). The high error could be attributed to formulation-specific signal suppression of these PAAs by components present in the tissue and the ink formulation, confirming the observation of Yavuz et al. (Citation2016) that recoveries could be highly substrate-dependent. Arguably, the observed matrix effect might even be underestimated, as the above-mentioned two-fold dilution of the cold water extraction was executed.
Pigment extraction according to AP (89) 1
Purity criteria for colourants are not harmonised at EU level. To the knowledge of the authors, Resolution AP (89) 1 is the only guidance at European level for purity criteria set forth by the EU. In said European resolution, the determination of PAAs on colourants is based on ETAD method No. 212 and states that the extraction procedure is to use 1 M hydrochloric acid as the extraction medium. The extraction procedure has been incorporated in the Dutch law (NL Citation2014), having been modified to 2 M hydrochloric acid in ethanol. It was shown at Ferro Be that the amount of PAA extracted from the pigment using 2 M hydrochloric acid in ethanol as extraction medium was at least equal for all pigments, and substantially higher for many pigments as compared to 1 M hydrochloric acid in ethanol. Consequently, the harshest conditions defined by national law were applied.
Discussion on LC-HRMS and Orbitrap technology – Siegwerk Fr
Method development – LC-HRMS Orbitrap
In this study, a new method based on LC-HRMS and Orbitrap technology was developed for the analysis of 35 PAAs.
Similar to the method used at Ferro Be, all CWE were filtered on a 0.2 µm nylon filter, having confirmed that no loss in PAA was observed after filtration as compared to results without filtration. Although LC-MS/MS remains the most sensitive method, it is shown that high-resolution mass spectrometry is a valuable alternative for the analysis of PAA in CWE according to standard EN 645. A LOD of 0.2 µg L−1 was reached for the majority of the PAAs under scope, except for aniline, p-phenylenediamine and 8-amino-2-methylquinoline where the LOD was evaluated at 0.5 µg L−1. Nevertheless, this LOD is suitable for the quantification of the CWE. Compared to other studies such as Mattarozzi et al. (Citation2013), the number of PAA analysed was extended to 35, formic acid was used to replace PFPA, and water/ACN was used as mobile phase.
The important point is that measurements in Full Scan mode can be used for targeted application as well as for non-targeted application (such as NIAS or other impurities), confirming the observations of Sanchis et al. (Citation2015) that post-analysis is possible thanks to the high specificity in full scan mode and the high accuracy of the Orbitrap technology. This was demonstrated for PAA 8-amino-2-methyl-quinoline, which was added during the course of the study in the certified standard. No trace of said PAA was detected post-analysis in the CWE of samples printed with colour index PO13.
Mass accuracy
The mass accuracy compared to the theoretical mass was evaluated at a concentration of 2 µg L−1 for the 35 PAAs and it was found that the mass deviation is less than 2 ppm for most of the PAAs, except for aniline, p-phenylenediamine and the isomers of toluidine. For p-phenylenediamine and the toluidine isomers, the mass deviation was found to be below 5 ppm, whereas for aniline the mass deviation was 6 ppm (see ). Therefore, for aniline, the mass accuracy was set up manually at 6 ppm to allow calibration and quantification of the molecule. This could probably be explained by aniline having the lowest mass (93 Da) of all PAAs.
Isomers determination
In case of isomers, e.g. for o/m/p-toluidine, 2 or 4-aminobiphenyl and 3/4/5-chloro-o-toluidine, the use of the Full Scan mode is not specific enough to determine the specific PAA as they cannot be differentiated by their mass. In that case, the pure standard was ordered from Sigma Aldrich and injected after dilution in acetonitrile. Each specific isomer was identified individually according to their corresponding retention time (see ). The most critical was the identification of the toluidine isomers that were in a small window of retention time. However, the separation of o-toluidine, p-toluidine and m-toluidine was found to be acceptable with their respective retention time of 2.41 min, 2.61 min and 2.75 min.
Determination of LOD and LOQ – LC/HRMS
As allowed by the International Conference for Harmonisation, the LOD was visually determined by injecting decreasing concentration from 50 µg L−1 to 0.2 µg L−1. The limit of quantification was defined as the lowest level of analyte determined with acceptable precision and trueness. The LOD determination was performed using six replicates allowing to minimise the variability due to the analytical instrument. Correspondingly, the LOQ was calculated according to the following formula: LOQ = 3.3 x LOD. Mandel’s fitting test was applied to check for linearity and the linear model was found to be representative of the PAAs.
Recovery
Trueness was evaluated by determination of the recovery with spiked samples at 2 and 5 µg L−1 (see ). The inter-day recovery was measured for a week by analysing spiked samples of water. The recovery was evaluated between 90% and 110% for most of the PAAs, except for 3,3ʹ-dichlorobenzidine, 3,3ʹ-dimethoxybenzidine, o-aminoazotoluene and 4,4ʹ-methylenebis(2-chloroaniline) where the recovery was found to be higher than 110%. Benzidine was found to have the lowest recovery at 67% and 87% at 2 and 5 µg L−1 respectively.
Figure 2. Siegwerk Fr - Recovery after standard addition by spiking at 2 and 5 µg L−1.
Interpretation of the analytical results and discussion of the transfer of the PAA from coloured napkins into CWE
The results of the PAA found in the CWE for both laboratories are shown in (Pigments Red), (Pigments Yellow) and (Pigments Orange or PO and extender values), with at the bottom of the table the pigment analyses.
Table 7. Overview PAA analyses from the CWE at Siegwerk and Ferro and Pigments analyses for the Pigments Red
Table 8. Overview PAA analyses from the CWE at Siegwerk and Ferro and Pigments analyses for the Pigments Yellow
Table 9. Overview PAA analyses from the CWE at Siegwerk and Ferro and Pigments analyses for Pigment Orange and extenders
For each individual colour index, the pigment samples were differentiated by supplier, grade, batch number and ink number when necessary.
Origin of the PAAs
This study took place in a context of a preselection of suitable raw materials and typically pigments for the preparation of inks suitable for food contact applications. The level of impurities from pigments is thus already very low, at the exception of the comparative example PY74 A. 35 PAAs from were examined and quantified via LC-HRMS at Siegwerk, while in general only the expected PAAs originating from the corresponding colour index used were analysed at Ferro Be. Indeed, PAAs present in the ink may be originating from traces of unreacted raw material or raw material degradation during pigment synthesis, ink manufacture (temperature, time and/or pH during the grinding step) or cold water extraction. As an example, PY111 is synthesised by the reaction of the diazonium salt of PAA p-nitro-o-anisidine (CAS 97–52-9) with coupling agent 5ʹ-chloro-2ʹ-methoxyacetoacetanilide (CAS 52793–11-0), the latter having been synthesised from PAA 5-chloro-2-methoxyaniline (CAS 95–03-4).
Regarding the detected PAA after CWE of the napkins printed with mono-pigmented ink (further referred to as samples), aniline was found in samples PR122, PR184 and PO13. o-Anisidine and p-nitro-o-anisidine were found in samples PY74 whereas 5-chloro-2-methoxyaniline and 5-chloro-o-toluidine were detected, respectively, in samples PY111 and PR184. 3-amino-4-methoxybenzanilide and 4-chloro-2,5-dimethoxyaniline were found at significant levels in samples PR184 at both laboratories whereas p-toluidine was detected in sample PR122. Dimethylamino terephthalate was found at both labs in samples printed with PY155, and additionally, 1-methyl-2-aminoterephthalate, 2-amino-4-(MeO-carbonyl)benzoic acid and 2-amino-terephthalic acid were found at Ferro Be in these samples. Finally, 8-amino-2-methylquinoline was quantified in sample PY138 by LC-MS/MS and identified as slightly below the LOQ of 1.65 µg L−1 by LC-HRMS.
If we look at the PAA found by the analyses performed at Siegwerk Fr, we can confirm that only the expected amines from the pigments used are detected at significant level (>1 µg L−1), which confirms that for this food contact material the pigments are the primary origin of PAAs.
This is further confirmed by the pigment analyses (see -). It means that the transfer of information along the value chain is decisive and could definitively help to avoid false-positive results or having to assess the presence of unexpected, specific PAA(s). Cooperation between pigment manufacturers, ink producers and the final customers in charge of compliance checking of the final article is thus a real-added value.
Method comparison and correlation between pigment analysis and CWE results
Although LC-MS/MS using multiple reaction monitoring (MRM) is still a highly sensitive analytical equipment (see and ) having a lower LOD, it is shown that LC-HRMS based on Orbitrap technology can be considered a good alternative to LC-MS/MS, even in challenging applications such as CWE of napkins.
Sixteen tissue samples representing seven different colour indexes were studied (14 samples at both laboratories) showing good qualitative results if we consider that at significant level (>1 µg L−1) the expected PAAs were by majority positively detected in the corresponding CWE at both laboratories, except occasionally for 3-amino-4-methoxybenzanilide and 8-amino-2-methylquinoline, for which larger differences were observed.
The reproducibility was proven to be highly dependent on compound, colour index and ink formulation. With respect to the correlation with the pigment purity, the PAA content of a series of pigment samples of the studied colour indexes after pigment extraction according to AP (89) 1 could not be statistically correlated with the quantified amounts after CWE according to EN 645 by the limited sample population. Nevertheless, trends were observed for colour indexes PR122, PR184, PY155 (see and ), and even for PY74 (see ), where a lower PAA content in the pigment according to AP (89) 1 seemingly corresponded with a lower PAA content in the CWE.
The results for PAA in the CWE of tissues printed with PR122 were generally reproducible, regardless of the measuring technology and did not lead to discrepancies in terms of compliance, if we define the BfR threshold recommendations for the found PAAs of 0.01 mg kg−1 foodstuff. It is important to notice that despite the fact that both pigment samples PR122 A and PR122 B (sourced from two different suppliers) have a very similar purity profile (total PAA content of, respectively, 33.5 and 32.4 mg kg−1 pigment), extraction of PAA from the napkins prepared with the ink containing pigment PR122 B is higher than from the napkins prepared with the ink containing pigment PR122 A. That means that below a certain level of impurity, there is no linear correlation between the residual PAA content on the pigment and the extraction of said PAA into the CWE. A possible explanation can be an influence of the pigment surface treatment or the pigment manufacturing process on the PAA behaviour with respect to their transfer to the inks or to the CWE. As a consequence, the validation of a pigment to be used in inks for food contact application cannot be deducted solely from the pigment analysis and additional migration and/or extraction tests of the FCM are required for each individual pigment sample (different suppliers or different grades) independently of their purity profile. The presence of aniline in the cold water extracts can be explained from the production process of primary aromatic amines, as being manufactured in multi-step processes from aromatic hydrocarbons. For instance, small quantities of benzene present in toluene will result in its conversion to aniline during the production process of o-, m- or p-toluidine, and will be present as trace impurity during the manufacture of PR122.
The results for tissues printed with PR184 showed a variability for aniline comparable to PR122, somewhat higher variability for 4-chloro-2,5-dimethoxyaniline and 5-chloro-o-toluidine, and exceptionally high variability for compound 3-amino-4-methoxybenzanilide. The observed variability for the last compound is caused by bias, with a systematically higher amount quantified via LC-MS/MS as compared to LC-HRMS. Also, in the case of PR184, for the same napkin, total extraction of PAA as their sum can be above or below the BfR recommendation of 0.01 mg PAA (as their sum) per kg foodstuff, depending on the equipment used, leading to discrepancies for compliancy.
The two analytical methodologies (based on either LC-MS/MS or LC-HRMS) were in agreement for the CWE of samples printed with PO13 for PAA aniline on the first sample, but the variance increased on the next two samples. The final release of PAA into the food simulant varied from 4 to 13 µg kg−1 foodstuff, a level not drastically lower compared to pigments containing more PAA as impurities. The nature of the PAA and their solubility are thus determinative. For instance, the high water solubility of aniline results in a relatively high level in the CWE, taking into consideration the low residual amount quantified on pigment PO13.
Differences were observed for o-anisidine and p-nitro-o-anisidine in extracts of samples printed with PY74 between the methodology via LC-MS/MS and LC-HRMS, the latter quantifying somewhat higher amounts of o-anisidine, but lower amounts of p-nitro-o-anisidine. The pigment analysis according to AP (89) 1 of PY74 A, which is a general purpose PY74 from the market for ink application, but not specifically recommended for food contact applications, showed a high level of residual amount of o-anisidine and p-nitro-o-anisidine. Said level was reflected in the CWE of the napkins prepared with this pigment, the CWE having high levels of both PAA. From this example, we observe that the first criteria for the initial screening for compliancy of a new pigment grade or supplier as raw material are pigment purity profile against the compliant reference pigment and supplier recommendation on suitability for the targeted food contact material. Hence, not all the commercially available pigments for inks will be suitable for food contact application. From the results in this article, we show using the CWE results of the napkins prepared with PY74 C (low trace amount of o-anisidine after pigment extraction according to AP (89) 1), that the selection of the right pigment grade based on its purity profile is essential, but not necessarily sufficient, to produce a compliant FCM for the consumer in terms of PAA extraction below the recommended applicable thresholds (0.002 or 0.01 mg kg−1 foodstuff).
The quantified amount of 5-chloro-2-methoxyaniline was comparable for tissues printed with PY111. PAA 8-amino-2-methylquinoline was quantified at Ferro Be on napkins containing PY138, and identified at Siegwerk Fr as slightly below the quantification limit, showing a trend for both methodologies. Finally, the variability of PAA dimethyl aminoterephthalate was high for printed tissues containing PY155 owing to a bias between the two measurement methodologies, the amount quantified by LC-MS/MS is up to 3.4 times higher than the amount quantified by LC-HRMS.
Conclusions
This study is a first-time study initiated by two stakeholders from the pigment and printing industry, showing the willingness of the industry to improve their products from a safety point of view and to comply with current and future regulations. Napkins were printed using a specific batch of pigment (in the yellow, orange and red spectrum) and the trace PAAs were analysed for both pigment and printed napkins. The pigment purity profile was analysed at Ferro Be according to AP (89) 1 whereas CWE of printed napkins were conducted in the laboratories of Ferro Be and Siegwerk Fr. Thus, a comparison between these laboratories that apply a similar cold water extraction methodology and different analytical equipment was made. And last but not least, a new method using LC-HRMS was developed for the quantification of PAAs in CWE and compared with LC-MS/MS.
It was found that only the expected PAAs (or possible impurities originating from the pigment chemistry) from the corresponding colour index were detected. No contamination originating from unexpected PAAs was detected at significant level (>1 µg L−1) in any of the printed samples. The disclosure of the pigments used in the ink formulation is consequently a real-added value in the understanding of the possible PAA extraction/migration, and technical exchange between the stakeholders of the value chain, good documentation and traceability from the pigments used is of high importance.
In this study, the correlation between PAA content in pigments and the observed extraction from the final article (napkins) was evaluated. It was shown that a pigment for standard applications having a high level of PAA would not be compliant for napkin applications (PY74 A at 320 mg total PAA per kg pigment). The pigment purity profile determination is therefore useful for the ink producers as a first screening in their raw material selection to eliminate pigments having high amounts of PAA. However, at very low level of impurities, there is no linear correlation between the pigment purity profile and its ability to fulfil the regulations for FCMs. Thus, even though the pigment purity profile is a crucial parameter to fulfil the regulations for FCMs, defined pigment purity criteria are by themselves not sufficient to achieve compliancy, even on a specific colour index. In order to comply with current regulations and recommendations, a strict selection of pigments having a high purity profile and CWE measurements are therefore both necessary for printed tissues for food contact applications.
The current study also demonstrated that azo-based pigments can be used for sensitive applications such as printed napkins, if a low residual PAA amount in the pigment is guaranteed and the final food contact material is compliant for the relevant regulations and recommendations. Non-azo pigments such as PR122 and PY138 are not inherently safer than their azo counterparts, since these pigments are manufactured with PAAs as raw materials or can generate PAA in their degradation.
Moreover, a collaborative study on CWE (included the preparation step) was conducted on 14 samples between both laboratories. All samples were analysed at both laboratories using either LC-MS/MS at Ferro Be, or LC-HRMS based on Orbitrap technology at Siegwerk Fr. It was demonstrated that high-resolution equipment is sensitive enough for CWE and the comparative results between both laboratories were shown to be qualitatively good. If we consider the number of variability factors (colour index, matrix, extraction step, analytical method, influence of inks formulation, pigment surface treatment, influence of the milling conditions such as time and temperature), the inter-laboratory study has shown adequate to good correlation, taking into account the reproducibility previously published by independent inter-laboratory trials (Merkel et al. Citation2015; DIN Citation2019) and the inherent variability according to the Horwitz equation (Thompson Citation2004).
However, on all the common PAA analysed in both laboratories, compound-specific variability was noticed. For instance, we observed a good correlation between the two laboratories for PAA p-toluidine and 5-chloro-o-toluidine, whereas 3-amino-4-methoxybenzanilide and p-nitro-o-anisidine had a lower correlation, which can be explained by the possible influence factors listed above. As a consequence, the observed discrepancies and analytical variations can result in a different outcome in compliance in terms of maximum allowable PAA content (individual and their sum) in the CWE of the FCM. Hence, it highlights the difficulty to validate a sensitive product based on a single analysis (pigment analysis according to AP (89) 1 or CWE of printed napkins). We consider therefore that these analyses should be part of a more global assessment by the combination of pigment purity analysis and final food contact material compliance testing in the targeted application(s), the food contact material having been prepared under worst-case conditions.
Supplemental Material
Download MS Word (110.6 KB)Acknowledgments
This work was partially funded by the Vlaams Agentschap Innoveren & Ondernemen (VLAIO, Belgium) under Grant HBC 2016-0265.
The authors thank Lucas Pontier from Siegwerk analytical team for his technical support on this project and Thermo Electron SAS for kindly supporting the method development by means of their application support and on Q-Exactive Focus instrument.
Disclosure statement
No potential conflict of interest was reported by the authors.
Supplementary material
Supplemental data for this article can be accessed on the publisher’s website.
Additional information
Funding
References
- Aznar M, Canellas E, Nerín C. 2009. Quantitative determination of 22 primary aromatic amines by cation-exchange solid-phase extraction and liquid chromatography–mass spectrometry. J Chromatogr A. 1216(1–2):5176–5181.
- [BfR] Bundesinstitut für Risikobewertung [German Federal Institute for Risk Assessment]. 2013. Opinion No. 021/2014 of 24 July 2013. Primary aromatic amines from printed food contact materials such as napkins or bakery bags. https://www.bfr.bund.de/cm/349/primary-aromatic-amines-from-printed-food-contact-materials-such-as-napkins-or-bakery-bags.pdf
- [BfR] Bundesinstitut für Risikobewertung [German Federal Institute for Risk Assessment]. 2019. Recommendation No. XXXVI of 01 June 2019. Paper and Board for food contact. https://bfr.ble.de/kse/faces/resources/pdf/360-english.pdf
- Campanella G, Ghaani M, Quetti G, Farris S. 2015. On the origin of primary aromatic amines in food packaging materials. Trends Food Sci Tech. 46(1):137–143.
- [CoE] Council of Europe. 1989. Resolution AP (89) 1 on the use of colourants in plastic materials coming into contact with food. Council of Europe.
- [DIN] Deutsches Institut für Normung e. V. 1993. DIN EN 645. Paper and board intended to come into contact with foodstuffs, preparation of cold water extract, German version.
- [DIN] Deutsches Institut für Normung e. V. 2019. DIN EN 17163. Pulp, paper and board - Determination of primary aromatic amines (PAA) in a water extract by a LC-MS method; German version.
- [EC] European Commission. 2004. Regulation (EC) No 1935/2004 of the European parliament and of the council of 27 October 2004 on materials and articles intended to come into contact with food and repealing directives 80/590/EEC and 89/109/EEC. Off J Eur Union L. 338:4–17.
- [EC] European Commission. 2006. Commission Regulation (EC) No 2023/2006 of 27 December 2006 on good manufacturing practice for materials and articles intended to come into contact with food. Off J Eur Union L. 384:75–78.
- [EC] European Commission. 2008. Regulation (EC) No 1272/2008 of the European parliament and of the council of 16 December 2008 on classification, labelling and packaging of substances and mixtures, amending and repealing Directives 67/548/EEC and 1999/45/EC and amending regulation (EC) No 1907/2006. Off J Eur Union L. 353:1–1355.
- [EC] European Commission. 2011. Commission regulation (EU) No 10/2011 of 14 January 2011 on plastic materials and articles intended to come into contact with food. Off J Eur Union L. 12:1–89.
- [EURL] European Union Reference Laboratory. Robouch P, Stroka J, Haedrich J, Schaechtele A, Wenzl T. 2016. Guidance document on the estimation of LOD and LOQ for measurements in the field of contaminants in feed and food. https://publications.jrc.ec.europa.eu/repository/bitstream/JRC102946/eur%2028099%20en_lod%20loq%20guidance%20document.pdf
- Koster S, Bani-Estivals MH, Bonuomo M, Bradley E, Chagnon MC, Garcia ML, Godts F, Gude T, Helling R, Paseiro-Losada P, et al. 2015. Guidance on best practices on the risk assessment of non-intentionally added substances (NIAS) in food contact materials and articles. Brussels (BE): International Life Science Institute Europe (ILSI Europe). Report No.: D/2015/10.996/39.
- Lambertini F, Di Lallo V, Catellani D, Mattarozzi M, Careri M, Suman M. 2014. Reliable liquid chromatography-mass spectrometry method for investigation of primary aromatic amines migration from food packaging and during industrial curing of multilayer plastic laminates. J Mass Spectrom. 49(9):870–877.
- Mattarozzi M, Lambertini F, Suman M, Careri M. 2013. Liquid chromatography–full scan-high resolution mass spectrometry-based method towards the comprehensive analysis of migration of primary aromatic amines from food packaging. J Chromatogr A. 1320:96–102.
- McCall E, Keegan J, Foley B. 2012. Primary aromatic amine migration from polyamide kitchen utensils: method development and product testing. Food Addit Contam A. 29(1):149–160.
- Merkel S, Kappenstein O, Sander S, Weyer W, Richter S, Pfaff K, Luch A. 2018. Transfer of primary aromatic amines from coloured paper napkins into four different food matrices and into cold water extracts. Food Addit Contam A. 35(6):1223–1229.
- Merkel S, Richter S, Weyer J, Kappenstein O, Pfaff K, Luch A. 2015. Inter-laboratory comparison study on the determination of primary aromatic amines in cold water extracts of coloured paper napkins. Food Addit Contam A. 32(8):1367–1372.
- Mortensen SK, Trier XT, Foverskov A, Petersen JH. 2005. Specific determination of 20 primary aromatic amines in aqueous food simulants by liquid chromatography–electrospray ionisation-tandem mass spectrometry. J Chromatogr A. 1091(1–2):40–50.
- [NL] The Netherlands. 2014. Regeling van de Minister van Volksgezondheid, Welzijn van 14 maart 2014, kenmerk 328583-117560-VGP, houdende vaststelling van de Warenwetregeling verpakkingen en gebruiksartikelen die in contact komen met levensmiddelen; [accessed 2020 Jun 09]. https://wetten.overheid.nl/BWBR0034991/2019-12–14
- Paseiro-Cerrato R, Noonan G, Begley T. 2014. Development of a rapid screening method to determine primary aromatic amines in kitchen utensils using direct analysis in real time mass spectrometry (DART-MS). Food Addit Contam A. 31(3):537–545.
- Perez MÂF, Padula M, Moitinho D, Bottoli CBG. 2019. Primary aromatic amines in kitchenware: determination by liquid chromatography-tandem mass spectrometry. J Chromatogr A. 1602:217–227.
- Sanchis Y, Coscollà C, Roca M, Yusà V. 2015. Target analysis of primary aromatic amines combined with a comprehensive screening of migrating substances in kitchen utensils by liquid chromatography–high resolution mass spectrometry. Talanta. 138:290–297.
- Sendón R, Bustos J, Sánchez JJ, Paseiro P, Cirugeda ME. 2010. Validation of a liquid chromatography–mass spectrometry method for determining the migration of primary aromatic amines from cooking utensils and its application to actual samples. Food Addit Contam A. 27(1):107–117.
- Thompson M. 2004. AMC Technical Brief No. 17, The Amazing Horwitz Function. [Cambridge (UK)]: Royal Chemical Society; [accessed 2019 Nov 18]. https://www.rsc.org/images/horwitz-function-technical-brief-17_tcm18-214859.pdf
- Yavuz O, Valzacchi S, Hoekstra E, Simoneau C. 2016. Determination of primary aromatic amines in cold water extract of coloured paper napkin samples by liquid chromatography-tandem mass spectrometry. Food Addit Contam A. 33(6):1072–1079.