
 ?Mathematical formulae have been encoded as MathML and are displayed in this HTML version using MathJax in order to improve their display. Uncheck the box to turn MathJax off. This feature requires Javascript. Click on a formula to zoom.
ABSTRACT
In food safety, process pathway risk assessments usually estimate the risk of illness from a single hazard and a single food and can inform food safety decisions and consumer advice. To evaluate the health impact of a potential change in diet, we need to understand not only the risk posed by the considered hazard and food but also the risk posed by the substitution food and other potential hazards. We developed a framework to provide decision-makers with a multi-faceted evaluation of the impact of dietary shifts on risk of illness. Our case study explored exposure to inorganic arsenic (iAs) and aflatoxins through consumption of infant cereals and the risk of developing lung, bladder and liver cancer over a lifetime. The estimated additional Disability-Adjusted Life Year (DALY) in the U.S. from exposure to iAs and aflatoxin based on available contamination and consumption patterns of infant rice and oat cereal is 4,921 (CI 90% 414; 9,071). If all infant cereal consumers shift intake (maintaining equivalent serving size and frequency) to only consuming infant rice cereal, the predicted DALY increases to 6,942 (CI 90% 326; 12,931). If all infant cereal consumers shift intake to only consuming infant oat cereal, the predicted DALY decreases to 1,513 (CI 90% 312; 3,356). Changes in contaminant concentrations or percent consumers, that could occur in the future, also significantly impact the predicted risk. Uncertainty in these risk predictions is primarily driven by the dose-response models. A risk-risk analysis framework provides decision-makers with a nuanced understanding of the public health impact of dietary changes and can be applied to other food safety and nutrition questions.
Introduction
Research to inform public health policies for foods and diet has traditionally been based on assessing risks of a microbial or chemical hazard of concern or on assessments of risk or benefits of the lack or surplus of foods and nutrients (Pires et al. Citation2019). A product pathway food safety risk assessment typically estimates the risk of illness from a single hazard from consumption of a single food in a population group (e.g. pregnant women or children) or the total population of interest (FDA Citation2002). Results of such risk assessments can inform food safety and consumer advice and such advice can lead to changes in consumer diets. To more fully evaluate the health impact of such recommendations, additional research is needed. One such tool is a risk-risk analysis which can provide quantitative predictions on the impact on risk of substituting one food or component in the diet for another (Thomsen et al. Citation2019).
In 2016 the United States Food and Drug Administration (FDA) published a risk assessment on inorganic arsenic (iAs) in rice and rice products (FDA Citation2016b). Arsenic (As) naturally occurs in the environment (air, soil, water, food) and the inorganic form (iAs) is the primary toxic form with evidence that increased cancer (notably lung and bladder) in adults can result from exposure during early life (FDA Citation2016b). The FDA risk assessment provided a quantitative estimate of cancer (lung and bladder) occurrence from long-term exposure to iAs in rice and rice products. The risk assessment predicted that an infant not fed any rice or rice products has an approximate 6% lower chance on average of developing lung or bladder cancer attributable to iAs over a lifetime relative to infants that consumed rice or rice products (FDA Citation2016b). Results of the risk assessment together with data on iAs levels in rice infant cereal and an achievability assessment (FDA Citation2016d) were used to inform guidance for industry (FDA Citation2020b) and advice for pregnant women and infants to eat a variety of grains (FDA Citation2016c). At that time, FDA did not have available the modelling framework to quantify health impact trade-offs associated with this recommendation. In this study, we have begun to develop that modelling framework and provide first results on cancer risk trade-offs associated with different types of infant cereals.
Commercial boxed infant cereal type products available in the U.S. market include rice (white and brown), oat, wheat and multigrain (which contains rice, oat and wheat). The National Health and Nutrition Examination Survey (NHANES) data from 2003 to 2016 indicate the majority of infants in the U.S. do not consume brown rice, wheat or multigrain cereal (CDC Citation2016). Therefore, the focus of our study was a comparison of the cancer risks associated with consumption of infant white rice cereal and oat cereal.
In addition to the possible presence of iAs, mycotoxins such as aflatoxins (AFs), ochratoxin A (OTA), fumonisins (FB), deoxynivalenol (DON), and zearalenone (ZEN) can be present on cereals (Zhang et al. Citation2018). Of all potential mycotoxins present in oat and rice cereals, aflatoxins are the only ones considered Group I human carcinogens by the International Agency for Research on Cancer (IARC Citation2012). Its most toxic form, Aflatoxin B1, is characterised as the most potent naturally occurring chemical liver carcinogen among aflatoxins (Khlangwiset et al. Citation2011). Ochratoxin A and FB are considered potentially carcinogenic to humans (Group 2B) (Zhang et al. Citation2018). In a survey of 215 retail samples of infant/toddler foods and breakfast cereals in the U.S., oat-based infant cereals were found more susceptible to mycotoxin contamination as compared to rice-based infant cereals (Zhang et al. Citation2018). A substitution from rice-based infant cereals to oat-based infant cereals might thus reduce infant exposure to iAs but possibly increase infant exposure to mycotoxins with an unknown impact on risk of illness from cancer.
The objective of this study was to develop a risk-risk modelling framework to provide decision-makers with a multi-faceted evaluation of the impact of dietary shifts on risk of illness in the U.S. population and to apply it to a case study on white rice and oat infant cereal that complements the risk assessment of arsenic in rice and rice products (FDA Citation2016b). This study examines lung cancer and bladder cancer as health effects from iAs exposure and liver cancer from aflatoxin exposure. We chose aflatoxin as the mycotoxin of comparison because, of the mycotoxins present on infant cereals, it is the one with the most potent effect on human health.
Materials and methods
Risk-risk analysis framework
Consensus principles of risk analysis and risk assessment have been well described by international organisations including the Codex Alimentarius Commission (CAC) and the Joint Food and Agriculture Organization of the United Nations and World Health Organization (FAO/WHO) as part of the Food Standards Programme (CAC Citation2003). The outcome of a quantitative risk assessment is an estimate (including a measure of its uncertainty) of the public health impact of the exposure to the hazard through a food and can be expressed as a probability of illness per serving or by the number of expected cases of illness given a period of time. A risk-risk analysis includes individual quantitative risk assessments for each considered food-hazard pair that are then combined or compared. We used the established principles of risk assessment as the underlying framework, starting at the exposure assessment phase of a risk assessment and including hazard characterisation and risk characterisation steps. We then added the comparison of the risk (risk-risk analysis) for the two different foods (and from both contaminants) given current consumption patterns (baseline) or a change in consumption patterns. The model estimates risk for the baseline model input parameters as well as predicts the relative risk given different scenarios (i.e., changes in the model input parameters). The foods considered were infant white rice and oat cereals, the hazards were food contaminants iAs and aflatoxins, and the health endpoints for which risk was quantitatively evaluated were iAs-mediated lung and bladder cancer and aflatoxin-mediated liver cancer.
In the following sections, we describe in detail the data included and the modelling approaches and choices employed for each step of the risk-risk analysis.
Exposure assessment from inorganic arsenic and aflatoxins in infant cereal
Data on infant cereal contamination with inorganic arsenic
We used the most current data available for estimates of prevalence and levels of iAs in infant white rice and oat cereals from two FDA surveys, (1) Fong Sam (Citation2018) and (2) FDA’s Toxic Elements in Foods and Foodware Monitoring Programme (FDA Citation2020a). The full details of the survey design and sample analysis are provided in the reports noted above. Briefly, infant white rice cereal (n = 122) and oatmeal cereal (n = 19) samples were collected from retailers in the U.S. in 2017 and 2018. Samples of infant cereals that contained other ingredients in addition to the main grain were not included in the present risk analysis. Two methods were used for sample analysis, EAM method 4.7 (FDA Citation2015) for total arsenic analysis and EAM method 4.11 (FDA Citation2012) for arsenic speciation when the sample was determined to contain greater than 100 ng/g total arsenic. We assumed that 70%-90% of the iAs was bioavailable (FDA Citation2016b).
Recognising the most current surveys included a limited number of oat infant cereal samples evaluated for iAs, we separately evaluated data from an earlier survey from FDA’s Toxic Elements in Foods and Foodware Monitoring Program for iAs in infant rice and non-rice cereals posted in 2016 (FDA Citation2016a) to provide insight into the robustness of the baseline results.
Data on aflatoxin concentration in infant cereals
For estimates of aflatoxin concentrations in infant cereals, we used data from two surveys, Al-Taher et al. (Citation2017) and Zhang et al. (Citation2018). In both surveys, AFB1, AFB2, AFG1, AFG2 concentrations were quantified in infant white rice or oat cereal samples using LC-MS/MS technology. A total of 37 infant white rice cereal and 38 infant oat cereal samples were available from these surveys included in our analysis.
Aflatoxin is rapidly absorbed (tmax = 1 hr) in humans (Jubert et al., Citation2009). While there are no absolute bioavailability data for aflatoxin in humans, the absorption rate is expected to be high given data from animal studies (JECFA Citation2018). Therefore, we assumed 100% bioavailability of aflatoxin from infant white rice and oat cereals, though we recognise this may be an overestimation.
Estimating prevalence and concentration of iAs and aflatoxins in infant white rice and oat cereal
A parametric bootstrap method was implemented to estimate the uncertainty surrounding the mean contaminant concentrations in infant white rice and oat cereal. Parametric distributions were fit to the available data using the fitdistrplus package (Delignette-Muller and Dutang Citation2015). Quality of fit to the distributions was assessed visually and the best fitting distribution, based on Akaike’s information criterion, was used for a parametric bootstrap of the mean of the concentration. Only total arsenic data were available for oat. For As (in oat) or iAs (in white rice), lognormal and gamma distributions were tested. An uncertainty distribution for the proportion of iAs among As was derived from data obtained on white rice cereals and applied to iAs in oat. For this proportion, beta, lognormal and gamma distributions were tested. For mycotoxins, methods based on censored data (Delignette-Muller and Dutang Citation2015) were used for values below the limit of detection. In addition to the lognormal and gamma distributions, zero-inflated lognormal and zero-inflated gamma distributions were tested for aflatoxins. and provide the mean concentrations and uncertainty distributions derived and used in the present study. We assumed these data are representative for white rice and oat infant cereals available in the U.S.
Table 1. Characteristics of the concentration in iAs and Aflatoxin in white rice and oat infant cereal
Figure 1. Distribution of aflatoxin and iAs concentrations (g/g) in oat and white rice infant cereals including the number of simulated values. Where the straight black line is the mean value (including the lower (5%), median (50%) and upper (90%) confidence interval of the baseline in the dotted lines)
Data on consumption of infant cereal
We estimated mean daily intakes of dry infant white rice and oat cereals by individuals <1 year of age based on data from What We Eat In America (WWEIA), the food consumption component of the National Health and Nutrition Examination Surveys (NHANES) (CDC Citation2016), 2003–2016 cycles. In this survey, caregivers are asked to report the approximate ratio of dry cereal to liquid for dilution and these two amounts are recorded separately. For this study, we only included the amounts of dry cereal consumed. Consumption data included in these analyses were limited to data for individuals for whom adult proxies had provided two 24-h recalls. Mean daily intakes of dry infant white rice and oat cereals were estimated as the mean intake per day over the two days of recalls. Statistical weights for the 2-day WWEIA/NHANES sample were used in all analyses. Overall, 1,041 individuals <1-year-old consumed white rice or oat infant cereal at least once during the two 24 h-recall. These individuals represent, on average, 42.3% of individuals aged <1-year-old. illustrates the marginal (infant rice or oat cereal consumed) and joint (both infant rice and oat cereal consumed) distributions of the consumption of these cereals.
Figure 2. Joint and marginal consumption of oat and white rice infant cereals per day
Hazard characterisation: dose-response models
Aflatoxin dose-response model
Aflatoxins are classified as a human carcinogen and the main outcome is a hepatocellular carcinoma. For carcinogens, there is no threshold where small doses elicit no response (it is assumed that carcinogens have an effect at any dose, and we assumed a linear dose-response for the low dose considered in our study (FAO/WHO Citation2018). FAO/WHO (Citation1998) estimates 0.010 cancers per year per 100,000 individuals at an exposure rate of 1 ng aflatoxin B1/kg body weight per day, for HBsAG- (hepatitis B negative) people, with an uncertainty range of 0.002 to 0.030 cancer illnesses per year. FAO/WHO (Citation2018) updated this estimate in 2018 to 0.017 cases per year per 100,000 individuals for HBsAg− individuals at an exposure rate of 1 ng aflatoxin B1/kg body weight per day, with an upper bound of 0.049 cases per year. The weighted average lifetime exposure for the U.S population is 78.69 years (The World Bank Group Citation2015). Over this 78.69-year lifetime, the risk is then calculated to be 0.017 × 78.69 = 0.77 cancer illnesses per 100,000 people, or 1.34 × 10⁻⁵ per person, when the rate of exposure is 1 ng per kg body weight per day. In order to consider uncertainty around the estimate of the number of cases, we used a pert distribution so that the median number of cases per year per 100,000 people was 0.017, with an upper bound of the 95% CI being 0.049 and with a lower value of 0 ().
Figure 3. Dose-response models for exposure to aflatoxin (ng/kg/day) (top) and iAs (µg/kg/day) (middle and bottom) and the risk of liver (top), lung (middle) and bladder (bottom) cancer. Where the straight black line is the mean value (including the 90% confidence envelope as the grey area)
Inorganic arsenic dose-response model
We used the FDA (Citation2016b) iAs dose response model that can be considered linear at the low exposure level of iAs. It would not be possible to evaluate the additional risk linked to exposure of iAs in infant cereal using a non-linear model without knowing the exposure linked to other foods and other potential sources at higher doses where the FDA (Citation2016b) model is not linear anymore. The FDA (Citation2016b) dose-response model largely relies on data and modelling assumptions identified in a report by the Joint FAO/WHO Expert Committee on Food Additives (JECFA) (FAO/WHO Citation2011). A prospective cohort study in north-eastern Taiwan was selected by the JECFA committee as the pivotal study for bladder cancer (Chen et al. Citation2010b) and lung cancer (Chen et al. Citation2010a) risk assessment. From these data, bootstrapping and model averaging were used to derive a dose response including data and model uncertainty FDA (Citation2016b) (). The FDA (Citation2016b) model median predicted cases per million for lung cancer at a 0.029, 0.3, 1, 3 and 10 µg/kg bw/day with lifetime exposure were reported to be 32 (90%CI 0, 62), 336 (90%CI 0, 654), 1,123 (90%CI 0, 2178), 3,399 (90%CI 0, 6,517), and 11,674 (90%CI 0, 21,549), respectively. Median predicted cases per million for bladder cancer at a 0.029, 0.3, 1, 3 and 10 µg/kg bw/day with lifetime exposure were 11 (90%CI 0, 43), 114 (90%CI 0, 458), 383 (90%CI 0, 1,525), 1,186 (90%CI 1, 4,568), 4,461 (90%CI 151, 15,144), respectively (FDA Citation2016b). See FDA (Citation2016b) for a complete description of the model and assumptions.
Estimating risk of illness from inorganic arsenic and aflatoxin
The additional exposure to iAs (Ea) and aflatoxin (Em) (ng/day/kg), over a lifetime per kg of body weight, linked to the consumption of infant cereal during the first year of age, was modelled, separately, as a sum of the exposure linked to white rice and oat infant cereal (see EquationEquation 1(1)
(1) and EquationEquation 2)
(2)
(2) . For each individual,
where i is an index for the individual consumer; Coi and Cri are the average daily consumption of oat and rice (g/day), respectively; Wi is the body weight (kg); Ao and Ar are the mean level of iAs in oat cereal and white rice cereal (ng/g), respectively; Ba and Bm are the bioavailability of iAs and aflatoxins; Mo and Mr are the levels of aflatoxins in oat cereal and white rice cereal (ng/g), respectively; La and Lm are the duration of the lifetime exposure considered for iAs and aflatoxins (years), respectively.
The additional risk of illness from cancer can be estimated using EquationEquations (3(3)
(3) ) and (Equation4
(4)
(4) ) for iAs and EquationEquation (5)
(5)
(5) for aflatoxins.
where Rbi Rlui Rlii is the additional risk of bladder, lung and liver cancer for individual i and DRab, DRalu, DRmli represent the dose-response (DR) for iAs for risk of bladder cancer (ab), the dose-response for iAs for risk of lung cancer (alu) and the dose-response for aflatoxins for risk of liver cancer (mli), respectively. and
are defined as above.
The mean risk of various cancer for the population is evaluated using a weighted mean of the risk over individuals i for the population, the NHANES sampling weight being used for each individual i. We estimated the expected number of additional cancer cases in the US (Ec) using EquationEquation (6)(6)
(6) .
where c represents each cancer type, R is the risk, Pop is the U.S. population and p is the proportion of oat or white rice infant cereal consumers.
The overall DALY (disability adjusted life year) lost from these additional cancer cases are evaluated using a DALY of 19.4 for liver cancer, 4.22 for bladder cancer and 14.4 for lung cancer (FDA/JIFSAN/RSI Citation2017). See FDA/JIFSAN/RSI (Citation2017) for a complete description of the methods and assumptions behind the DALY estimates.
An individual switching from white rice cereal consumption to oat cereal consumption would change his/her exposure from EquationEquation (1)(1)
(1) to
where would be their “new” level of consumption of oat cereal. In the absence of data on the difference between
and
, we assumed that the previous amount of white rice consumed (g/day) would be switched to oat, leading to
Model and visualisation tool
The model was built in R (R Core Team Citation2017) and provides an estimate of the additional number of cases of illness, as well as the corresponding DALY for the population, integrating over variability in consumption. Using a second dimension of integration (second-order Monte-Carlo) we consider uncertainty in the input model parameters. In order to provide a way to better visualise the results of the study and to test the impact of some of the assumptions on the results, we developed an interactive visualisation tool using the Shiny version 1.3.2 (RStudio Citation2017). To facilitate model use this is available at https://fda-riskmodels.foodrisk.org/DRDADemoApp/. The R code is available upon request to [email protected].
Results and discussion
Infant cereal case study: cancer illnesses and associated DALYs for the total U.S. population
Contamination data on iAs and aflatoxins in white rice and oat infant cereals indicates aflatoxins are present at a higher level in oat as compared to white rice infant cereal and the level of iAs is higher in white rice than in oat infant cereal ( and ). We acknowledge the limited number of samples available for iAs in oat infant cereal. However, the average iAs level found in infant oat cereal (11.1 ng/g) and standard deviation (3.7 ng/g) using the Fong Sam (Citation2018) data is very similar to the average level published in FDA’s Toxic Elements in Foods and Foodware Monitoring Program in 2016 (US Citation2016a) of 9.7 ng/g (4.7 ng/g standard deviation) (15 samples) in infant oatmeal cereal.
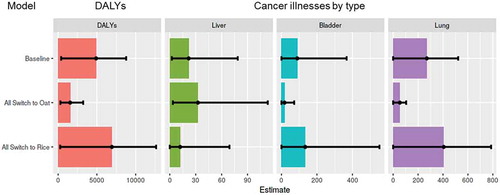
The prevalence and levels of iAs and aflatoxins in infant white rice and oat cereal available to consumers in the U.S. were combined with U.S. consumption data for infants under 12 months of age to estimate the baseline (including uncertainty) number of lung, bladder and liver cancer illnesses and associated DALYs as a result of exposure to these infant cereals during that year ( and ). These estimated baseline cancer illnesses and DALYs represent additional cancer illnesses per year of exposure from consumption of infant white rice and oat cereal under the assumption of linear dose-response for both contaminants. Estimated baseline number of cancer illnesses per year and DALYs are driven by the presence and health effect of iAs in white rice and oat cereals with 70% of total cancer illnesses estimated to be lung (attributed to iAs), 23% bladder (attributed to iAs) and 6% liver (attributed to aflatoxins) ( and ). Uncertainty in the estimates includes uncertainty in the contamination data (), in the bioavailability factors and in the dose-response models (). The overall estimated uncertainty is driven by the uncertainty in the dose-response models, particularly the iAs dose-response model, with the risk of liver cancer ranging from 2 illnesses to 88 illnesses per year, and in bladder cancer ranges from no illnesses to 376 illnesses and up to 531 illnesses for lung cancer estimates (). The uncertainty in the dose-response for iAs arises from uncertainty in the dose estimates used to quantify the relationship as well as the individual dose-response models (functional form) used to estimate disease frequency at low doses (FDA Citation2016b).
Table 2. Median number of cancer illnesses per year and DALYs for the total U.S. population and 90% uncertainty CI
Figure 4. Median estimated and predicted number of DALYs and cancer illnesses (by type) per year for the total U.S. population as a result of consumption of infant rice and oat cereal during the first year of age. Error bars represent 90% confidence interval of uncertainty. Liver cancer is estimated from aflatoxin contamination and bladder and lung cancer are estimated from inorganic arsenic contamination. The “Baseline” represents current consumption patterns of infant rice and oat cereal. “All switch to oat” assumes a total shift in consumption from infant white rice cereal to infant oat cereal (all infant white rice cereal servings become oat cereal servings) and “All switch to rice” assumes a total shift in consumption from oat cereal to infant white rice cereal (all infant oat cereal servings become white rice cereal servings)
Using FDA’s Toxic Elements in Foods and Foodware Monitoring Program posted in 2016 (FDA Citation2016a), results in predicted additional cancer illnesses that are nominally higher for bladder cancer (median 95 (90%CI 0, 395)) and lung cancer (median 284 (90%CI 0, 550)) and the same for liver cancer (median 21 (90%CI 2, 75)) when compared to our baseline analysis which uses 2018–2019 monitoring data (). The reason for this slight increase in bladder and lung cancer illnesses and equal liver cancer illness predictions when incorporating the data from FDA (Citation2016a) is because iAs concentrations in infant rice cereal in that dataset are slightly higher compared to the 2018–2019 dataset and we are using the same aflatoxin contamination dataset from Al-Taher et al. (Citation2017) and Zhang et al. (Citation2018).
The authors are not aware of published risk assessments on aflatoxins in infant cereal in the US. The European Food Safety Authority published a risk assessment of aflatoxin in foods with cancer risk being reported by population group and not by food (Schrenk et al. Citation2020). We can compare results from this study with those in the FDA risk assessment on iAs in infant white rice cereals for the U.S. population FDA US (Citation2016b). Briefly, average concentrations of iAS in infant white rice cereal used in the risk assessment were 103.9 ng/g taken from FDA surveys (FDA Citation2013, Citation2016a) and Consumer Reports surveys (Consumer Reports Citation2012). The model adjusted for the bioavailability of arsenic equally as we have in our model. Consumption data were estimated using the NHANES/WWEIA 2003–2010 cycles. The model predicted a lifetime cancer risk (bladder and lung) attributable to inorganic arsenic in white rice infant cereal (using per capita consumption and by exposure period (<1 year)) to be 2.3 cancer cases per million (90% CI 0 to 4.6 cases). Results showed that eliminating rice and rice products from the diets of infants and of children up to 6 years old could reduce the lifetime cancer risk from inorganic arsenic in rice and rice products by 6% and 23%, respectively.
Using the present framework and more recent estimates for contamination and consumption, we estimate a mean of 0.24 cases of bladder cancer (90% CI 0 to 1) and 0.72 cases of lung cancer (90% CI 0 to 1.39) attributable to infant white rice cereal during the first year of age. The current framework and the FDA (Citation2016b) models use the same dose-response relationship. These lower estimates using our framework result in part from the reduced mean iAs concentration in white rice infant cereal, from a mean of 103.9 ng/g in the data used for the 2016 risk assessment to a 82.3 ng/g mean in our study. Additionally, the consumption of infant white cereal decreased overall from an average ~12.5 g/day in 2003/04 to an average ~7.5 g/day in the 2015/16 as shown by the NHANES WWEIA survey data. This decrease was not fully captured in the FDA (Citation2016b) risk assessment as the data was only available up to 2009/10 and in that survey year the consumption of white rice cereal was on average ~10 g/day. The lung and bladder cancer estimates attributed to iAs in infant white rice cereal when using our framework align with those found in the FDA (Citation2016b) iAs in rice and rice products risk assessment considering the decrease in both iAs contamination levels and infant cereal consumption since its publication.
Infant cereal case study: cancer illnesses per year and associated DALYs when shifting consumption
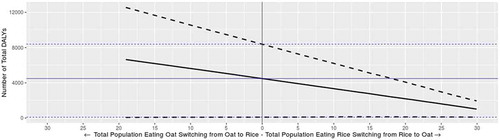
We used our model/framework to predict cases and DALY values if consumption patterns changed. Specifically, we modelled scenarios where consumption of infant oat cereal was switched to infant white rice cereal (all infant oat cereal servings become white rice cereal servings) and consumption of infant white rice cereal was switched to infant oat cereal (all infant white rice cereal servings become oat cereal servings). Results of these scenarios are presented in and . Mean liver cancer illness predictions decrease by 45% when the entire population of oat consumers switch to white rice and increase by 49% when the entire infant population of white rice consumers switch to oat. Mean bladder and lung cancer illness predictions increase by 50% each when all the infant population of oat consumers switches to white rice and decrease by 80% each when all the infant population of white rice consumers switches to oat. The predicted increase of bladder and lung illnesses and decrease in number of liver cancer illness when switching from oat to white rice are the result of aflatoxins being present at a higher level in oat than in white rice and iAs being present at a higher level in white rice than in oat (). Overall, predicted mean total cancer illnesses and DALYs increase by 41% and 45%, respectively, when switching all oat servings to white rice and decrease by 68% and 71%, respectively, when switching all white rice servings to oat. We also modelled intermediate scenarios, in which a fraction of the servings consumed are switched. The impact of the consumption shift on total cancer illnesses by percent shift in consumption is presented in , where a visible trend is seen of decreasing cancer illness predictions when switching from white rice to oat at any percent level. The maximum percent of consumers (total percent of consumers of oat or white rice) that can shift from oat to white rice is 19% and the maximum percent of consumers that can shift from white rice to oat is 29.9%. Infants who consume neither oat nor rice account for 57.7% of the total infant population. Of those who consume, 6.6% of infants consume both oat and rice, 12.4% consume only oat and 23.4% consume only rice.
Figure 5. Predicted total cancer illnesses as percent shift in consumption from oat to white rice (left) and from white rice to oat (right). Straight blue line represents the median estimated baseline value (including the lower and upper 90% confidence interval of the baseline in the blue dotted lines) and the straight black line represents the median predicted value as a result of the shift (including the lower and upper 90% confidence interval of the prediction in the black dotted lines)
The FDA (Citation2016b) iAs in rice and rice products risk assessment simulated the impact on risk of changing the frequency of consumption and amounts consumed per eating occasion in the U.S. It was assumed that for infants, an individual would consume rice or rice products once per day, 7 days/week, for a period of 12 months (FDA Citation2016b). Reducing the number of servings for infants by 50% decreased the predicted total lifetime cancer risks by 50% and increasing the frequency by 50% also increased the risk linearly (FDA Citation2016b). With our framework we are better able to characterise the change in overall cancer risk associated with such dietary shifts because we include in our evaluation the additional risks associated with shifting consumption to the most likely alternative substitution food (i.e., assuming infants eat the same total number of cereal servings) while taking into account additional potential hazards (e.g., aflatoxins). Similar to the FDA (Citation2016b) risk assessment, this more comprehensive analysis shows a reduction in cancer risk with decreasing consumption of infant white rice cereal during the first year of life.
Infant cereal case study: cancer illnesses per year and associated DALYs as a function of iAs in white rice concentration
Predicted risk of illness from cancer and DALYs as a function only of changes in iAs concentration in infant white rice cereal concentration (from 0 to 120 ng/g) show a linear decrease or increase in cancer illnesses and DALYs with decreasing or increasing concentration of iAs in white rice cereal, respectively ().
Figure 6. Predicted number of total DALYs as a function of iAs concentration in infant white rice cereal. Where the straight blue line is the median baseline value (including the lower and upper 90% confidence interval of the baseline in the blue dotted lines) and the straight black line is the median predicted value as a result of the change in concentration (including the lower and upper 90% confidence interval of the prediction in the black dotted lines)
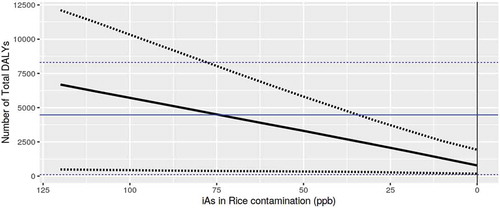
Our framework estimates cancer illnesses attributed to iAs to be ~390 cancer illnesses assuming the baseline iAs concentration (mean of 82.31 ng/g observed with a 90% CI 79.01, 85.67). If the concentration of iAs in infant white rice cereal increases to 100 ng/g (assuming the rest of the input parameters including the distribution of concentration values remain as in the baseline model), mean risk predictions increase by 36% to 473 illnesses (90% CI 25, 925). If the concentration of iAs in infant white rice cereal decreases to 10 ng/g (assuming the rest of the input parameters remain as in the baseline model), mean risk predictions decrease by 75% to a predicted 96 total cancer illnesses (90% CI 20, 182). An iAs concentration in infant white rice cereal of 10 ng/g results in total cancer illness predictions (including liver) and associated DALYs that are similar for infant oat and white rice cereal with no significant change in DALYs if the total population eating oat switches from oat to white rice or if the total population eating white rice switches from white rice to oat.
The FDA (Citation2016b) iAs in rice and rice products risk assessment predicted the percent reduction in cancer risk (cases) that could arise from mandatory or voluntary limits on the levels of iAs in infant white rice cereal including limits of 50, 75 and 100 ng/g for infant white rice and reported a decrease of 79.4%, 41.3% and 18.8%, respectively. Similar to the results found in the FDA (Citation2016b), our model shows a significant decrease in risk (estimated cancer illnesses) when reducing mean levels of iAs in infant white rice cereal. The mean iAs in white rice infant cereal concentration since the FDA (Citation2016b) publication has decreased by 21%. Our framework predicts that when this mean level is reduced even further to a mean of 70 or 50 ng/g, the number of estimated cancer illnesses from infant white rice cereal decreases by 11% or 32%, respectively. A mean of 10 ng/g would result in similar percent cancer illness reductions as the reduction provided in the FDA (Citation2016b) iAs in rice and rice products risk assessment when the mandatory or voluntary limit for iAs in all infant white rice cereal was set to 50 ng/g.
Estimated cancer illnesses per year and DALYs from consumption of infant white rice and oat cereal during the first year of age are driven by iAs when compared to aflatoxins and particularly its presence in white rice infant cereal, as the concentration in white rice is on average 7.4 fold higher than that found in oat infant cereal.
Limitations of the study
The results of this case study are limited to cancer associated with iAs and aflatoxins in boxed white rice and oat infant cereals available and consumed in the United States. The model did not consider beneficial effects of eating rice and/or oat nor other genetic or dietary factors which might influence cancer risk at the individual or the population level. Uncertainty in the risk estimates and predictions presented includes uncertainty in the contamination data, the bioavailability factor and the dose-response relationships. Uncertainty in the dose-response relationships is the largest contributing factor to this model output uncertainty. As new data become available on contamination levels (i.e. prevalence and levels) of iAs and aflatoxins in infant white rice and oat cereal, dose-response relationships are better characterised, new cereal consumption trends for infants in the United States are published, and bioavailability of iAs and aflatoxin in rice and oat are further established, the model can be updated. In addition, when dose-response relationships become available for other non-cancer adverse health outcomes, including neurodevelopmental effects and effects on cardiovascular health, these can also be included.
Conclusion
This study presents the first risk-risk analysis and quantitative assessment of risk associated with exposure to iAs and aflatoxins from consuming infant white rice and oat cereals during the first year of age. We illustrate how modelling can be used to quantitively assess the potential impact of consumption shifts from one food to an alternative substitution food on public health outcomes. Our case study results provide new insights into the public health impact of FDA recommendations to vary grain intake for infants who might otherwise consume only white rice cereal.
The framework and tool are designed to provide decision-makers with a nuanced understanding of the impact of consumption shifts on public health and can reveal parameters that drive predicted changes in public health to support or disqualify advice or recommendations. The mathematical and analytical approaches used in this study can be applied to a wide range of food safety and nutrition questions. The visualisation modelling tool facilitates real-time exploration of the impacts of dietary changes on risk and allows direct query by decision-makers.
Acknowledgments
The authors acknowledge and thank our CFSAN colleagues for sharing data and fruitful discussions. This work was carried out under official FDA duties and contract (HHFS223201710033I with Goldbelt C6, LLC (RP)).
References
- Al-Taher F, Cappozzo J, Zweigenbaum J, Lee HJ, Jackson L, Ryu D. 2017. Detection and quantitation of mycotoxins in infant cereals in the US market by LC-MS/MS using a stable isotope dilution assay. Food Control. 72:27–35. doi:10.1016/j.foodcont.2016.07.027.
- [CAC] Codex Alimentarius Comission. 2003. Report of the twenty-sixth session. Working Principles for Risk Analysis for Application in the Framework of the Codex Alimentarius Joint FAO/WHO Food Standards Programme.
- [CDC] Centers for Disease Control and Prevention. 2016. National Center for Health Statistics (NCHS). National Health and Nutrition Examination Survey Data. Hyattsville (MD): U.S. Department of Health and Human Services, Centers for Disease Control and Prevention. [accessed 2015 Jul]. http://www.cdc.gov/nchs/nhanes.htm.
- Chen CL, Chiou HY, Hsu LI, Hsueh YM, Wu MM, Chen CJ. 2010a. Ingested arsenic, characteristics of well water consumption and risk of different histological types of lung cancer in northeastern Taiwan. Environ Res. 110(5):455–462. doi:10.1016/j.envres.2009.08.010.
- Chen CL, Chiou HY, Hsu LI, Hsueh YM, Wu MM, Wang YH, Chen CJ. 2010b. Arsenic in drinking water and risk of urinary tract cancer: a follow-up study from northeastern Taiwan. Cancer Epidemiol Biomarkers Prev. 19(1):101–110. doi:10.1158/1055-9965.EPI-09-0333.
- Consumer Reports. 2012. Arsenic in your food. http://www.consumerreports.org/cro/magazine/2012/11/arsenic-in-your-food/index.htm.
- Delignette-Muller ML, Dutang C. 2015. fitdistrplus: an R package for fitting distributions. J Stat Softw. 64(4). doi:10.18637/jss.v064.i04.
- Fong Sam J 2018. Toxic elements in breakfast cereal products. Presented at the Winter Conference on Plasma Spectrochemistry, Amelia Island, Florida, January 8-13.
- [FDA/CFSAN] Food and Drug Administration Center for Food Safety and Applied Nutrition, [(JIFSAN)] Joint Institute for Food Safety and Applied Nutrition, and [RSI] Risk Sciences International. 2017. FDA-iRISK® version 4.0. College Park (Maryland). [accessed 2019 Dec]. https://irisk.foodrisk.org/.
- [IARC] International Agency for Research on Cancer. 2012. IARC monographs on the evaluation of carcinogenic risks to humans. Volume 100F. Chemical agents and related occupations. Aflatoxins. In: Cancer. FIAfRo, editor. Lyon, France.
- [JECFA] Joint FAO/WHO Expert Committee on Food Additives. 2018. Safety evaluation of certain contaminants in food. Geneva, Switzerland: World Health Organization.
- [JECFA] Joint FAO/WHO Expert Committee on Food Additives. 1998. Safety evaluation of certain food additives and contaminants. Aflatoxins.
- [JECFA] Joint FAO/WHO Expert Committee on Food Additives. 2011. Safety evaluation of certain food additives and contaminants.
- [JECFA] Joint FAO/WHO Expert Committee on Food Additives. 2018. Safety evaluation of certain contaminants in food: prepared by the eighty-third meeting of the joint FAO/WHO Expert Committee on Food Additives (JECFA). Geneva, Switzerland: WHO Food Additives Series, No. 74; FAO JECFA Monographs 19 bis.
- Jubert C, Mata J, Bench G, Dashwood R, Pereira C, Tracewell W, Turteltaub K, Williams D, Bailey G. 2009. Effects of chlorophyll and chlorophyllin on low-dose aflatoxin B1 pharmacokinetics in human volunteers. Cancer Prev. Res. 2(12): 1015–1022.
- Khlangwiset P, Shephard GS, Wu F. 2011. Aflatoxins and growth impairment: a review. Crit Rev Toxicol. 41(9):740–755. eng. doi:10.3109/10408444.2011.575766.
- Pires SM, Boue G, Boobis A, Eneroth H, Hoekstra J, Membre JM, Persson IM, Poulsen M, Ruzante J, van Klaveren J, et al. 2019. Risk benefit assessment of foods: key findings from an international workshop. Food Re Int. 116:859–869. doi:10.1016/j.foodres.2018.09.021.
- R Core Team. 2017. R: a language and environment for statistical computing. Vienna (Austria): R Foundation for Statistical Computing.
- RStudio I 2017. Shiny from RStudio. https://shiny.rstudio.com/
- Schrenk D, Bignami M, Bodin L, Chipman JK, Del Mazo J, Grasl-Kraupp B, Hogstrand C, Hoogenboom L, Leblanc J-C, Nebbia CS, et al. 2020. Risk assessment of aflatoxins in food. Efsa J. 18(3):e06040.
- The World Bank Group. 2015. Life expectancy at birth, total (years)- United States. accessed 2019 Oct 16. https://data.worldbank.org/indicator/SP.DYN.LE00.IN?locations=US&most_recent_value_desc=true.
- Thomsen ST, de Boer W, Pires SM, Devleesschauwer B, Fagt S, Andersen R, Poulsen M, van der Voet H. 2019. A probabilistic approach for risk-benefit assessment of food substitutions: a case study on substituting meat by fish. Food Chem Toxicol. 126:79–96. doi:10.1016/j.fct.2019.02.018.
- [US FDA] United States Food and Drug Administration. 2002. Initiation and conduct of all “major” risk assessments within a risk analysis framework. [accessed 2020 Mar]. https://www.fda.gov/food/cfsan-risk-safety-assessments/initiation-and-conduct-all-major-risk-assessments-within-risk-analysis-framework.
- [US FDA] United States Food and Drug Administration. 2012. Elemental analysis manual 4.11 arsenic speciation in rice and rice products using high performance liquid chromatography-inductively coupled plasma-mass spectrometric determination. [accessed 2020 Mar]. https://www.fda.gov/media/95197/download.
- [US FDA] United States Food and Drug Administration. 2013. Analytical results from inorganic arsenic in rice and rice products sampling. [Posted 2013 Sep accessed 2020 Mar].
- [US FDA] United States Food and Drug Administration. 2015. Elemental analysis manual inductively coupled plasma-mass spectrometric determination of arsenic, cadmium, chromium, lead, mercury, and other elements in food using microwave assisted digestionversion. [accessed 2020 Mar]. https://www.fda.gov/media/87509/download.
- [US FDA] United States Food and Drug Administration. 2016a. Arsenic in food and dietary supplements. FDA monitoring and testing of arsenic in food, including dietary supplements. Arsenic in rice and rice products sampling results. Analytical results from inorganic arsenic in rice cereals for infants, non-rice infant cereal and other foods commonly eaten by infants and toddlers. [Posted 2016 Apr accessed 2020 Mar]. https://www.fda.gov/food/metals/arsenic-food-and-dietary-supplements.
- [US FDA] United States Food and Drug Administration. 2016b. Arsenic in rice and rice products risk assessment report. [accessed 2020 Mar]. http://www.fda.gov/Food/FoodScienceResearch/RiskSafetyAssessment/default.htm.
- [US FDA] United States Food and Drug Administration. 2016c. FDA proposes limit for inorganic arsenic in infant rice cereal. [accessed 2020 Mar]. https://www.fda.gov/news-events/press-announcements/fda-proposes-limit-inorganic-arsenic-infant-rice-cereal.
- [US FDA] United States Food and Drug Administration. 2016d. Supporting document for action level for arsenic in rice cereals for infants. [accessed 2020 Mar]. https://www.fda.gov/food/chemical-metals-natural-toxins-pesticides-guidance-documents-regulations/supporting-document-draft-guidance-industry-inorganic-arsenic-rice-cereals-infants-action-level.
- [US FDA] United States Food and Drug Administration. 2020b. Inorganic arsenic in rice cereals for infants: action level guidance for industry. [accessed 2020 Mar]. https://www.fda.gov/media/97234/download.
- Zhang K, Flannery BM, Oles CJ, Adeuya A. 2018. Mycotoxins in infant/toddler foods and breakfast cereals in the US retail market. Food Addit Contam Part B. 11(3):183–190. doi:10.1080/19393210.2018.1451397.