
ABSTRACT
The transfer rate of 37 pyrrolizidine alkaloids (PA) found in ten naturally contaminated teas and herbal teas to their brews was studied in detail. Mixed herbal, peppermint, red bush, senna, black tea and green tea infusions were prepared according to the ISO guide and vendor’s instructions, respectively, and parameters like herb-to-water ratio, steeping time and multiple extractions studied. In general, a transfer rate of 38–100% (median 95%) for brews following vendor’s instructions was determined. The total concentration range of PA in these ten samples was 154–2412 ng/g (median 422 ng/g) in the herb and for single analytes 0.1–170 ng/g. Seven of the 37 PA occurred unexpectedly; these were tentatively identified and quantified by liquid chromatography-high resolution mass spectrometry (LC-HR-MS), since their contributions to total PA-content matter. Additionally, 46 iced tea beverages were analysed for their PA-load, determined to be in the range 0–631 ng/L (median 40 ng/L). The applied solid-phase extraction (SPE) clean-up turned out to be capable of separating PA in the free base pyrrolizidine alkaloids (PAFB) and their N-oxides (PANO) in a two-step elution, which was a valuable tool to support identification of unexpected PA. Further, atropine was found in 50% of the ten tea herb samples (range: 1–4 ng/g) and in 13% of the iced tea beverage samples (range: 2–65 ng/L).
Introduction
After (packaged) water, tea is the most consumed beverage worldwide. Annual tea consumption for 2021 is estimated to be 297 billion litres, that is, a per capita consumption of 37 litres per year (Bolton Citation2018). Tea is an important economic factor and its quality depends, among others, on harvest conditions and good agricultural practice (Codex Citation2014). It is in this context that PA were found unexpectedly in tea and herbal tea (BfR Citation2013), due to contamination with PA-containing weeds. A very wide variety of weeds are able to contaminate tea and herbal tea with PA. Several hundred 1,2-unsaturated PA are known and are produced mainly by plant species belonging to the families Asteraceae (tribes Senecioneae and Eupatorieae), Fabaceae (genus Crotalaria) and Boraginaceae (most genera) (Hartmann and Witte Citation1995; EFSA Citation2011). Since several PA are regarded as both hepatotoxic and carcinogenic, but the tea plants are not producing the contaminants, this health-related issue was addressed with numerous analytical and regulatory efforts.
The European Food Safety Authority (EFSA) concluded in its 2011 evaluation (EFSA Citation2011) that 1,2-unsaturated PA may act as genotoxic carcinogens in humans, based on the knowledge of metabolism, activation, DNA formation, genotoxicity, and carcinogenicity. In the same document, EFSA assessed the risk for genotoxic carcinogenicity and adjusted the reference point for the margin of exposure (MOE) approach in 2017 (EFSA Citation2017). The EFSA selected the benchmark dose lower confidence limit of 237 µg/kg body weight per day, calculated for a 10% increase in the incidence of liver haemangiosarcoma in female rats exposed to riddelliine as the new reference point for the chronic risk assessment of PA. Applying an MOE of 10,000 leads to an intake that would be of low concern from a public health point of view, that is, an adult of 70 kg should not consume more than 1.6 µg PA per day. The EFSA also concluded in its dietary exposure assessment that tea and herbal infusions were by far the main average contributors to the total exposure to PA (EFSA Citation2016). In response to this issue, the EU Commission published maximum levels for tea and herbal infusions in December 2020 (EU Citation2020). The levels range from 1.0 µg/kg for certain products in liquid form for infants and young children to 400 µg/kg for certain dried herbs for herbal infusions. The levels refer to the sum of a defined list of 35 PA (PAFB and PANO). The regulation also sets maximum levels for all other dried herbs and for some specific fresh or frozen herbs. Additionally, maximum levels for certain food supplements were set. However, the regulation will not come into force until 1 July 2022 and products lawfully placed on the market before this date may remain on the market until 31 December 2023.
To gain toxicological relevant exposure data, an important parameter is the transfer rate of PA from tea and herbal tea to the brew. Sparse and even contradictory data are available at present only. Lüthy et al. (Citation1980) published a transfer rate of 80% for senkirkine from coltsfoot, Engeli (Citation2014) 84–103% for nine PA from peppermint herbs, Mulder et al. (Citation2018) about 85% for 25 PA from 38 samples and on the other hand 16–28% for 30 PA from 12 green, 16 black and 29 herbal or red bush samples (Picron et al. Citation2018).
In this study, we aimed to clarify the transfer rates of PA under various conditions, estimate the exposure due to iced tea beverage consumption and trace the PA-content of selected commercial herbal tea and iced tea beverage samples from 2013 to 2020.
Material and methods
Chemicals and reagents
Methanol was from Honeywell (LC-MS grade, Grogg AG, Stettlen, Switzerland). Sulphuric acid, formic acid and aqueous ammonia solution 25%, all of analytical grade, were from Merck (Grogg AG, Stettlen, Switzerland). Ultrapure water was used (Elga Purelab ultra, Labtec, Villmergen, Switzerland). Echimidine (EM), erucifoline N-oxide (EFO), europine (EU), europine N-oxide (EUO), intermedine (IM), intermedine N-oxide (IMO), jacobine (JB), jacobine N-oxide (JBO), lasiocarpine (LC), lycopsamine (LY), lycopsamine N-oxide (LYO), monocrotaline (MC), senecionine (SC), senecionine N-oxide (SCO), senkirkine (SK), senecivernine (SV), senecivernine N-oxide (SVO) and trichodesmine (TD) were from Phytolab (Vestenbergsgreuth, Germany). Jacoline (JL), retrorsine (RT) and seneciphylline (SP) were from Cfm O.Tropitzsch (Marktredwitz, Germany). Heliosupine (HS) and rinderine (RN) were from Phytoplan (Heidelberg, Germany). Echivulgarine (EV) was isolated in-house (Lucchetti et al. Citation2018) and echimidine N-oxide (EMO), heliotrine N-oxide (HTO), monocrotaline N-oxide (MCO), lasiocarpine N-oxide (LCO), retrorsine N-oxide (RTO) and seneciphylline N-oxide (SPO) were N-oxidised in-house starting from the free bases according to Cymerman Craig and Purushothaman (Citation1970), except that dichloromethane instead of trichloromethane was used. Atropine (ATR) and the internal standard homatropine (HTR) were from TCI (Eschborn, Germany) and D3-atropine (D3-ATR) was from CDN isotopes (Quebec, Canada).
For each analyte, except for ATR, EFO, EMO, HT, HTO, JL, LCO and RN which were available for qualitative purposes only, a stock solution in methanol (c = 100 µg/mL) was prepared and stored at −20°C. For pre-extraction spiking purposes, a multi-analyte standard was freshly prepared in methanol (c = 1 µg/mL), which was further diluted to 0.1 and 0.01 µg/mL with methanol for post-extraction fortification experiments, that is, matrix calibration.
Tea, herbal tea and iced tea beverage samples
All samples for infusion preparation and the iced tea beverages were from the Swiss market, procured during 2013 to 2020 and comprised eight teas and herbal teas for infusion preparation and 16 herbal teas, to study PA-content over the years, all in tea bags; 46 iced tea beverages, six blank teas and herbal teas, all from loose tea; and three blank iced tea beverages. Two validated reference materials from ring trials, red bush (P1706-RMRo Citation2017) and peppermint herb (Uhlig et al. Citation2019), were additionally treated as samples to verify accuracy during method procedures.
Herbs were combined to an aggregate of 30 to 50 g, each, and stored at room temperature.
Infusion preparation and extraction of PA
Samples were analysed in duplicate and herbs ground to a fine powder (particle size 250–500 µm) by an IKA A11 mill (IKA, Staufen, Germany).
Three extraction procedures were applied for infusion preparation. To determine the total PA-content, samples were extracted with 0.05 M aqueous sulphuric acid at room temperature. This procedure consisted of three consecutive extractions to make sure of complete removal of PA. To study their transfer to the brew, three consecutive extractions according to the ISO 3103 protocol (ISO Citation1980) were applied, then in a fourth extraction possible remaining compounds removed with 0.05 M aqueous sulphuric acid to ensure full PA-extraction. Further, infusion preparation according to vendor’s instructions was conducted, terminated again by a final extraction with 0.05 M aqueous sulphuric acid. gives an overview on all applied extraction procedures and conditions.
Table 1. Overview on all applied extraction techniques and conditions for tea herbs. Additionally, capped vessels were shaken horizontally at 250 rpm
The ISO-procedure was adapted to the use of 25 mL centrifuge filter tubes (Nylon, pore size 0.22 µm, Thermo Scientific, Reinach, Switzerland) to allow for multiple extractions. An aliquot of 0.4 g homogenised sample was transferred to the membrane-containing filter unit and D3-ATR added as quality standard (c = 200 ng/g). Then, 20 mL of boiling water were poured into the graduated filtration inlay. After capping and 6 min of steeping time under horizontal shaking at 250 rpm, the sample was centrifuged at 2200 g for 15 min and the filtrate collected. The extraction procedure was repeated two more times, each with 20 mL of boiling water. Finally, the filtration residue was extracted with 20 mL 0.05 M aqueous sulphuric acid for 15 min at room temperature under shaking, then centrifuged and the resulting four filtrates cleaned up by SPE separately.
For tea and herbal tea preparation according to vendor’s instructions, the same procedure applied, but with adapted herb-to-water ratios (HWR = 1:100 to 1:143) and variations in the number of extraction steps (2–3), water temperatures (80°C or boiling) and whether the centrifuge tube was capped during steeping time or not.
Prior to SPE, analytes containing solutions were adjusted to pH≈2 under dropwise addition of concentrated sulphuric acid where necessary and syringe-filtered (≤1 µm) in case of precipitate formation. The cleanup was achieved by automated extraction on an Aspec GX-274 robot (Gilson, Mettmenstetten, Switzerland). Aliquots of 17 mL of sample solution from herbs and brews or 300 mL of iced tea beverages were passed through a SPE PCX cartridge (Bond Elut Plexa, Agilent, MSP Kofel, Zollikofen, Switzerland), previously conditioned with 5 mL methanol and 5 mL water. The loaded column was washed consecutively with 5 mL water and 5 mL methanol. The analytes were eluted by 8.5 mL ammonia solution in methanol (1.5%, v/v), the solvent evaporated to dryness under nitrogen at 40°C and the residue dissolved in methanol/water/formic acid (5:95:0.1%, v/v/v) to result in a matrix strength of 0.5 g/mL for herbs and their brews, and 500 mL/mL for iced tea beverages.
For selective PANO vs PAFB elution, the acidic solution containing the analytes was adjusted to 5<pH<7 through dropwise addition of aqueous ammonia solution (25%) prior to SPE. The clean-up was the same as described above, but 8.5 mL pure methanol as first eluent were used, leaching out the PANO solely. Subsequently, the SPE-cartridge was eluted a second time, by 8.5 mL ammonia solution in methanol (1.5%, v/v), releasing the residual PANO and the PAFB (and SK).
Identification and quantification by LC-HR-MS
The chromatographic system consisted of a Shimadzu Prominence binary gradient system (Shimadzu, Reinach, Switzerland), degasser, autosampler, static mixer and column oven. Chromatographic separations were performed on a Kromasil C18 (125 × 2 mm, 3.5 µm particle size) analytical column (Macherey-Nagel, Buchs, Switzerland). The flow rate was 0.2 mL/min, column temperature was maintained at 30°C and injection volume was 5 µL. A gradient programme was used. The solvents were water and methanol, both containing 0.1% formic acid (v/v). The programme was 5% methanol at 0 min, then ramped linearly from 0 to 10 min to 23% methanol, then from 10 to 22 min to 37% methanol and 22–23 min to 95% methanol, held for 3 min at this condition, then the column re-equilibrated for 9 min at 5% methanol.
Mass spectrometric detection was achieved by a Bruker maXis 4G+ Qq-TOF mass spectrometer (Bruker, Bremen, Germany), equipped with an electrospray ionisation interface operated in positive ion mode. Source parameters were plate offset 500 V, capillary voltage 4.5 kV, dry temperature 200°C, nebuliser gas pressure 150 kPa and nitrogen dry gas flow rate 8 L/min. Typical resolution at m/z = 350 was 35,000, with an allowed deviation for determinations of ≤2 mDa. Collision induced dissociation (CID) fragment spectra of mass selected ions were generated by nitrogen as collision gas at 35 eV ion energy. Instrument calibration was achieved by incorporating sodium formate solution at the beginning of every run by a loop injection. For instrument control, data acquisition and processing, Compass 1.7 and TargetAnalysis 1.3 were used.
Identification of compounds was accomplished by comparing retention time (< ±2.5%), high mass resolved molecular ion (≤ ±2mDa) and three fragment ions (≤ ±2mDa) to standard substances or literature. The selective PANO vs PAFB elution served as additional identification verification.
For quantification, a matrix-matched methodology applied. Blank samples of teas and herbal teas (n = 6), infusions from these, prepared according to the ISO guideline and blank iced tea beverages (n = 3) were extracted as described above, but the dried residue from SPE-clean-up was dissolved in methanol and portioned in vials for the seven calibrate levels applied, each. Standard mix containing 24 PA and D3-ATR was added for a final concentration range of 0, 5, 20, 250, 500, 750 and 1000 ng/g for tea, herbal tea and their brew, and 0, 0.0125, 0.050, 0.625, 1.25, 1.875 and 2.5 ng/mL for iced tea beverages. Additionally, HTR was added as internal quality standard (c = 200 ng/g and 0.5 ng/mL, respectively). Subsequently, the vial contents were evaporated to dryness and reconstituted in LC eluent, in order to achieve final matrix strength of 0.5 g/mL for tea, herbal tea and their brew or 500 mL/mL for iced tea beverages. The protonated molecular ion MH+ was used as quantifier, while three specific fragment ions from CID were surveyed as qualifiers. For PA without identical analyte calibration curve, the most similar one was taken ().
Table 2. List of analysed substances. A capitalised O in the name of PA depicts its N-oxide and putative trivial names are given in brackets. The retention time (rt) of the analyte is given, identification is based on reference substance (ref) or literature (1 = (Boppré et al. Citation2005), 2 = (Kaltner et al. Citation2019), 3 = (van de Schans et al. Citation2017), 4 = (Cheng et al. Citation2017), 5 = (Colegate et al. Citation2012)) and analytes were found in iced tea beverages (b) and/or tea herbs (h)
Statistical evaluations were performed using Systat V9 (SPSS Inc., Chicago, USA).
Method validation
Brewed sample preparations for validation purposes were made according to the ISO guide requirements (ISO Citation1980).
Method linearity was evaluated using matrix matched calibration curves for each sample type and analyte. Six blank tea and herbal tea samples and their brew were fortified at concentration levels of 0, 5, 20, 250, 500, 750 and 1000 ng/g with the multi-analyte standard. Three blank iced tea beverage samples were spiked at 0, 0.0125, 0.050, 0.625, 1.25, 1.875 and 2.5 ng/mL. For linear regression, the corresponding function was forced through the origin and the correlation coefficient used as quality indicator.
Recovery was calculated by fortifying blank samples at a concentration level of 200 ng/g (pre-extraction spike), applied to six teas, herbal teas and their brews and spiking 0.5 ng/mL to three blank iced tea beverages. For precision determination, intra- and inter-day variations were monitored at these concentration levels for blank samples of a green tea herb, its brew and an iced green tea beverage. A three- to five-fold replicate analysis was performed in-day, while for inter-day variability analyses were performed in duplicate over three consecutive days.
Matrix effect, that is, the ionisation effect on analytes, was evaluated by spiking blank sample extracts for above-mentioned samples (post-extraction spike). The matrix effect was then calculated by subtracting the ratio of the slope values of the matrix-matched calibration curve and the blank calibration curve to 1 and expressing it in relative percentage. Limits of detection (LOD) were estimated from the lowest spiking levels applied to blank matrix samples based on a signal-to-noise ratio of three. Similarly, limits of quantification were estimated at 1.5–3x LOD, depending on analyte and matrix.
The extraction efficiency was calculated from the ratio area of spiked sample (pre-extraction spike) vs area of spiked extract (post-extraction spike).
Accuracy and trueness of the quantitation method were investigated by processing two matrix reference materials from ring trials, that is, red bush (P1706-RMRo Citation2017) and peppermint herb (Uhlig et al. Citation2019) and comparing data by calculating the corresponding z-score of the analyte (see discussion below). It is calculated as difference between determined and referenced value, divided by the Horwitz target standard deviation, considering the modifications by Thomson (ISO Citation2015). An absolute z-score value of equal or less than two is regarded as acceptable, that is, determined and reference value under this condition are comparable.
Results and discussion
Method validation
Data concerning linearity, recovery, matrix effect and extraction efficiency are presented in Table S1 of the supplemental data collection. The chosen regression model fits our data well (Figure S1). The internal standard HTR was added to every matrix calibration series and vial (n = 18×7) and the determined calibration-series repeatability, expressed in terms of relative standard deviation (RSD), varied in a range of 7–10%.
Regarding linearity, 85–88% of the analytes had a correlation coefficient above 0.99, independent from extraction solvent used. For these, a linear relationship between analyte concentration and peak area in the range 0–1000 ng/g for tea, herbal tea and their brew and of 0–2.5 ng/mL for iced tea beverages is ensured. The coefficients of the remaining analytes were all above 0.96. The analytes EV, JB, JBO, MC and MCO were especially affected by these lower correlations, and all had elevated LOD.
As for the recovery results from blank matrix spiked samples, 48% of the analytes in tea and herbal tea (range 36–94%), 17% in brews (range 30–95%) and 68% in iced tea beverage samples (range 42–98%) were in the range 70–120%. The outlying analytes were hampered by low extraction efficiency and signal suppression effects.
Regarding the extraction efficiency, 82% of the analytes in tea and herbal tea, 54% in brews and 96% in iced tea beverage samples were in the range 70–120%. Low analyte transfer was observed for ISO-brews in general, compared to acidic extracted herbs and iced tea beverages. This is due to the different extraction solvents and acting times applied, that is, 15 min 0.05 M aqueous sulphuric acid for tea and herbal tea herbs, 6 min boiling water for brews or already solubilised analytes in acidified beverages. Especially SC and SPO in tea, herbal tea plus EM, EU, HS, IM, LY, RT, SC, SP and SV in brews showed low extraction efficiency. For brews, the less pH-susceptible PANO are obviously extracted more efficiently with 58–119% (median 84%) compared to the PAFB (and SK) with 43–93% (median 65%). On average, hot water extracted PA 20% less efficient than aqueous sulphuric acid at room temperature, deduced from the recoveries of 82 and 66% for acidic and hot water extraction of spiked blanks, respectively (Table S1).
As already stated, there is a significant negative matrix effect, i.e. ion signal suppression due to ionisation process and chemical property of the analytes. Notable matrix suppression was detected, independent from extraction solvent, for 37–43% of the analytes with values of −20% and less, that is, increasing matrix suppression; for 1–4% with even less than −50% matrix effect. Especially affected were EV, JB, JBO, MC and MCO.
To overcome and compensate the negative effects of extraction efficiency and matrix, matrix-matched calibration was applied for quantification.
The LOD values were in the range 0.1–2 (median 0.25) ng/g for tea herbs, 0.1–1.2 (median 0.3) ng/g in brews (based on the herb) and 0.3–5 (median 1.25) ng/L for iced tea beverages. In tea herbs, especially IM and JBO in black tea, EU in mixed herbal tea, EUO in peppermint and RTO, SCO, SPO, SVO in senna had elevated LOD (1–2 ng/g). In brews, the LOD of JBO in black tea, EU, EUO, JB and TD in mixed herbal tea, EUO in peppermint and SCO, SPO, SVO in senna were increased (1–1.2 ng/g) as were iced green tea beverage LOD for IM and LY (5 ng/L). Data on limit of detection and repeatability are presented in Table S2.
The intra- and inter-day precision expressed in terms of RSD was 3–14% and 5–17% for tea, herbal tea, 4–11% and 5–14% for brews and 4–11% and 4–14% for iced tea beverages, respectively, providing acceptable repeatability for all analytes.
The accuracy of this method was successfully demonstrated in a comparison with certified values of two validated reference materials. The derived z-scores for all comparable analytes (n = 11 in red bush, n = 12 in peppermint herb) were below two and were −1.44 to 0.59 for red bush and −1.40 to 1.30 for peppermint herb. For further details, see Table S3.
Analytical methodology
Within the limitations of the LC system, allowing for pressures only below 40 MPa, a long chromatographic run was chosen in order to separate as many isomers as possible. The retention time range for PA was from 6.3 (JL) to 26.5 min (EV), see .
For SPE, the sorbent types reversed-phase C18, SCX and PCX were tested. In accordance with Chen et al. (Citation2019), PCX was chosen for its simplicity in use and good retention and elution properties. Additionally, under normal operation no pH adjustments or vacuum drying are required. Eluates result in clear, yellow solutions and consequently ion source and instrument contaminations are moderate.
During PCX-SPE optimisation, it turned out that a selective elution of PAFB vs PANO was possible through a two-step procedure. Prior to SPE, the acidic extraction solution containing the analytes had to be adjusted to 5<pH<7 with aqueous ammonia solution (25%). In the first SPE-clean-up step following the procedure described in the infusion preparation section, pure methanol was applied as eluent. Under these conditions, only PANO were eluted, depending on their concentration and matrix between 27% and 100%. The SPE cartridge was subsequently eluted with ammonia solution in methanol (1.5%, v/v), leaching out the residual PANO (73 to 0%) and the PAFB (and SK) (100%). The pH-susceptible PAFB, including SK, eluted only under basic conditions. Table S4 shows the elution rate-dependence on the pH prior to SPE for a peppermint sample containing the five PA-pairs EV/EVO, RT/RTO, SC/SCO, SP/SPO, SV/SVO and SK. At pH<6, PA elute mainly in the second, basic, elution step, while at pH = 6 only PANO elute and at pH = 8 mainly all PA are eluted already in the first step. Table S5 demonstrates the elution selectivity for samples of black tea, green tea, mixed herbal tea, peppermint, red bush and senna. Note that depending on tea or herbal tea type, some of the PA are missing, due to low concentration, elevated LOD or chemical noise. The affected PA were EU, HTO, JBO, JL, JLO, RN and an unknown PANO (unknO, see below). For the analysed samples, 27–100% (median 82%) of PANO were eluted and separated in the first elution step, while 100% of PAFB and SK eluted in the second step.
Generally, chromatograms of cleaned-up extracts were dominated by phenylalanine, tryptophan, tyrosine (Zhang et al. Citation2019), adenosine, 3-carboxy-1,2,3,4-tetrahydro-beta-carboline (Strehmel et al. Citation2014) and deoxyguanosine (Lu et al. Citation2006), see Table S6. For these, ion intensities were a factor of 10 to 100 above those of PA.
Infusion preparation and transfer rate
Heat dissipation of vessel
To check the compatibility of the vessel to the requirements of the ISO-guide, its heat dissipation characteristic was studied. It turned out that it had similar isolation capacity as a ceramic mug or pot, which was investigated in parallel, having an outer and inner diameter of 9 and 7.5 cm, respectively, and 11 cm in height. The heat dissipation within 6 min for the centrifuge tube and the ceramic pot when capped were 22 and 23°C, respectively, with 26 and 31°C, respectively, when left open. Therefore, we consider the temperature profile requirement of the ISO-guide as fulfilled, even though we used a double-walled spin-filter polypropylene tube as brewing vessel.
Identification and quantification of PA
In the ten teas and herbal teas under investigation, 37 different PA were found (). Among these, seven unknowns were detected and characterised. All seven unknowns shared the three retronecine-characteristic low-mass CID product ion triads m/z = 93 to 95, 119 to 121 and 136 to 138, while a prominent m/z = 136 and the presence of a protonated dimer 2MH+ were additionally indicative for N-oxides. For comparison reasons, in Table S7 the unknown PA are listed together with their isomeric analogues EM, EMO, RTO, TD and TDO. Details on identification of unknowns are given in Table S8.
RTOiso was tentatively identified as stereoisomer of RTO, possibly usaramine N-oxide (Cheng et al. Citation2017). Both TD-isomers, TDiso1 & 2, did not match their structure isomers axillaridine (Wiedenfeld et al. Citation1985; Asres et al. Citation2004) or 12-desoxyaxillarine (Wiedenfeld et al. Citation1985), which according to our structure S1 would be 13-deoxyaxillarine. Owing to the clues from MS/MS-experiments and the close structural relationship to incanine (Tashkhodzhaev et al. Citation1979), we putatively named TDiso1 & 2 as 18-hydroxyincanine (structure S1). In Crotalaria species, a similar PAFB was found, pumiline A, which carries an epoxy functional group in position C-13, C-18 (Fletcher et al. Citation2011). In analogy, and since typical N-oxidised TDiso1 & 2-fragments were detected, TDOiso1 & 2 were named 18-hydroxyincanine N-oxide. The unknown (Unkn) and unknO due to their echimidine group-typical fragment ions and neutral losses were ascribed to an open-chain diester PAFB and PANO, respectively (Yoon et al. Citation2015). Additional neutral losses of m/z = 32 (CH4O, methanol), 46 (C2H6O) and 62 (C2H6O2 = C2H4O+H2O?) indicate the presence of a side-chain methoxy-group similar to LC and possibly an additional ethoxy or secondary alcohol group with a methyl substituent.
Regarding quantification, it is important to screen samples for unexpected PA, since they might make considerable contributions to total PA-content. Here, unexpected PA were characterised and quantified according to their structure type by the most similar PA for which matrix-matched calibration curves were available (). Of course, the derived values remain estimations. Still, equal approaches to quantify unexpected or unknown PA have been proposed by others (These et al. Citation2013; Rösemann et al. Citation2014; Mägde et al. Citation2020). Since samples have been finely ground for homogeneity purposes, their physical properties have been changed. This might lead to higher transfer rates over time compared to the unground materials. We judge this an acceptable compromise in view of the required reliability of acquired data.
Comparability of data
The summed-up value over all extraction steps for every analyte was compared among the three extraction techniques (aqueous sulphuric acid, brew according to ISO and vendor’s instructions) by analysis of variance. The Thomson-corrected Horwitz standard deviation (ISO Citation2015) of the PA-values was determined and test-statistic value (F) plus significance level (p) calculated for every data triple. In general and as shown in Table S9, values from the three extraction techniques do not significantly differ from each other (F(2,6)<5.14, p > 0.05). For those not complying (0.1%), a Bonferroni-corrected post-hoc test revealed the outlier to eliminate and significance parameters were adapted (F(1,4)<7.71, p > 0.05). These applied also to data pairs where, due to values close to LOD, analytes were found only in two out of the three extraction techniques.
The individual PA-values for all samples, analytes and extraction steps including their standard deviations are listed in Table S10. Analysis of variance for the relative standard deviations calculated from Table S10 reveals that RSD do not vary depending on weighed portion, herb-to-water ratio or concentration of PA, but on sample type, extraction technique, PA (=analyte) and extraction time (Table S11). Figure S2 shows the least squares means plot of RSD vs the applied extraction techniques. While ISO and vendor’s brew have similar RSD, they are lower for acidic extraction at room temperature. Since for all three extraction techniques the sample homogeneity is the same, we assume the extended extraction time applied for acidic extraction (15 vs 6 and 1–10 min) to provide lower RSD. From a plot RSD vs (total) analyte content (Figure S3), median values for RSD and PA concentration of 12% (range 1–71%) and 19 (range 0.1–1100) ng/g, respectively, were determined. The median analyte content of the ten measured samples compares well with a median content of 22 (mean 87) ng/g determined for teas and herbal teas procured from 2013 to 2020 (range 0 (19%) – 1163 ng/g, n = 138, not shown).
Ratio PANO vs PAFB
For the analysed ten teas and herbal teas, the ratio PANO vs PAFB is in the range 0.4–4.5 (median 2.0, n = 10). The ratios are below one only for green tea and mixed herbal tea 1, independent from the extraction technique applied, so possible temperature degradation during extraction should not be the cause for ratios below one (Hösch et al. Citation1996). The ratio is reported to vary depending on the season, but for fresh weeds, a ratio higher than one is expected (Flade et al. Citation2019). In our green tea sample, for all PA-pairs IMO/IM, JBO/JB, LYO/LY and unknO/unkn the free bases dominate, resulting in a PANO vs PAFB ratio of less than one (Figure S4). This trend complies with nine other green tea samples measured by us (data not shown) and is partly supported by Mulder et al. (Citation2015), reporting green tea ratio values below one for IMO/IM and JBO/JB, but considerably above one for LYO/LY, though. This ratio-mismatch might be caused by additional herb treatment and is also noted for iced tea beverages, where 60% of PANO vs PAFB ratios are below one. On the other hand, it is common use to heat or dry green tea to prevent oxidation. That additional treatment, e.g. drying, is able to change the PANO vs PAFB ratio, was shown by Mulder et al. (Citation2009), in whose study dehydration of Senecio-contaminated lucerne resulted in a ratio-decrease. The ratios LYO/LY (except in peppermint and red bush) and EVO/EV were also always below one. In the case of EVO/EV, inappropriate quantitation might be the reason, since EVO for lack of reference substance was quantified with EV. Additionally, RTO/RT ratios in red bush 1 and SVO/SV in peppermint herb 1 are below one.
Tea and herbal tea types investigated
The transfer rates for every extraction step and analyte for brews are listed in and for acidic extraction in Table S12. Since the values are calculated from Table S10, the same constraints regarding (relative) standard deviations apply (see above). In order to keep an overview, in and S12 the indications for standard deviations have been omitted.
Table 3. Transfer rate of every extraction step (extr) for ISO (top) and vendor’s (bottom) infusion preparation. Values are given in (%) and for overview purposes, their corresponding standard deviations have been omitted. These are derivable from the table S10 (median RSD 12%), from which the transfer rates have been calculated
The ten samples contained 4–8 (median 6) PAFB (including SK) and 5–8 (median 6) PANO in the range 0.1–1100 (median 8.1) ng/g and 0.1–661 (median 23.5) ng/g, respectively. Unexpected PA were found in 60% of the samples. RTOiso was found in black tea 1 and both red bush samples (3–8% of total PA-content); unkn & unknO in green tea and mixed herbal tea 2 (3–4% of total PA-content); and senna contained TDiso1 & 2 and TDOiso1 & 2 (60% of total PA-content). Generally, transfer rates for PAFB and PANO of infusions prepared according to ISO instructions were 52–89% (median 73%) and 87–100% (median 91%), respectively. For samples prepared according to vendor’s instructions, PAFB and PANO transfer rates were 63–95% (median 84%) and 95–100% (median 99%), respectively (). For both extractions, PAFB were extracted less efficiently than PANO. PA had slightly lower transfer rates in ISO than in vendor’s extraction.
The green tea sample, following vendor’s instructions, was extracted twice: once with water at 80°C and 2 min steeping time, then with boiling water and 1 min steeping time. Regarding PA, the first extraction was already very efficient, since the median transfer rates for PAFB and PANO were 94 and 99%, respectively, and the second extraction quantitatively removed the remaining compounds ().
Table 4. Sample properties and transfer rates for the ten teas and herbal teas investigated. For transfer rate range (TR) and number of found PA (n) considerations, unkn, SK and TDiso1 & 2 have been assigned to PAFB and RTOiso, unknO and TDOiso1 & 2 to PANO. The composition information refers to vendor’s indication and have not been verified. 1) thyme (30%), elderflower (20%), linden blossoms (20%), anise (5%), blackberry leaves (5%), bitter fennel (5%), rose hip peels (5%), wild thyme (5%), liquorice root (5%). 2) sage, peppermint, blackberry leaves, curly mint, liquorice root, apple, honey granules. 3) Senna angustifolia (Vahl) Batka leaves (current botanical name: Senna alexandrina Mill.)
PA-content of the infusions prepared from the mixed herbal tea 1 sample varied considerably depending on the extraction technique applied (acidic vs ISO vs vendor’s). While the contents of EV, EVO, RTO and the internal standard D3-ATR were independent from the extraction procedure, the values for IMO, LY, LYO, RN and RNO increased remarkably from acidic extraction over ISO-brew (6 min, capped) to vendor’s brew (10 min, capped). IMO increased from 82 to 142 to 648 ng/g, LY from 141 to 174 to 962 ng/g, LYO from 18 to 34 to 108 ng/g, RN from not detected to 0.5 to 2.5 ng/g and RNO from 59 to 99 to 439 ng/g (). This corresponds to an increase of approximately x1, x2 and x7 for the three extraction methods. The PANO vs PAFB ratio remained constant despite parameter changes, but the elevated temperature and time apparently favoured the release of additional LY/LYO-group PA. Mulder et al. (Citation2018) stated an up to 2.4-fold content increase for infusions compared to aqueous acidic extraction at room temperature. Further, mixed herbal tea 1 due to its composition is close to a medicinal herbal tea sample, where ‘acidified mixtures of organic solvents at temperatures up to 100°C for short periods of time apparently leads to optimum yields of PA’ (Kopp et al. Citation2020).
Senna is from Senna angustifolia (Vahl) Batka leaves (current botanical name: Senna alexandrina Mill.), commonly used for medical purposes, i.e. to treat constipation.
Further details on the ten teas and herbal teas used for infusion preparation are presented in .
Transfer rate influencing parameters
Concluded from the above, the infusion preparations according to vendor’s instructions resulted in higher transfer rates compared to ISO-brews. Here and hereafter, the term ‘transfer rate’ refers to the first extraction step (TR1), if not otherwise noted. For both extraction techniques, transfer rates for PANO were above those of PAFB. While the difference between ISO and vendor’s brews could be caused mainly by the different herb-to-water ratios and/or steeping times and temperatures, PAFB- and SK-transfer to water was obviously hindered by chemical properties, i.e., polarity issues.
Since data may have been influenced by additional parameters like tea or herbal tea type, concentration of analytes, chemical properties of PA and whether the extraction vessel had been capped or not, a statistical evaluation was carried out. To get an overview on influencing parameters, a factor and correlation analysis was performed including 12 variables (Table S13). These accounted for transfer rates (TR1, TR2), (total) PA-content (CONC_TOT), extraction technique (EXTR_TECH), herb-to-water ratio (HWR), solvent temperature of 1st extraction (TEMP1), steeping time of 1st extraction (TIME1), capped/uncapped vessel (CAP_UNCAP), analyte type (PAFB_PANO), individual analytes (PA), chemo-structure group of PA (PA_GROUP) and tea or herbal tea type (MATRIX) for all tea and herbal tea samples and brews investigated (n = 351). For the PA_GROUP variable, PA were classified into sub-groups EMG, EMOG, LYG, LYOG, MCG, MCOG, SCG and SCOG (Table S13). Not grouped were JB, JBO, JL, JLO due to their enhanced polarity, i.e. low retention time compared to the other 12-membered macrocyclic diester PA, and SK with its otonecine structure, having an N-methylated tertiary amine group. All these five PA were still considered during statistical evaluation, but treated as single analytes.
In view of data reduction, factor analysis was run limited to a three-factor output, which is presented in Table S14. On factor one, five variables have high loadings, that is, EXTR_TECH, HWR, TEMP1, TIME1 and CAP_UNCAP. Factor one therefore considers the ‘experimental parameters’. On factor two, three variables have high loadings (TR1, TR2, PAFB_PANO = ‘transfer rates & PA-category’) and on factor three two variables (PA, PA_GROUP = ‘detailed properties of PA’). Factors one, two, and three account for 33, 17 and 15% of total variance, respectively. While all three factors together explain 65% of total variance, the factor ‘experimental parameters’ has most importance. The subsequent Spearman correlation analysis (Table S15) reveals the variables correlated with the transfer rates, i.e. mainly PA-category (PAFB_PANO) and with low correlation, steeping temperature and time (TEMP1, TIME1). Little correlation is assigned to concentration (CONC_TOT), extraction technique (EXTR_TECH), herb-to-water ratio (HWR), ‘detailed properties of PA’ (PA, PA_GROUP), tea or herbal tea type (MATRIX) and whether the extraction vessel was capped or not (CAP_UNCAP).
While part of our observations made above are confirmed statistically, others are not clearly identified, but will be investigated subsequently.
The data in Figure S5 demonstrate the dependence of the first extraction transfer rate from the extraction technique applied. While TR1 for PANO is always higher than for PAFB, SK under acidic extraction conditions is close to PANO, but under infusion conditions more resembles PAFB, i.e. the same polarity issue applies both for PAFB and SK. Acidic and ISO extraction share the same HWR (1:50), but differ in TEMP1, TIME1 and extraction solvent. Since mainly PAFB- and SK-transfer rates are affected from different extraction conditions, i.e. ISO-brews having lower TR1, poor analyte protonation seems to be the main cause for their lower transfer rates. On the other hand, the major difference between ISO and vendor’s infusions are the HWR. Lower HWR facilitates transfer of analytes, since vendor’s transfer rates are around 8–34% above ISO. The TR1 for vendor’s PANO is even slightly higher than for acidic PANO (median 99 vs 95%). The outlaying PAFB-values in Figure S5 for ISO (SC in black tea 2) and vendor’s (SC in black tea 1 & 2, RT in black tea 1) might indicate sample-matrix effects for these analytes. Generally, the first transfer rate decreases in the order PANO (vendor’s) > PANO (acidic) ≈ SK (acidic) > SK (vendor’s) > PANO (ISO) > PAFB (acidic) > PAFB (vendor’s) > PAFB (ISO) > SK (ISO). Effects already noted from validation data support these findings. There the efficiency difference of acidic extraction vs ISO-brew was observed as slope-deviation in matrix-matched calibration curves.
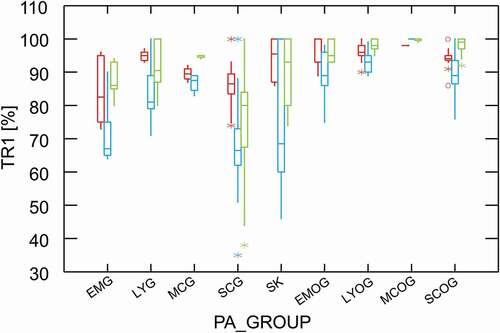
The transfer rate 1 vs individual PA, for the three extraction techniques separately, is plotted in Figure S6. PA have been sorted according to PA_GROUP-criteria and except for EMG, whose members have quite heterogeneous transfer rates, the group assignment for the other PA appears reasonable. Additionally, it turns out that the first transfer rates for JB/JBO are similar to SCG/SCOG, JL/JLO to LYG/LYOG and SK to LYG. For a simplified overview, TR1 vs PA_GROUP is shown in . For this plot and subsequently, JB/JBO was integrated in the SC/SCO-group and JL/JLO omitted due to its low occurrence (n = 2x2). Generally, transfer rate 1 in brews decreases in the order MCOG > LYOG > EMOG ≈ SCOG > MCG > LYG > SK > EMG ≈ SCG, representing the polarity and proton activity of the analytes under investigation.
Figure 1. Box plot of the 1st transfer rate (TR1) vs PA groups, sorted by PAFB, SK, PANO and grouped by acidic (1st box), ISO (2nd box) and vendor’s extraction (3rd box)
From Figure S7 an increase of transfer rate with decreasing HWR is observed. From HWR 1:50 (n = 117) to 1:100 (n = 84) there is a noticeable increase in transfer rate for all PA-groups, while subsequent transfer rate-increase with decreasing HWR to 1:125 (n = 10) and 1:143 (n = 23) due to the low number of experiments is uncertain. Still, the transfer rates of the latter are always higher than those of HWR 1:50.
For ISO-brews and additionally as a control also for acidic extraction, multiple extractions were applied to study the step-by-step decrease of transfer rates. While for infusion preparation according to ISO, PANO are hardly found in the 3rd brew (Figure S8), PAFB and SK are found even in the 4th acidic extraction. Especially EM, EV, JB, RT, SC, SP, SV and as mentioned SK require an acidic ambient to be fully extracted under our conditions applied (). For acidic extraction of the ten tea and herbal tea samples, the first extraction median transfer rate for PAFB, PANO and SK was 89, 95 and 96%, respectively. The second extraction median transfer rates were for PAFB, PANO and SK 10, 5 and 4%, respectively. Little PA were found in the third extraction with median transfer rates for PAFB, PANO and SK of 1, 0 and 0% (Figure S9, Table S12).
With regard to toxicological aspects and since transfer rates and thus intake estimates depend on them, it is important to note that there is a difference between the ISO- and the vendor’s-transfer rate. displays the ratio of the first transfer rate of vendor’s vs ISO brews. The transfer rate differences for all PA (n = 115) are in the range −17 to 54% (median 8%). The offset line in represents this median difference for all PA-ratios. While the PANO due to their high transfer rates group in the upper right corner of the diagram, the PAFB (and SK) allow for detailed investigation. For simplicity and due to its close hot water extraction property compared to PAFB, SK was assigned to PAFB hereafter. Low abundant PAFB (Number 1: JB, JL, SK, unkn in green tea, SK in both peppermint herbs) tend to have high vendor’s vs ISO transfer rate ratios. Circle 2 is a cluster of EM, EV and RT, SC, SP, SV mainly from peppermint herbs. Numbers 3 refer to red bush samples with data points for RT, SV and LY. Data point number 4 belongs to RT in mixed herbal tea 2 and data points number 5 are from SC and RT in black tea 1 and SC in black tea 2. From this, we conclude that apart from HWR, there is a transfer rate dependence on the chemical properties of the PA, tea or herbal tea type and analyte concentration. To further study the influence of tea or herbal tea type, Figure S10 shows the dependence of the first transfer rate from sample type and brewing technique. Again, a notable difference in transfer rates, TR1(PAFB) < TR1(PANO) and TR1(ISO) < TR1(vendor’s), is observed. Additionally, the data show an enhanced matrix effect for both black tea samples by corresponding low transfer rates for PAFB. In Figure S11, the transfer rates for black teas are plotted against the averaged values of analytes. As previously discussed, the transfer rates especially of RT and SC, but also for JB, are low in black tea herbs. SK and SV do not share this behaviour, having transfer rates of 100%, due to their low abundance, around LOD (Table S10).
Figure 2. Plot of vendor’s vs ISO transfer rates. The dotted line denotes equal transfer rates, while most ratios lie on the straight offset line, representing the calculated transfer rate difference of 8%. Dots denote PAFB (including SK), crosses PANO. Numbers indicate low abundant PAFB (1), peppermint herb cluster (2), red bush (3), mixed herbal (4) and black teas (5) samples. For details, see text
To decide on the influence of steeping time, our data are rather weak. Since ISO-brews were always extracted at a steeping time of 6 min, the only interpretable data are from the vendor’s brews, HWR 1:100, with steeping times of 4 (n = 22), 6 (n = 26) and 10 (n = 36) minutes. Figure S12 depicts an increase in transfer rate for EMG (1%/min), LYG (3%/min), LYOG (1%/min), SCG (4%/min) and SCOG (1%/min) with increasing steeping time, while the information from the other analytes is not interpretable, since their values are around LOD (SK in black tea, 4 min) or have already transfer rates close to 100% at low steeping times (EMOG). Additionally, in case of SCG, the previously discussed matrix effect of black teas probably influences corresponding transfer rates, shown in Figure S12. Another example for the influence of steeping time has already been discussed for the mixed herbal tea 1 sample, where the total PA-content increases from 638 to 2412 ng/g (factor ~4) for a steeping time increase of 4 (from 6 to 10) minutes, while transfer rates are not distinct, though.
Due to the scarce data on possible influence of steeping temperature, 91% (n = 212) of brews were prepared with boiling water and only 9% (n = 22) with water at 80°C, applied even at differing tea and herbal tea-type samples, no inferences can be drawn from our data. For the CAP_UNCAP variable we would predict an increased transfer rate for capped vessels, but since the temperature difference of uncapped vs capped according to our heat dissipation measurements was only 0.7°C/min steeping time, and data origin from dissimilar tea or herbal tea-type samples, no conclusion can be made based on our experimental conditions ().
Survey
Iced tea beverages
A total of 25 different PA were found in the 46 iced tea beverage samples (), in the range 1 to 248 ng/L, while total contents ranged from 0 (17%) to 631 (median 40) ng/L. Additionally to the PA found in herbs, EFO, LC and LCO were detected. Since chromatographic peaks for some closely eluting isomers in iced tea beverages sometimes tended to be distorted and not well resolved, the determined values were ascribed to the main peak. This was especially the case for LY/LYO group members (IM, IMO, LY, LYO, RN, RNO) and for SC/SV. shows the distribution of the total PA-content for the 46 samples, lowest to highest. Two samples lie significantly above the others, a beverage declared to contain herbs from the alps (518 ng/L, 4 PA) and a beverage made from black tea extract (613 ng/L, 8 PA). While details on found PA for all samples are given in Table S16, the insert of displays the total PA concentration vs declared extract origin. Black tea extracts and alpine herbs contents lie above green tea extract, mixed herbal, unknown origin of extract, peppermint and fennel extract (Table S17). From the PA found in the beverages with undeclared origin of extract (HTO, IMO, LY, LYO), we conclude that these iced teas were prepared with black tea extracts. The predominant PA found in all positive samples are from the LY/LYO-group, for four beverages made of black tea extract additionally from the SC/SCO-group, being consistent with the PA composition of black tea herbs. Three out of five beverages from alpine herb extracts have high loads on IM/IMO, LY/LYO and RNO, especially on the N-oxides. This pattern is possibly due to a contamination with Eupatorium cannabinum (Roeder Citation1995; Kast et al. Citation2018). Literature quotes the PA-content of iced tea beverages as 0 (33%) −250 (median 40) ng/L, n = 9 (Engeli Citation2014) and 0 (25%) −7590 (median 30) ng/L, n = 28 (Picron et al. Citation2018). Both median values are in good agreement with our findings.
Figure 3. Total PA-content of iced tea beverages, sorted lowest to highest (n = 46). Letters in sample names denote unknown extract origin (?), alpine herbs (a), black tea (b), fennel (f), green tea (g), herbal tea (h), mixed herbal (m), peppermint (p) and numbers indicate the quantity of PA found. The insert of the Figure displays the PA-content distribution depending on declared origin of extract
The ratio PANO vs PAFB for iced tea beverages is in the range 0.05–7.4 (median 0.6, n = 27). A ratio below one might indicate additional herb or tea extract treatment, as mentioned above. For tea and herbal tea, this was especially the case for green tea herb, while for iced tea beverages ratios of black and green tea were below one and those containing mixed herbal, peppermint and alpine herb extracts were above one. Possibly, for those with ratio below one, extracts have been exposed to additional treatments like drying.
Figure S4 compares the median values for PANO vs PAFB-ratios derived from tea and herbal tea samples and iced tea beverages.
Products over time
Three herbal tea products with seven different lots and five iced tea beverages were monitored from 2013 to 2020 (Table S18). While the package for these samples remained the same over time, the contents obviously changed considerably, as shown by PA amounts found. In herbal teas, the observed deviations within lots are always smaller than the annual difference, therefore allowing for a trend interpretation over time. While a significant decrease for total PA in the mixed herbal tea (>80%) and the two peppermint herbs (>95%) was noted, content of PA tend to rise in four out of five ice tea beverage products (>80%).
Of course, the modest number of samples measured does not allow for a general statement, but there are signs of improvement concerning producer’s awareness, at least for the herbal tea products, but further surveys are necessary to judge future development. That PA-levels in different teas and herbal infusions are lower than in previous years was also observed by EFSA (Citation2016).
Additionally, Table S18 demonstrates that homogeneity of sample is an issue in PA quantification. Comparing the relative standard deviations from herbs and beverages, median values of 14% (range 4–38%) and 4% (range 1–33%) result, respectively. While beverages represent homogeneous solutions, herbs require extended homogenisation preceding analysis.
Atropine as additional contaminant
Atropine was found in 50% of the teas and herbal teas, and in 13% of the iced tea beverages, quantified by the internal standard D3-atropine under matrix-matched conditions. The green tea herb sample, red bush 1 and both black teas contained 1 ng/g atropine; senna 2 ng/g; and both mixed herbal teas 4 ng/g. Six of the 46 iced tea beverages contained atropine in the range 2–65 (median 13) ng/L (Table S16). Scopolamine, whose concentration according to our experience is around 14% of that of atropine in tea and herbal tea samples (n = 48, 18% positive for scopolamine, not shown), was not detected.
Intake estimation and evaluation
From our own and most of the literature findings (Lüthy et al. Citation1980; Engeli Citation2014; Mulder et al. Citation2018) a general transfer rate of 80–100% for PA must be assumed for infusions, especially when prepared according to vendors’ and not ISO instructions (this study).
Assuming a consumption of 0.5 L of infusion per day for a regular consumer and applying the median values that we determined, that is, a PA-content of 22 ng/g herb, (vendor’s) transfer rate of 95% and a herb-to-water-ratio of 1:120, would lead to a daily intake of 87 ng of PA. For an individual of 70 kg body weight this leads to an MOE of about 190,000 according to the assessment of EFSA (Citation2017). This means that for an adult regular consumer of herbal brews the intake from this source alone would be of low concern. However, if the mean value of 87 ng/g is used instead of the median for calculations, the MOE drops to 48,000. Assuming additionally a child of 15 kg body weight consuming the same beverage, we are already at the threshold of concern. Moreover, there are products far above the mean and other PA-sources are not yet taken into account. Therefore, efforts to reduce impurities in tea and herbs for herbal infusions must continue. The PA-intake from iced tea beverages is considerably lower than from infusions, we estimate by a factor of 6, and together with a worldwide consumption of 37 billion litres (Citation2016; Conway Citation2020), i.e. a factor of 8 less than infusions, appears negligible, but might be important for high-level consumers or children.
Conclusion
Regarding quantification, it is important to screen samples for unexpected PA. Although quantitation of unknowns results in estimations only, this aspect should not be overlooked. In some of our samples, TD/TDO-isomers and the often ignored EV/EVO accounted for 60 and 17% of total content, respectively. While iced tea beverages represent uniform samples, tea and herbal tea require extended homogenisation prior to analysis. On the other hand, this is quite different from the consumer’s way of preparing infusions.
The undocumented feature of the applied SPE material allowed for selective PANO vs PAFB separation in a two-step elution. Together with fingerprint peaks from MS and MS/MS, this is a valuable qualitative identification tool, which could also be of interest and exploited for preparative purposes.
The median transfer rates for PA from brews according to ISO and vendor’s instructions were 87 and 95% (n = 2×117), respectively. In our data, decreasing herb-to-water ratio and increasing steeping time raised the transfer rate of PA, while tea or herbal tea type, proton affinity of PA and concentration had additional influence. Since there is a pH-dependence on the transfer rate especially for PAFB and SK, acidic tea or herbal tea types would suggest enhanced transfer rates, but it is unlikely that the pH of brewed herbs would be low enough to have an effect on PA-extraction. Additionally, more acid is expected to be released from tea or herbal tea with increasing brewing time, an issue that was not investigated by us.
The findings on transfer rate influencing parameters are in agreement with the results of the performed correlation analysis involving 12 parameters.
The herein commonly applied acidic extraction technique used to determine total PA-content, 0.05 M sulphuric acid at room temperature, turned out to be suboptimal in one out of ten cases, where boiling water gave rise to a factor of about seven higher PA-content instead.
In view of toxicological relevance, it is important to analyse tea or herbal tea samples as close to consumer habits as possible. It is a challenge to predict PA-content of infusions from the herbs used, since transfer rates of PA depend on many factors and may vary considerably. Therefore, PA-content of infusions rather than their herbs should be determined and the brew preferably be prepared according to vendor’s and not ISO instructions, in order to assess realistic consumer exposure.
Although there is growing awareness of tea and herbal tea contamination with PA-containing weeds, further efforts on solving and surveying this issue are required. Still, PA-free teas and herbal teas are most easily found among loose herbs, while bagged products are typically blended to attain a constant flavour profile over time.
Concerning risk assessment, intake from iced tea is low, but could be of concern for high-level consumers and children.
Supplemental Material
Download MS Word (1.7 MB)Acknowledgments
We are grateful to Simone Staiger, who drew our attention to senna.
Disclosure statement
No potential conflict of interest was reported by the author(s).
Supplementary material
Supplemental data for this article can be accessed on the publisher’s website.
Correction Statement
This article has been republished with minor changes. These changes do not impact the academic content of the article.
References
- Asres K, Sporer F, Wink M. 2004. Patterns of pyrrolizidine alkaloids in 12 Ethiopian Crotalaria species. Biochem Syst Ecol. 32:915–930. doi:https://doi.org/10.1016/j.bse.2004.03.004.
- [BfR] Bundesinstitut für Risikobewertung, Berlin (Germany). 2013. Pyrrolizidine alkaloids in herbal teas and teas. Opinion No. 018/2013 of July 5, 2013. [accessed 2021 Jun 18]. https://www.bfr.bund.de/cm/349/pyrrolizidine-alkaloids-in-herbal-teas-and-teas.pdf.
- Bolton D. 2018. Tea consumption second only to packaged water. Farmingham (MA): WorldTeaNews. [accessed 2021 Jun 18]. https://worldteanews.com/tea-industry-news-and-features/tea-consumption-second-only-to-packaged-water.
- Boppré M, Colegate SM, Edgar JA. 2005. Pyrrolizidine alkaloids of Echium vulgare honey found in pure pollen. J Agric Food Chem.53(3):594–600. doi:https://doi.org/10.1021/jf0484531.
- Chen LH, Wang JC, Guo QL, Qiao Y, Wang HJ, Liao YH, Sun DA, Si JY. 2019. Simultaneous determination and risk assessment of pyrrolizidine alkaloids in artemisia capillaris thunb. by UPLC-MS/MS together with chemometrics. Molecules. 24(6):1077. doi:https://doi.org/10.3390/molecules24061077.
- Cheng D, Nguyen VT, Ndihokubwayo N, Ge J, Mulder PPJ. 2017. Pyrrolizidine alkaloid variation in Senecio vulgaris populations from native and invasive ranges. PeerJ. 5:e3686. doi:https://doi.org/10.7717/peerj.3686.
- [CA] Codex Alimentarius. 2014. Code of practice for weed control to prevent and reduce pyrrolizidine alkaloid contamination in food and feed. FAO WHO. CAC/RCP 74-2014. [accessed 2021 Jun 18]. http://www.fao.org/input/download/standards/13794/CXP_074e_2014.pdf.
- Colegate SM, Gardner DR, Joy RJ, Betz JM, Panter KE. 2012. Dehydropyrrolizidine alkaloids, including monoesters with an unusual esterifying acid, from cultivated Crotalaria juncea (Sunn Hemp cv. ‘Tropic Sun’). J Agric Food Chem. 60(14):3541–3550. doi:https://doi.org/10.1021/jf205296s.
- Conway J. 2020. Consumption of iced tea worldwide. New York (NY): Statista. [accessed 2021 Jun 18]. https://www.statista.com/statistics/752221/global-iced-tea-consumption/.
- Cymerman Craig J, Purushothaman KK. 1970. Improved preparation of tertiary amine N-oxides. J Org Chem. 35:1721–1722. doi:https://doi.org/10.1021/jo00830a121.
- [EFSA] European Food Safety Authority. 2011. EFSA panel on contaminants in the food chain. Scientific opinion on pyrrolizidine alkaloids in food and feed. EFSA J. 9(11):2406. [134 p.]. doi:https://doi.org/10.2903/j.efsa.2011.2406.
- [EFSA] European Food Safety Authority. 2016. Dietary exposure assessment to pyrrolizidine alkaloids in the European population. EFSA J. 14(8):4572. [50 p.]. doi:https://doi.org/10.2903/j.efsa.2016.4572.
- [EFSA] European Food Safety Authority. 2017. EFSA panel on contaminants in the food chain. Statement on the risks for human health related to the presence of pyrrolizidine alkaloids in honey, tea, herbal infusions and food supplements. EFSA J. 15(7):4908. [34 p.]. doi:https://doi.org/10.2903/j.efsa.2017.4908.
- Engeli B. 2014. Pyrrolizidinalkaloide in Kräutertee, Tee, Eistee und Gewürzkräutern [Pyrrolizidine alkaloids in herbal teas, tea, iced tea beverages and aromatic herbs]. Oral presentation at: German Senate Commission on Food Safety SKLM; May 7; Hannover, Germany. German.
- [EU] European Union. 2020. Commission Regulation (EU) 2020/2040 of 11 December 2020 amending Regulation (EC) No 1881/2006 as regards maximum levels of pyrrolizidine alkaloids in certain foodstuffs. Off J Eur Union L. 420:1–5. [accessed 2021 Jun 18]. https://eur-lex.europa.eu/legal-content/EN/TXT/?uri=CELEX:32020R2040
- Flade J, Beschow H, Wensch-Dorendorf M, Plescher A, Wätjen W. 2019. Occurrence of nine pyrrolizidine alkaloids in Senecio vulgaris L. Depending on developmental stage and season. Plants. 8(3):54. doi:https://doi.org/10.3390/plants8030054.
- Fletcher MT, Hayes PY, Somerville MJ, De Voss JJ. 2011. Crotalaria medicaginea associated with horse deaths in Northern Australia: new pyrrolizidine alkaloids. J Agric Food Chem. 59:11888–11892. doi:https://doi.org/10.1021/jf203147x.
- Hartmann T, Witte L. 1995. Chemistry, biology and chemoecology of the pyrrolizidine alkaloids. In: Pelletier SW, editor. Alkaloids: chemical and biological perspectives. Vol. 9. Oxford (UK): Pergamon Press; p. 155–233.
- Hösch G, Wiedenfeld H, Dingermann T, Röder E. 1996. A new high performance liquid chromatography method for the simultaneous quantitative analysis of pyrrolizidine alkaloids and their N-oxides in plant material. Phytochemical Anal. 7:284–288. doi:https://doi.org/10.1002/(SICI)1099-1565(199611)7:6<284::AID-PCA315>3.0.CO;2-V.
- [ISO] International Organisation for Standardisation. 1980. ISO standard 3103: 1980. Tea – Preparation of liquor for use in sensory tests.
- [ISO] International Organisation for Standardisation. 2015. ISO standard 13528: 2015. Statistical methods for use in proficiency testing by interlaboratory comparison.
- Kaltner F, Stiglbauer B, Rychlik M, Gareis M, Gottschalk C. 2019. Development of a sensitive analytical method for determining 44 pyrrolizidine alkaloids in teas and herbal teas via LC-ESI-MS/MS. Anal Bioanal Chem. 411:7233–7249. doi:https://doi.org/10.1007/s00216-019-02117-1.
- Kast C, Kilchenmann V, Reinhard H, Droz B, Lucchetti MA, Dübecke A, Beckh G, Zoller O. 2018. Chemical fingerprinting identifies Echium vulgare, Eupatorium cannabinum and Senecio spp. as plant species mainly responsible for pyrrolizidine alkaloids in bee-collected pollen. Food Addit Contam Part A. 35:316–327. doi:https://doi.org/10.1080/19440049.2017.1378443.
- Kopp T, Abdel-Tawab M, Mizaikoff B. 2020. Extracting and analyzing pyrrolizidine alkaloids in medicinal plants: a review. Toxins. 12:320. doi:https://doi.org/10.3390/toxins12050320.
- Lu W, Kimball E, Rabinowitz JD. 2006. A high-performance liquid chromatography-tandem mass spectrometry method for quantitation of nitrogen-containing intracellular metabolites. J Am Soc Mass Spectrom. 17:37–50. doi:https://doi.org/10.1016/j.jasms.2005.09.001.
- Lucchetti MA, Kilchenmann V, Glauser G, Praz C, Kast C. 2018. Nursing protects honeybee larvae from secondary metabolites of pollen. Proc Royal Soc B-Biol Sci. 285:20172849. doi:https://doi.org/10.1098/rspb.2017.2849.
- Lüthy J, Zeifel U, Schlatter C, Benn MH. 1980. Pyrrolizidine-Alkaloide in Huflattich (Tussilago farfara L.) verschiedener Herkunft [Pyrrolizidine alkaloids in coltsfoot (Tussilago farfara L.) of diverse origins]. Mitt Gebiete Lebensm Hyg. 71:73–80. German.
- Mägde I, Gehling M, Schöne C, Winterhalter P, These A. 2020. Pyrrolizidine alkaloid profiling of four Boraginaceae species from Northern Germany and implications for the analytical scope proposed for monitoring of maximum levels. Food Addit Contam Part A. 37:1339–1358. doi:https://doi.org/10.1080/19440049.2020.1757166.
- Mulder PPJ, Beumer B, Oosterink E, de Jong J. 2009. Dutch survey pyrrolizidine alkaloids in animal forage. Wageningen (NL): University of Wageningen. RIKILT report 2009.018. [accessed 2021 Jun 18]. https://edepot.wur.nl/135952.
- Mulder PPJ, López Sánchez P, These A, Preiss-Weigert A, Castellari M. 2015. Occurrence of pyrrolizidine alkaloids in food - external scientific report. EFSA supporting publication 2015: EN-859, p. [116 p.]. doi: https://doi.org/10.2903/sp.efsa.2015.EN-859.
- Mulder PPJ, López P, Castelari M, Bodi D, Ronczka S, Preiss-Weigert A, These A. 2018. Occurrence of pyrrolizidine alkaloids in animal- and plant-derived food: results of a survey across Europe. Food Addit Contam Part A. 35:118–133. doi:https://doi.org/10.1080/19440049.2017.1382726.
- P1706-RMRo. 2017. Validated reference material. Pyrrolizidine alkaloids in rooibos tea. Bremen (Germany): Proof-ACS GmbH.
- Picron JF, Herman M, Van Hoeck E, Goscinny S. 2018. Analytical strategies for the determination of pyrrolizidine alkaloids in plant based food and examination of the transfer rate during the infusion process. Food Chem. 266:514–523. doi:https://doi.org/10.1016/j.foodchem.2018.06.055.
- Roeder E. 1995. Medicinal plants in Europe containing pyrrolizidine alkaloids. Pharmazie. 50:83–98.
- Rösemann GM, Botha CJ, Eloff JN. 2014. Distinguishing between toxic and non-toxic pyrrolizidine alkaloids and quantification by liquid chromatography-mass spectrometry. Pretoria (ZA): University of Pretoria. [accessed 2021 Jun 18]. https://repository.up.ac.za/bitstream/handle/2263/45824/Rosemann_Distinguishing_2014.pdf.
- Strehmel N, Böttcher C, Schmidt S, Scheel D. 2014. Profiling of secondary metabolites in root exudates of Arabidopsis thaliana. Phytochemistry. 108:35–46. doi:https://doi.org/10.1016/j.phytochem.2014.10.003.
- Tashkhodzhaev B, Telezhenetskaya MV, Yunusov SY. 1979. Crystal and molecular structure of the macrocyclic pyrrolizidine alkaloid incanine. Chem Nat Comp. 15:315–319. doi:https://doi.org/10.1007/BF00566083.
- These A, Bodi D, Ronczka S, Lahrssen-Wiederholt M, Preiss-Weigert A. 2013. Structural screening by multiple reaction monitoring as a new approach for tandem mass spectrometry: presented for the determination of pyrrolizidine alkaloids in plants. Anal Bioanal Chem. 405:9375–9383. doi:https://doi.org/10.1007/s00216-013-7365-4.
- Uhlig S, Simon K, Frost K. 2019. Bestimmung von Pyrrolizidinalkaloiden in Tee [Determination of pyrrolizidine alkaloids in tea]. Dresden (Germany): QuoData GmbH. German.
- van de Schans MGM, Blokland MH, Zoontjes PW, Mulder PPJ, Nielen MWF. 2017. Multiple heart-cutting two dimensional liquid chromatography quadrupole time-of-flight mass spectrometry of pyrrolizidine alkaloids. J Chromatogr A. 1503:38–48. doi:https://doi.org/10.1016/j.chroma.2017.04.059.
- Wiedenfeld H, Roeder E, Anders E. 1985. Pyrrolizidine Alkaloids From Seeds Of Crotalaria scassellatii. Phytochemistry. 24(2):376–378. doi:https://doi.org/10.1016/S0031-9422(00)83565-7.
- Yoon SH, Kim MS, Kim SH, Park HM, Pyo H, Lee YM, Lee KT, Hong J. 2015. Effective application of freezing lipid precipitation and SCX-SPE for determination of pyrrolizidine alkaloids in high lipid foodstuffs by LC-ESI-MS/MS. J Chromatogr B. 992:56–66. doi:https://doi.org/10.1016/j.jchromb.2015.04.007.
- Zhang P, Chan W, Ang IL, Wei R, Lam MMT, Lei KMK, Poon TCW. 2019. Revisiting fragmentation reactions of protonated α-amino acids by high-resolution electrospray ionization tandem mass spectrometry with collision-induced dissociation. Sci Rep. 9:6453. doi:https://doi.org/10.1038/s41598-019-42777-8.