
ABSTRACT
Thiouracil (2-thiouracil) is a thyreostatic compound that can be used as an illegal growth promoter. In bovine, porcine and other farm animals, low concentrations of thiouracil are detected in urine. There is much debate on which concentrations can be considered to originate from feed (‘natural’) and which concentrations are caused by the illegal administration of thiouracil for growth-promoting purposes. Currently, a threshold value of 10 µg/L in urine is applied. The threshold value is based on epidemiological data. Data on thiouracil from animals treated with thiouracil is scarce. We conducted a study whereby animals were fed with rapeseed, rapeseed with thiouracil, or regular feed with thiouracil (low and high concentration). It was determined that administration of thiouracil leads to concentrations higher than the current 10 µg/L threshold of thiouracil and its metabolites in urine during treatment. Animals fed with rapeseed showed higher thiouracil concentrations than the control group, mostly above 10 µg/L and in some cases above 30 µg/L. In the discovery study, several biomarkers for thiouracil treatment were tentatively identified and confirmed with reference standards. One metabolite was identified as indicative for thiouracil abuse, namely 6-methyl-thiouracil. Another metabolite, 4-thiouracil, was indicative for endogenous formation and did not increase during 2-thiouracil treatment. 6-Methyl-thiouracil was not found in urine samples from the Dutch routine control programmes that contained (endogenous) 2-thiouracil above the threshold value. However, 4-thiouracil was found at high concentrations in the same samples when 2-thiouracil was present. This study’s overall conclusion is that the threshold value for thiouracil in bovine urine samples should be set at 10 µg/L and for porcine urine samples at 30 µg/L. Also, confirmation of 6-methyl-thiouracil and 4-thiouracil should be used as indicators for exogenous or endogenous origin in routine control monitoring programmes.
Introduction
Thyreostats can be used to enhance growth in cattle and pigs. However, the use of thyreostats for this purpose is forbidden in the European Union since 1981 (European Community Citation1981). Animals fed with thiouracil will retain more water in their tissues, and therefore their carcase weight will increase. This makes it beneficial for farmers to abuse thiouracil for this purpose. The produced meat, however, will be of inferior quality since it contains a lot of water. Moreover, there are also food safety risks associated with the use of thyreostatics as they are categorised as class 2B substances (possibly carcinogenic) by the International Agency for Research on Cancer (IARC Working Group Citation2001). There is also a risk for consumers to consume meat that is contaminated with thyreostatics. When animals are illegally treated with these compounds, approximately five grams per day are administered orally to reach weight gain (Beeson et al. Citation1947).
Currently, thiouracil belongs to group A2 compounds stipulated in Council Directive 96/23/EC (European Commission Citation1996). No Minimum Required Performance Level (MRPL), Maximum Residue Limit (MRL), or Reference Point for Action (RPA) have been established. In the CRL Guidance paper of December 2007 (CRL Citation2007) a recommended concentration for control of 10 µg/L or kg in urine and thyroid for bovine animals was proposed. However, this included the comment that concentrations smaller than 10 µg/L or kg could be of natural origin due to a cruciferous diet (Brassicaceae) (Pinel et al. Citation2006a; Vanden Bussche et al. Citation2009). As long ago as 1941 (Kennedy and Purves Citation1941) found that cruciferous vegetables contain goitrogens, which weaken iodine uptake by the thyroid and consequently prevent the conversion of thyroxine (T4) to triiodothyronine (T3).
Because during the last decade, more European Union (EU) Member States introduced sensitive LC-MS/MS methods (Blanchflower et al. Citation1997; Pinel et al. Citation2005) in their laboratories for the analyses in the National Residue Control Plans, more cases of thiouracil detection were reported (Le Bizec et al. Citation2011; Bizec et al. Citation2012; Wozniak et al. Citation2012). The detected values sometimes even exceeded the 10 µg/L threshold (Wauters et al. Citation2015). Vanden Bussche et al. (Vanden Bussche et al. Citation2011b) showed that thiouracil was found in untreated animals in porcine, bovine, ovine, dog species, and human volunteers (Vanden Bussche et al. Citation2011a). Also in the same study evidence was provided that endogenous plant compounds can be converted by myrosinase activity into thiouracil, which can be the reason for the thiouracil findings in the investigated animal species. Kiebooms et al. (Citation2014) presented in vitro model studies of the gastrointestinal tract (stomach/rumen, small intestine, colon) of bovines and porcine concerning thiouracil formation upon Brassicaceae digestion. This study showed that after adding various Brassicaceae (rapeseed, rapeseed meal, broccoli, cauliflower) to colonic fluids, traces of thiouracil were formed. Concentrations in the colonic suspensions upon rapeseed digestion ranged from 3.5–31 µg/kg thiouracil in the bovine model and 3.6–26 µg/kg in the porcine model. Active bacterial involvement was shown to be the main reason for the formation. Since there was serious evidence that thiouracil could have a natural origin and that the set threshold of 10 µg/L was too low, resulting in a large number of false-positive results, it was advised after an international survey to raise the threshold from 10 to 30 µg/L in urine (Sterk et al. Citation2014; Wauters, Vanden Bussche, Bizec, Kiebooms, Dervilly-Pinel, Prevost, Wozniak, Sterk, Gronningen, Kennedy, Russell, Delahaut and Vanhaecke Citation2015).
The current threshold for discriminating thiouracil abuse from the endogenous formation is based on data on thiouracil’s “natural” occurrence. This data does not take intentional abuse of thiouracil into account. Therefore the threshold could be set too high and could introduce a risk of abuse of thiouracil without detection because the measured concentration levels are below the set threshold. Data for intentional abuse of thiouracil is scarce. Two different studies (Wauters et al. Citation2017; Van Meulebroek et al. Citation2018) were performed to determine threshold levels based on animal experiments whereby bovines were treated with thiouracil. One of these studies was also aiming to identify relevant biomarkers for thiouracil abuse (Van Meulebroek et al. Citation2018). In the two studies conducted during which animals were treated with thiouracil, the concentration of thiouracil in urine was very high during administration (>10.000 µg/L). After the rapeseed administration, thiouracil concentrations in urine were much lower but still higher than 10 µg/L. After the treatment period, the concentration of the thiouracil dropped rapidly. Several biomarkers were also tentatively identified (Van Meulebroek et al. Citation2018), and a decision model was built combining these biomarkers to determine whether an animal has been treated with thiouracil or not. There is no information available on exogenous levels after the administration of thiouracil to species other than bovine.
Our studies’ first objective was to determine unambiguous threshold values for thiouracil after treatment with thiouracil or feeding rapeseed containing diet in bovine- and porcine animals. Thiouracil treatments were carried out using a “low” and a “high” dose of thiouracil. Additionally, animals were fed with a rapeseed enriched diet and a combined treatment with a rapeseed enriched feed with a low thiouracil dose. In the urine samples obtained before, during, and after the treatment, thiouracil concentrations were determined, and biomarker discovery studies were conducted. For the study’s second objective, a discovery study was conducted to identify biomarkers that can discriminate between endogenous formation and exogenous administration of thiouracil. The study’s overall goal was to establish a strategy to discriminate between thiouracil findings due to endogenous formation and illegal administration in both bovine- and porcine animals.
Materials and methods
Animal study
Animal feed
This study’s animal feed was self-made and was a special mix that did not contain any plants from the Brassicaceae species. To a batch of this feed, a high amount of rapeseed (25–30 %) was added. A low and a high concentration of thiouracil (respectively 0.2 and 2 mg/kg) was added to the two other batches. Due to the high rapeseed content, the animals had to get used to eating this feed. For this purpose, the animals were fed with an increasing amount of rapeseed before the treatment period. On day −3: 1/3 part of the feed contains 25–30 % rapeseed; day −2: 1/2 part of the feed contains 25–30 % rapeseed; day −1: 2/3 part of the feed contains 25–30 % rapeseed. During the treatment period, the animals in this group were fed with 25–30 % of rapeseed containing feed. The rapeseed was added to concentrated feed to mask rapeseed taste. The animals were locked for a short time so that each animal consumed the right amount of rapeseed. After the treatment period, all animals were getting the special mix animal feed.
Porcine animal study
In total, twenty porcine animals (commercial crossbreeds) of 5 months old and weighing approximately 25 kg at the start of the animal study were used. The animal study was carried out with three compositions of thiouracil and/or rapeseed (Brassicaceae). Thiouracil treatments have been carried out within two separate groups using thiouracil; a ‘low’ dose of 0.2 g thiouracil per 100 kg body weight per day, and a ‘high’ dose of 2 g thiouracil per day 100 kg of body weight. Rapeseed treatment took place within one group with a dosage of 25–30 % rapeseed through the feed for seven days. The combined treatment took place with a ‘low dosage’ of 0.2 g thiouracil (per 100 kg body weight) and rapeseed for seven days. Animals were weighed before treatment to calculate the correct concentration of thiouracil to be administered. In total, there are five groups of animals: 1. untreated (4 animals) – control group, 2. treatment with rapeseed (4 animals), 3. treatment with thiouracil 0.2 g/100 kg body weight (4 animals), 4. treatment with thiouracil 2 g/100 kg body weight (4 animals), 5. treatment with thiouracil 0.2 kg/100 kg body weight and rapeseed (4 animals). Urine samples were taken each day during treatment until two weeks after the last treatment until slaughter (Table S1).
Bovine animal study
In total, six cows (Holstein Friesians) of 4 months old and weighing approximately 100 kg at the start of the animal study were used. Thiouracil treatment took place within a group using thiouracil with a dosage of 2 g thiouracil per 100 kg body weight per day. Rapeseed treatment took place within a group with an addition of 25–30% rapeseed to the feed for 7 days. There were three groups of animals: 1. untreated (2 bovines) – control group, 2. treatment with 25–30% rapeseed added to the feed (2 bovines), 3. treatment with thiouracil 2 g/100 kg body weight (2 bovines). Each day, urine samples were collected during treatment and for two weeks after the last treatment until slaughter (Table S1).
Both animal studies were performed following ethical approval at Wageningen Research, the Netherlands. The treatment schemes used were in accordance with the knowledge we currently have on how illegal treatment is conducted.
Sample storage
All samples are stored at <-18 °C until analysis.
Chemicals
All chemicals, including standards and solutions, were of defined quality. Pure chemicals were “pro analyse” quality, ULC grade methanol, water, and formic acid were obtained from ActuAll Chemicals (Oss, The Netherlands). Standard solutions were prepared in ethanol. All standard stock solutions were made with a concentration of 1000 mg/L. An Isolute SLC+ 200 µl array wells plate (Biotage, Uppsala, Sweden) was used for sample clean-up of urine samples.
Discovery study (untargeted)
Dithiothreitol, dimethyl sulphoxide (DMSO), ethyl acetate, and ethanol absolute were obtained from Sigma-Aldrich Chemie N.V. (Zwijndrecht, Netherland). Phosphate buffer pH 7.4 was prepared by dissolving 2.86 g disodium hydrogen phosphate dihydrate and 0.208 g potassium dihydrogen phosphate in 1000 ml of water. The standards 2-thiouracil (the pharmacologically active form of thiouracil), 4-thiouracil, 5-methyl-2-thiouracil, 6-methyl-2-thiouracil, dimethyl-thiouracil, and S-methyl-thiouracil, were obtained from Sigma-Aldrich (the Netherlands). 2-thiouracil-13C15N2 and 6-methyl-2-thiouracil-13C15N2 were obtained from Syncom (Kadijk, Groningen, The Netherlands).
Quantitative analysis (targeted)
All chemicals, including standards and solutions, were of defined quality. Pure chemicals were of “pro analyse” quality. EDTA, DMSO, HCl 37%, ethyl acetate, 3-iodobenzylbromide (3-IBB), ethanol absolute were obtained from Sigma-Aldrich Chemie N.V. (Zwijndrecht, Netherland). Phosphate buffer 1 M pH 8 was prepared by dissolving 4.23 g potassium dihydrogen phosphate and 172.6 g sodium monohydrogen phosphate.2H2O in 1000 ml of water.
Sample clean-up
Discovery study (untargeted)
An aliquot of 100 µl of urine was spiked with 5 ng internal 2-thiouracil-13C15N2. 100 µl of 1% DTT in phosphate buffer pH 7.4 was added and applied onto the 96-wells SLE+ plate. After 5 minutes of absorption and stabilisation, the SLE+ material was eluted with 1 ml of ethyl acetate into a well containing 5 µl DMSO. The eluate was evaporated under a stream of nitrogen until only DMSO was left in the well. An aliquot of 40 µl of ULC grade water was added to dissolve the residue. Ten µl of this solution was injected onto the analytical column.
Quantitative confirmatory study (targeted)
One millilitre of urine was stabilised with 4 µl HCl 37% and 40 µl 0.25 M EDTA. A volume of 50 µl stabilised urine was spiked with 5 ng internal standard mixture (2-thiouracil-13C15N2 and 6-methyl-2-thiouracil-13C15N2) and 150 µl of phosphate buffer pH 8 added. The diluted sample was derivatised with 5 µl 3-IBB for 1 hour at 40 °C. After cooling to room temperature, the mixture was applied onto the 96-wells SLE+ plate. After 5 minutes of absorption and stabilisation, the SLE+ material was eluted with 1 ml of ethyl acetate into a well containing 5 µl of DMSO. The eluate was evaporated under a stream of nitrogen until only DMSO was left in the well. A volume of 50 µl 40:60 AcN:H2O was added to dissolve the residue. Two µl of this solution was injected onto the analytical column.
Instruments and consumables
UHPLC-hrMS discovery study (untargeted)
LC separation was performed on a 10 cm Acquity UHPLC HSS-T3 analytical column with 1.8 µm particles and 1 mm diameter (Waters, Etten-Leur, the Netherlands). Mobile phase A consisted of 5 % methanol in water/formic acid (0.1 %) and mobile phase B of 0.1 % formic acid (0.1 %) in methanol. The column temperature was 45 °C and the vial tray temperature was 20 °C, the flow rate was 0.15 ml/min, the injection volume was 10 µl. The following linear gradient was used: 0 min 100% A, 0.5 min 0% A, 5.0 min 25 % A, 5.1 min 5% A, 7.0 min 5% A and 7.1 min 100 % A. Mass-spectrometric analysis was carried out using a high-resolution quadrupole Q-Exactive Orbitrap mass spectrometer (Thermo, San Jose, USA), which was equipped with a heated electrospray ionisation source, operated in negative and positive mode. Auxiliary gas flow rate of 11 au, a sweep gas flow rate of 2 au, a capillary temperature of 256 °C, a heater temperature of 413 °C, a spray voltage of −2.5 kV, and an S-lens RF level of 50 au. Mass-resolution was 70,000 full width at half maximum (FWHM) and an AGC target of 1E6 ions. The m/z scan range was set from 50 to 850 Da. Instrumental control and data processing were carried out with Chromeleon Xpress and XCalibur 3.1 software (Thermo Fisher Scientific, San Jose, USA).
UHPLC-MS quantitative confirmatory study (targeted)
LC separation was performed on a 10 cm Acquity UHPLC BEH C18 (Waters, Etten-Leur, the Netherlands) analytical column with 1.7 µm particles and 2.1 mm diameter. Mobile phase A consisted of 5 % methanol in water/formic acid (0.1 %) and mobile phase B of formic acid (0.1 %) in methanol. The column temperature was 45 °C and the vial tray temperature was 20 °C, the flow rate was 0.15 ml/min, the injection volume was 10 µl. The following linear gradient was used: 0 min 100 % A, 0.5 min 0 % A, 5.0 min 25 % A, 5.1 min 5% A, 7.0 min 5 % A and 7.1 min 100 % A. Mass-spectrometric analysis was carried out using a TQS LC-MSMS mass spectrometer (Waters, Etten-Leur, the Netherlands). The MS system is operated in positive ion ionisation mode during analysis, and the capillary voltage was set at 3.2kV, with a cone gas flow of 150 litres per hour. The source temperature was 150 °C, and the desolvation temperature was 600°C. The flow of the desolvation gas was 800 litres per hour. The LM 1 Resolution was 3.0. The HM 1 and HM 2 Resolution was 15. Ion energy 1 was set to 0.4, ion energy 2 was set to 0.8. gives an overview of the measured transitions and collision energy for each compound. Dwell time was 0.02 sec. and cone voltage was 50 V for each compound.
Table 1. Overview of measured transitions and collision energies of measured compounds
Data processing
Discovery study (untargeted)
Metabolism research was performed with Compound Discoverer 2.1 (Thermo Fisher Scientific Inc.). The developed workflow is defined by different processing steps, called “nodes”. The developed workflow is reported in the supplementary information (Figure S1). In short, the workflow can be divided into five steps: 1: peak picking using criteria such as mass tolerance (5 ppm) and minimum peak intensity (100,000); 2: clustering of isotope and adduct masses of the same compound; 3: molecular formula assignment according to the accurate mass, adduct state and isotopes; 4: comparing the detected peaks with the in-silico generated phase I and II metabolites of thiouracil and assign structures to detected peaks; 5: differential analysis node which calculates the statistics for performing a differential analysis of the different groups, biomarker selection by use of an S-plot and box-plots.
Quantitative data processing (targeted)
LC-MS/MS data were automatically processed using MassLynx V4.1 software from Waters. All peak integrations were manually checked and baseline corrected if necessary. For correction of recovery losses during sample clean-up, the isotope-labelled internal standards were used.
Results and discussion
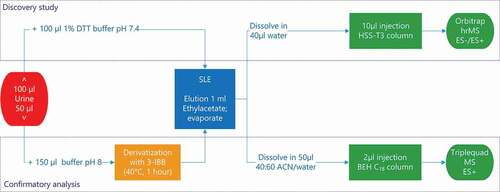
The method generally applied to analyse thyreostats involves the derivatisation of the analytes to increase the measurement sensitivity. For the discovery analysis, derivatisation is not an option, as also specific metabolites of the administered substances have to be identified. A new method, as described under material and methods utilising a generic non-specific sample clean-up based on solid-liquid extraction (SLE) has been developed for this particular purpose. Besides discovery analysis, thiouracil was also quantified in all samples with this method. Targeted quantification and confirmation was performed by the use of a triple quadrupole mass spectrometer. In a schematic overview of the whole workflow is given.
Figure 1. Schematic overview of the developed methods
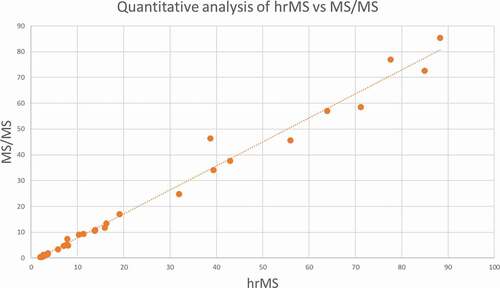
A random selection of samples from the animal experiment was analysed using both methods to cross-validate the two quantifying thiouracil methods. The quantitative results for thiouracil were compared. Some samples contained extremely high thiouracil concentrations, and these samples cannot be reliably compared due to the different dynamic linear range of the used mass-spectrometers. If the concentrations between 1 and 100 µg/L are compared, see , the quantification can be considered comparable. The limit of detection for both methods is comparable: 0.1 µg/L.
Figure 2. Comparison of the quantitative results (in µg/L) for thiouracil of the discovery (untargeted) method and the targeted method
Quantitative results of thiouracil in porcine and bovine
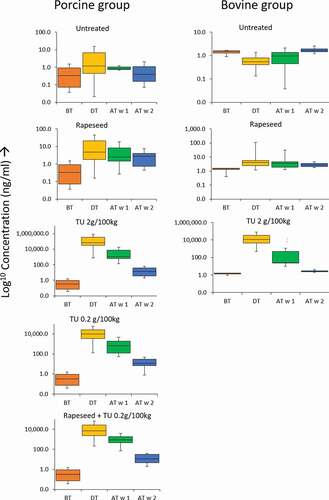
The animal experiment is divided into different treatment groups, and each of these groups can be divided into three periods: before treatment, during treatment, and after treatment. The after-treatment period is of relevance since abuse with thyreostats will, in general, occur just before slaughter, and animals will be slaughtered within one week after the last treatment. Therefore, it is essential to know the concentration of thiouracil during slaughter for the different treatment regimes. All the samples before treatment were combined with the control group, except the rapeseed groups’ samples. The rapeseed group was fed from the beginning with rapeseed because animals had to get used to eating rapeseed. In , the measured concentrations of thiouracil of all the treatment groups are given. Also shown, the treatment period is depicted using box-plots. For detailed information on the measured concentration and values used for the box-plots, see supplementary info Table S2.
Figure 3. Box-Whisker plots of the log concentration (µg/L) of thiouracil in bovine and porcine urine samples during the animal experiment for the different animal groups. The box limits are at the 25th and 75th percentiles; the band in the middle of the box is the median; the whiskers are the absolute maximum and minimum concentrations measured. TU = thiouracil, BT = before treatment, DT = during treatment, AT w 1 = first week after treatment, AT w 2 = second week after treatment
Concentrations of thiouracil in porcine urine
Control group
In the control group, the concentration of thiouracil before and after the treatment period was in the range of 0.1–1.6 µg/L. The presence of thiouracil in the control group was unexpected since the animals were fed with a Brassicaceae-free diet. The origin of these “background” levels in the control animals is unknown. However, this was also observed in a thiouracil treatment study for calves and cows performed by Wauters (Wauters et al. Citation2017). This study hypothesised that thiouracil’s origin in the control group could be from other feed ingredients from plants, which possibly also contained glucosinolate-like or chemical-related compounds, which could form thiouracil. During the other animals’ treatment period, there was an unexpected increase in the control group’s thiouracil concentration up to 18 µg/L. This increase was probably caused by contamination throughout the stables with thiouracil. Although the groups were physically separated, contamination can occur due to thiouracil contaminated feeding baskets previously used to feed animals with high thiouracil concentrations. However, based on the results obtained before and after the treatment period, it can be assumed that background concentrations in this study of thiouracil in porcine urine are within 0–2 µg/L.
Rapeseed group
The concentration of thiouracil during treatment was in the range of 1.8–21 µg/L (first quartile (25th percentile) and third quartile (75th percentile), and the highest concentration measured was 45 µg/L. The rapeseed group concentration was higher than the control group and often above the current threshold of 10 µg/L, assuming that the same threshold for bovines can be used for porcine. It should be noted that the measured concentrations during treatment in the rapeseed group could be influenced by stable contamination, as found in the control group. However, the concentrations after-treatment of the rapeseed group were much higher than the control group and can be considered trustworthy since there was no evidence of any contamination in the stables after the treatment period. After treatment, the concentrations decreased in the first week and a little further in the second week after treatment. In the first week after treatment, the maximum measured concentration was still higher than the threshold, up to 35.7 µg/L.
Thiouracil 0.2 and 2 g/100 kg treated group
The thiouracil treated groups’ concentrations were much higher than the control group, 136–1.000.000 µg/L. The concentrations of thiouracil were more elevated in the 2 g/100 kg group compared to the 0.2 g/100 kg group, but, even at the lower dose, the concentration of thiouracil in urine was very high. It is safe to conclude that concentrations will be much higher during treatment than the current 10 µg/L threshold as set for bovines. After treatment, in the first week, concentrations were between 35 and 4600 µg/L and during the second week between 0.8 and 47 µg/L. In the study of Wauters (Wauters et al. Citation2017), the first week after treatment showed a swift decline of thiouracil in bovines, even below 10 µg/L. This difference could be due to the metabolism of porcine, which is different from cows. Also, the thiouracil was differently administrated to the animals. In the presented study, thiouracil powder was mixed through the feed, and the animals could eat as much as they like. In the study of Wauters, thiouracil was administrated via capsules, which could influence the uptake and probably cause high spikes in the concentration levels of thiouracil instead of creating a constant background level of thiouracil. It should be noted that the highest concentration administrated in the study of Waters was 0.2 g/100 kg. In real life, it is expected that farmers will mix thiouracil through the feed instead of administering capsules of thiouracil each day for a week-long. Therefore, we believe that the outcome of the experiments in this study is closer to real-life practice.
Rapeseed + thiouracil 0.2 g/100 kg treated group
The concentration of thiouracil of the rapeseed + thiouracil 0.2 g/100 kg group has similar concentration levels as the 0.2 g/100 kg group. So during treatment, high concentrations of thiouracil appear far above the current threshold. There is no contribution to the concentration of the rapeseed enriched diet observed. During the first week after treatment, concentrations were between 74 and 9000 µg/L, comparable to the 0.2 g/100 kg group. There was no synergistic effect of rapeseed in combination with thiouracil observed. In the second week after treatment, the concentrations are between 1.9 and 30.9 µg/L.
Overall discussion on the porcine results
In general, animals will be slaughtered within one week after treatment. The concentration of thiouracil in animals treated at slaughter will be higher than the threshold of 10 µg/L as used for cows. When animals have rapeseed in their diet, concentrations will be above 10 µg/L and even sometimes above 30 µg/L. This high thiouracil concentration indicates that a cut-off value of 10 µg/L is too low for porcine and will result in an increased number of false positives when animals’ diet contains rapeseed. Therefore the threshold value for porcine can be safely set to 30 µg/L, as is advised with an earlier conducted survey study (Wauters, Vanden Bussche, Bizec, Kiebooms, Dervilly-Pinel, Prevost, Wozniak, Sterk, Gronningen, Kennedy, Russell, Delahaut and Vanhaecke Citation2015) whereby the threshold was determined on epidemiological data from thiouracil from porcine samples. obtained from different countries in the EU However, there will still be a small number of samples reported as false positives since animals eating rapeseed can have a concentration of thiouracil higher than 30 µg/L. Therefore, the addition of a biomarker, next to a threshold that indicates thiouracil abuse could help determine the origin of these rare cases and is described in the discovery of biomarkers paragraph.
Concentration of thiouracil in bovines
Untreated group
In the untreated bovine group, the urine concentrations of thiouracil were in the range of 0.1–2.6 µg/L. Compared to the porcine study, there was no contamination of the control animals during the treatment period noted.
Rapeseed group
The concentrations of thiouracil in bovine urine during the treatment period were between 1.2–113 µg/L. The concentration thiouracil was higher than for the control group and sometimes above the current 10 µg/L threshold. In the first week after treatment, the concentration was between 1.3 and 30.6 µg/L, for some samples above the l0 µg/L threshold. As proven in other studies (Pinel et al. Citation2006a, Citation2006b; Vanden Bussche et al. Citation2009, Citation2011a; Le Bizec et al. Citation2011; Wozniak et al. Citation2018) diet containing rapeseed will cause false positives results if the threshold value of 10 µg/L is used.
Thiouracil 2 g/100 kg treated group
The thiouracil treated group concentrations showed very high concentrations of thiouracil, 490–270000 µg/L in urine. Similar to the porcine study during treatment, far above the set threshold of 10 µg/L. Concentrations during the first week after treatment were between 9.4 and 9472 µg/L. There is a partial overlap in concentrations with the rapeseed group between 10–30 µg/L, so the origin of a thiouracil finding in this concentration range in real life can be due to rapeseed or thiouracil abuse. In the second week after treatment, concentrations drop below 10 µg/L. Concentrations of thiouracil declined rapidly after treatment, the concentrations of the first and third quartile are 22.4–465 µg/L, still far above the threshold of 10 µg/L.
Overall discussion on the bovine results
There is an overlap in thiouracil concentrations in the first week after treatment of animals that have rapeseed in their feed and animals treated with thiouracil when a threshold of 10 µg/L is used. This overlap between treated and naturally occurring thiouracil can result in several false-positive samples. A higher threshold of 30 µg/L will result in some false-negative results since thiouracil concentrations will decline rapidly in the first week after treatment, even below 30 µg/L. These results are in good agreement with the results obtained in a study of (Wauters et al. Citation2017). Therefore, it is recommended to set a threshold of 10 µg/L for thiouracil for bovine animals, but at the same time to implement a confirmatory procedure. The addition of a biomarker described in the ‘Discovery of biomarkers’ paragraph next to a threshold that indicates thiouracil abuse could be such an additional confirmatory step.
Discovery of biomarkers for thiouracil treatment for porcine and bovine
From previous studies, we know that the origin of the endogenous occurring thiouracil is from the gastrointestinal tract (Kiebooms et al. Citation2014), probably due to certain microbial organisms present. As suggested by van Meulenbroek[18], it can be safely assumed that the metabolites originating from exogenous thiouracil are formed in the liver. Differences in the origin of endogenous formed or exogenous administrated thiouracil might result in the difference of formed metabolites.
The urine samples from the porcine and bovine animal experiments were measured using the LC-hrMS discovery method. The obtained LC-hrMS data contained a large number of signals that mostly originated from small molecules present in samples of urine. To discover relevant biomarkers that indicate thiouracil treatment, the obtained data of more than 300 samples, excluding QA samples, were statistically analysed. The LC-hrMS data of the control group were statistically compared with the other groups. S-Plots were generated to identify the peaks that were up- or down-regulated within the groups. Consequently, these compounds were used to compare the control group to different treatments. The predicted metabolites are projected in the S-plot, see for an example of an S-plot Figure S2. The dots in the right corner represent up-regulated compounds, the dots in the left corner the down-regulated compounds. Compounds that could discriminate between the groups may be specific for treatment and considered as possible biomarkers for thiouracil treatment. The ten most up-regulated signals of each group were selected and further identified.
Identification of markers
Tentative identification analysis of the top 10 signals was done by carefully examining the measured exact mass, its isotope pattern and was linked to predicted metabolites. To be relevant, the identified compounds should also fit into a logical metabolic thiouracil pathway. For the identification, the software tool MZCloud was applied. MZCloud is part of the software package and uses spectral trees for structure identification. Based on the identification analysis and the strong structural relationship between the compounds, the metabolic pathway is elucidated for thiouracil, see ).
Figure 4. a) Proposed metabolic pathway of 2-thiouracil. b) Structure of 4-thiouracil
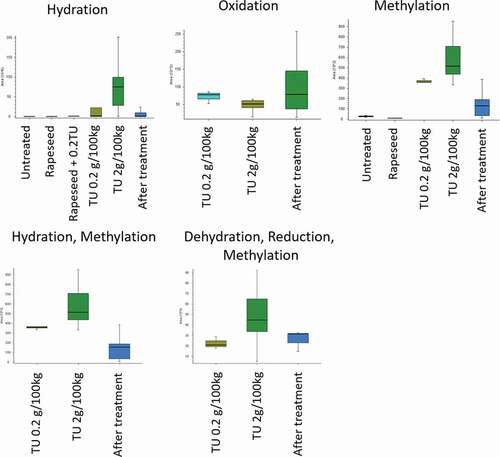
In , box-plots of the different metabolite intensities are shown for the variously identified metabolites clearly showing the differences in these metabolites concentrations and presence following the different treatments. They all have in common that there is an enormous increase in the metabolite signal after treatment with thiouracil. In this study, the focus was on the detection of in-silico generated metabolites. In the discovery study of van Meulenbroek the focus was on detecting all differences between the two groups. Therefore the outcome of both studies cannot directly be compared. However, the metabolites tentatively identified in the discovery study of van Meulenbroek (Van Meulebroek et al. Citation2018) showed overlap with some of the minor metabolites identified in this study.
Figure 5. Box-Whisker plots show the intensity of the different treatment groups and the identified metabolic markers; the box limits are at the 25th and 75th percentiles. The band in the middle of the box is the median; the whiskers are the absolute maximum and minimum concentrations measured
For the most abundant tentatively identified metabolites, reference standards were purchased for confirmatory analysis. The following reference standards were obtained, 2-thiouracil (thiouracil), 4-thiouracil, 5-methyl-2-thiouracil, 6-methyl-2-thiouracil (methylthiouracil), dimethyl-thiouracil, and S-methyl-thiouracil. The detected peaks and mass spectra of the purchased reference standards were compared with the identified compounds in the urine samples. Only dimethyl-thiouracil was subsequently identified incorrectly in the discovery part of this study. The corresponding reference standards confirmed the other identified compounds, e.g. 2-thiouracil (thiouracil), 4-thiouracil, 5-methyl-2-thiouracil, 6-methyl-2-thiouracil (methylthiouracil), and S-methyl-thiouracil. All compounds were confirmed for bovine and porcine urine samples.
Analysis of samples from the bovine animal experiment and routine monitoring programmes using the confirmatory method
To enhance the sensitivity and specificity of the identified metabolites, the samples were derivatised with 3-iodobenzylbromide. The chromatographic separation was also optimised to separate all metabolites. The detection was performed by triple quadrupole mass spectrometry in product scan mode to obtain the highest specificity possible. From each treatment group, eight bovine samples were re-analysed using the confirmatory method, including the metabolites. For verification of the metabolites found in the discovery study, samples (n = 52) found positive for thiouracil in routine control monitoring programmes were selected and re-analysed using the confirmatory method. These samples originate from different farms in the Netherlands. If a result for thiouracil exceeded the threshold of 10 µg/L, a follow-up action was conducted (for example, go back to the farm to check the feed the animals were given) to determine whether thiouracil’s origin was endogenous or from abuse. For all these samples the origin of thiouracil after follow-up was considered to be endogenous. In an overview of the average concentration of the analysed compounds in the different groups is given.
Table 2. Average concentration (µg/L) and 95% confidence interval of thiouracil and metabolites from a selection of bovine samples in the different treatment groups and samples found positive for thiouracil in routine control monitoring programmes
From it is concluded that the presence of S-methyl-thiouracil and 5-methyl-thiouracil is confirmed in most of the samples from the routine monitoring plans. Therefore, these metabolites are considered non-specific for thiouracil treatment since these samples originate from animals that were not treated with thiouracil. Based on the homogeneity of de quantitative results for this selection, this would otherwise mean that all samples were obtained from treated animals. Therefore, these markers’ origin is probably endogenous as well, although they were not identified in the control group or the rapeseed group during the animal experiment. Probably, because the animal study consisted of a small number of animals, and the animals were fed using a Brassica-free diet or containing only rapeseed. In real life, animals and diet will be more diverse. The remaining marker, 6-methyl-thiouracil, is not detected in these samples. Therefore, 6-methyl-thiouracil is considered specific for thiouracil treatment as it is present in samples from the thiouracil group in the conducted animal study. In routine control programmes, methylthiouracil is monitored, which is the same compound as 6-methyl-thiouracil. As far as we know, no positive cases were reported for 6-methylthiouracil in the last ten years. This indicates that 6-methylthiouracil is a specific biomarker for thiouracil treatment and, of course, for methylthiouracil treatment.
From , it is also concluded that thiouracil (2-thiouracil) is present in all samples. The metabolite 4-thiouracil is found in low concentrations during the animal experiment in all groups but was found at high concentrations in the samples from the routine control monitoring programmes. The presence of 4-thiouracil seems to correlate with 2-thiouracil, and the concentration seems not to be influenced by treatment with thiouracil during the animal study. Also, when the structure (see )) of 4-thiouracil of both compounds is examined, it can be concluded that 4-thiouracil is not a metabolite from 2-thiouracil. This suggests that the concentration and structure are not correlated with thiouracil treatment but to thiouracil’s presence from natural formation. In that case, it can be hypothesised that the origin of 2- and 4-thiouracil is similar and lies in the gastrointestinal tract in combination with feed containing Brassica.
For the moment, it is therefore concluded that if both 2-thiouracil and 4-thiouracil are found in urine above 10 µg/L in porcine and 2-TU above 30 µg/L and 4-TU above 10 µg/L in bovine, thiouracil origin is endogenous. If 2-thiouracil alone is found above 10 µg/L in porcine and above 30 µg/L in bovine combined with 6-methylthiouracil, its origin is exogenous and caused by administration of 2-thiouracil. It has to be kept in mind that the Recommended Concentration (RC) in the CRL Guidance 2007 document is set at 10 µg/L also for methylthiouracil. For 6-methyl-thiouracil, this (RC) must be set lower to prevent false compliant results in the future.
Conclusion
This study’s overall conclusion is that the threshold of thiouracil should be increased to 30 µg/L in porcine urine, as suggested in previous studies and that 4-thiouracil and 6-methyl-thiouracil should be included in routine control monitoring programmes. A combination of these biomarkers and a raised threshold of 30 µg/L in porcine will result in fewer false-positive samples during routine monitoring of urine samples from animal origin. However, in bovine, a small number of samples will remain, which will be reported as false negative for bovines. In these animals, the concentration of thiouracil drops very rapidly in the first week after treatment. Therefore the threshold for bovine should stay at the original level of 10 µg/L. However, all positive samples above this threshold should be checked for the presence of 6-methyl-thiouracil and 4-thiouracil. In the absence of 6-methyl-thiouracil and the presence of 4-thiouracil, it can be concluded that thiouracil is not coming from illegal treatment. See Figure S3 for the proposed strategy for bovine and porcine to detect thiouracil abuse. However, to be sure that the use of the biomarkers combined with a threshold value is reliable, more positive thiouracil samples from routine monitoring programmes should be analysed from porcine and bovine animals using the specific confirmatory method as described in this study for the biomarkers.
Compliance with Ethical Standards
All procedures involving animals were conducted in accordance with Dutch law on experimental animals and were performed following ethical approval by the Wageningen University Animal Experimental Committee (Dier Experimenten Commissie).
Supplemental Material
Download MS Word (2.2 MB)Acknowledgments
We kindly thank the Wageningen University and Research Facility Carus for performing the animal study. We would also like to thank Ducares for providing samples containing endogenous thiouracil.
Disclosure statement
No potential conflict of interest was reported by the author(s).
Supplementary material
Supplemental data for this article can be accessed on the publisher’s website.
Additional information
Funding
References
- Beeson WM, Andrews FN, Brown PT. 1947. The effect of thiouracil on the growth and fattening of yearling steers. J Anim Sci. 6(1):16–23. doi:https://doi.org/10.2527/jas1947.6116.
- Bizec B, Bichon E, Deceuninck Y, Prévost S, Monteau F, Antignac J, Dervilly-Pinel G. 2012. Comprehensive overview of the natural occurrence of thiouracil in livestock animals-toward the definition of a criterion to suspect its administration.[Conference poster]. Proceedings of the Residues of veterinary drugs in food Proceedings of the EuroResidue VII Conference, Egmond aan Zee; The Netherlands
- Blanchflower JW, Hughes PJ, Cannavan A, McCoy MA, Glenn Kennedy D. 1997. Determination of thyreostats in thyroid and urine using high-performance liquid chromatography–atmospheric pressure chemical ionisation mass spectrometry. Analyst. 122(9):967–972. doi:https://doi.org/10.1039/a700829e.
- [CRL] Community Reference Laboratories. 2007. CRL Guidance Paper. CRLs view on state of the art analytical methods for national residue control plans, community reference laboratories for Residues According to Council Directive 96/23/EC. 1–8.
- European Commission. 1996. Council Directive 96/23/EC of 29 April. On measures to monitor certain substances and residues thereof in live animals and animal products and repealing Directives 85/358/EEC and 86/469/EEC and Decisions 89/187/EEC and 91/664/EEC.1996. OJ EC L. 125:10–31.
- European Community. 1981. Council directive 81/602/EC. Off J Eur Commun L. 222:32–33.
- [IARC Working Group] International Agency for Research on Cancer Working Group on the Evaluation of Carcinogenic Risks to Humans. 2001. Group on the evaluation of carcinogenic risks to humans: Some thyrotropic agents. France: IARCPress.
- Kennedy T, Purves H. 1941. Studies on experimental goitre. I: the effect of Brassica seed diets on rats. Br J Exp Pathol. 22:241.
- Kiebooms JA, Wauters J, Vanden Bussche J, Houf K, De Vos P, Van Trappen S, Cleenwerck I, Vanhaecke L. 2014. Thiouracil-forming bacteria identified and characterized upon porcine in vitro digestion of brassicaceae feed. Appl Environ Microbiol. 80(23):7433–7442. doi:https://doi.org/10.1128/AEM.02370-14.
- Le Bizec B, Bichon E, Deceuninck Y, Prevost S, Monteau F, Antignac JP, Dervilly-Pinel G. 2011. Toward a criterion for suspect thiouracil administration in animal husbandry. Food Addit Contam Part A Chem Anal Control Expo Risk Assess. 28(7):840–847. doi:https://doi.org/10.1080/19440049.2011.565483.
- Pinel G, Bichon E, Pouponneau K, Maume D, Andre F, Le Bizec B. 2005. Multi-residue method for the determination of thyreostats in urine samples using liquid chromatography coupled to tandem mass spectrometry after derivatisation with 3-iodobenzylbromide. J Chromatogr A. 1085(2):247–252. doi:https://doi.org/10.1016/j.chroma.2005.06.055.
- Pinel G, Mathieu S, Cesbron N, Maume D, De Brabander HF, Andre F, Le Bizec B. 2006a. Evidence that urinary excretion of thiouracil in adult bovine submitted to a cruciferous diet can give erroneous indications of the possible illegal use of thyrostats in meat production. Food Addit Contam. 23(10):974–980. doi:https://doi.org/10.1080/02652030600806370.
- Pinel G, Maume D, Deceuninck Y, Andre F, Le Bizec B. 2006b. Unambiguous identification of thiouracil residue in urine collected in non-treated bovine by tandem and high-resolution mass spectrometry. Rapid Commun Mass Spectrom. 20(21):3183–3187. doi:https://doi.org/10.1002/rcm.2711.
- Sterk S, Blokland M, De Rijke E, Van Ginkel L. 2014. EURL reflection paper: natural growth promoting substances in biological samples. RIKILT Wageningen UR.
- Van Meulebroek L, Wauters J, Pomian B, Vanden Bussche J, Delahaut P, Fichant E, Vanhaecke L. 2018. Discovery of urinary biomarkers to discriminate between exogenous and semi-endogenous thiouracil in cattle: a parallel-like randomized design. PLoS One. 13(4):e0195351. doi:https://doi.org/10.1371/journal.pone.0195351.
- Vanden Bussche J, Kiebooms JA, De Clercq N, Deceuninck Y, Le Bizec B, De Brabander HF, Vanhaecke L. 2011a. Feed or food responsible for the presence of low-level thiouracil in urine of livestock and humans? J Agric Food Chem. 59(10):5786–5792. doi:https://doi.org/10.1021/jf200556x.
- Vanden Bussche J, Noppe H, Verheyden K, Wille K, Pinel G, Le Bizec B, De Brabander HF. 2009. Analysis of thyreostats: a history of 35 years. Anal Chim Acta. 637(1–2):2–12. doi:https://doi.org/10.1016/j.aca.2008.08.027.
- Vanden Bussche J, Vanhaecke L, Deceuninck Y, Wille K, Bekaert K, Le Bizec B, De Brabander HF. 2011b. Ultra-high performance liquid chromatography coupled to triple quadrupole mass spectrometry detection of naturally occurring thiouracil in urine of untreated livestock, domesticated animals and humans. Food Addit Contam Part A Chem Anal Control Expo Risk Assess. 28(2):166–172. doi:https://doi.org/10.1080/19440049.2010.544681.
- Wauters J, Van Meulebroek L, Fichant E, Delahaut P, Vanhaecke L. 2017. Discrimination between Synthetically Administered and Endogenous Thiouracil Based on Monitoring of Urine, Muscle, and Thyroid Tissue: an in Vivo Study in Young and Adult Bovines. J Agr Food Chem. 65(30):6231–6239. doi:https://doi.org/10.1021/acs.jafc.7b01920.
- Wauters J, Vanden Bussche J, Bizec BL, Kiebooms JA, Dervilly-Pinel G, Prevost S, Wozniak B, Sterk SS, Gronningen D, Kennedy DG, et al. 2015. Toward a new European threshold to discriminate illegally administered from naturally occurring thiouracil in livestock. J Agric Food Chem. 63(5):1339–1346. doi:https://doi.org/10.1021/jf504475f.
- Wozniak B, Matraszek-Zuchowska I, Witek S, Zmudzki J, Posyniak A. 2018. The effect of diet enriched with rapeseed meal on endogenous thiouracil contents in urine and milk of cattle. Food Addit Contam Part A Chem Anal Control Expo Risk Assess. 35(5):892–899. doi:https://doi.org/10.1080/19440049.2017.1416181.
- Wozniak B, Witek S, Zmudzki J, Klopot A. 2012. Natural Occurrence of Thiouracil in Urine of Livestock in Poland. B Vet I Pulawy. 56(4):611–615. doi:https://doi.org/10.2478/v10213-012-0108-z.