
 ?Mathematical formulae have been encoded as MathML and are displayed in this HTML version using MathJax in order to improve their display. Uncheck the box to turn MathJax off. This feature requires Javascript. Click on a formula to zoom.
ABSTRACT
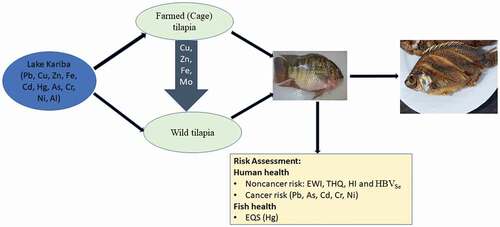
The aim of this study was to assess the levels of heavy metals in both wild and farmed tilapia on Lake Kariba in Zambia and to evaluate the impact of intensive fish farming on wild tilapia. Three sites for wild fish (2 distant and 1 proximal to fish farms) and two fish farms were selected. One hundred fish (52 from distant sites; 20 near fish farms; 28 farmed fish) were sampled and muscle tissues excised for analysis of heavy metals (Mg, Fe, Zn, Al, Cu, Se, Co, Mo, As, Cr, V, Ni, Hg, Pb, Li, Cd, and Ag) by acid (HNO3) digestion and ICP-MS. All metals were found to be below the maximum limits (MLs) set by WHO/EU. Essential metals were higher in farmed tilapia, whereas non-essential metals were higher in wild tilapia. Significantly higher levels of essential metals were found in wild fish near the fish farms than those distant from the farms. Estimated weekly intake (EWI) for all metals were less than the provisional tolerable weekly intakes (PTWI). Target hazard quotients (THQ) and Hazard Indices (HI) were <1, indicating no health risks from a lifetime of fish consumption. Selenium Health Benefit Value (HBVSe) was positive for all locations, indicating protective effects of selenium against mercury in fish. Total cancer risk (CR) due to As, Cr, Cd, Ni and Pb was less than 1 × 10⁻⁴, indicating less than 1 in 10,000 carcinogenic risk from a lifetime consumption of tilapia from Lake Kariba. Hg levels (0.021 mg/kg) in wild tilapia at site 1 were higher than the Environmental quality standard (EQS = 0.020 mg/kg) set by EU, indicating possible risk of adverse effects to fish. Except for Hg, levels of metals in fish were safe for human consumption and had no adverse effects on fish.
Graphical abstract
Introduction
Aquaculture is a fast-growing sector that contributes significantly to food security, provides an important source of high-quality protein and omega 3 fatty acids and leads to economic development. In 2018, the FAO (Citation2020) estimated the global human consumption of fish to be 156 million tonnes. By 2005, one-quarter of wild fish stocks were underexploited, half fully exploited and the rest had been overexploited or depleted (FAO Citation2007). The decline in wild fish stocks contributes to the need for a growing aquaculture sector for protection of food security. Since 1970, world aquaculture has grown by an average of 7.5% per year (FAO Citation2020). The fastest growth has been in Africa and Asia, which have recorded double-digit growth in the past 20 years (FAO Citation2018, Citation2020). In 2018, total fish production from both fisheries and aquaculture reached 179 million tonnes (FAO Citation2020), and aquaculture contributed 46% (82 million tonnes) of the total production (FAO Citation2020). Apart from being a source of protein, essential fatty acids, minerals and vitamins (Béné et al. Citation2015; Chan et al. Citation2019; Vicente-Zurdo et al. Citation2019), fish also serve as a source of income for people in developing countries (Béné et al. Citation2015; FAO Citation2018). In 2018, the FAO (Citation2020) estimated World fish trade at about USD 400 billion, with USD 250 billion coming from aquaculture production. Africa currently contributes about 7% to the total global fish production (FAO Citation2020), with Egypt being the largest producer of farmed fish on the African continent (Mohamed Shaalan et al. Citation2018). In 2014, Zambia was the sixth-largest producer of farmed fish on the continent and the biggest producer of tilapia in the Southern African Development Community (SADC) (Genschick et al. Citation2017). Zambian aquaculture produced 20,000 tonnes of fish in 2014, with commercial farms contributing 75% (FAO Citation2016; Genschick et al. Citation2017).
Despite the many positives recorded from the growth in aquaculture, it may also have negative impacts on the environment. Some of these are release of organic effluents or chemicals and antibiotics (from medical treatments) into waterbodies and being a source of diseases or genetic contamination of wild species (Berg et al. Citation1992; Kishimba et al. Citation2004; Subasinghe Citation2005; Jarić et al. Citation2011; Li et al. Citation2011; Nonga et al. Citation2011; Polder et al. Citation2014; Ssebugere et al. Citation2014; Mwakalapa. et al. Citation2018). The current aquaculture practices can lead to elevated levels of antibiotic residues, antibiotic-resistant bacteria, persistent organic pollutants, metals, parasites, and viruses in natural waters and fish (Sapkota et al. Citation2008; Basaran et al. Citation2010). Increased pollution with organic (persistent organic pollutants) and inorganic (heavy metals) contaminants can affect fish and human health (Vos et al. Citation2000; Watterson. et al. Citation2008).
Heavy metals are naturally occurring elements in the earth’s crust. They have a relatively high density (at least 5 times) compared to water (Tchounwou et al. Citation2012). Heavy metal pollution occurs when the metals exceed the naturally occurring levels in the environment or are at levels that affect human and animal health (Nazir et al. Citation2015). Pollution can be due to natural processes such as erosion and volcanic eruption, or anthropogenic activities (Adriano Citation2001; Mansour and Sidky Citation2002; Nazir et al. Citation2015) such as mining, industry, improper waste management, etc. (Adriano Citation2001; Xiao et al. Citation2014; Maurya et al. Citation2019). Essential metals (Mg, Fe, Zn, Cu, Se, Co, Mo, Cr, and Ni) are required for normal biological functions in humans and animals but can be harmful when levels exceed threshold levels for toxicity (Waseem et al. Citation2014; Javed and Usmani Citation2017; Marengo et al. Citation2018). Non-essential metals (Al, As, V, Hg, Pb, Li, Cd, and Ag) have no known biological functions and can be toxic even in small amounts (Tchounwou et al. Citation2012; Waseem et al. Citation2014). They have the potential to disrupt normal biological functions such as endocrine signalling and enzyme activity, which may lead to adverse health effects in both humans and fish (Tchounwou et al. Citation2012; Javed and Usmani Citation2017; Arisekar et al. Citation2020). Freshwater pollution with accumulation of environmental toxicants in aquatic organisms is a global issue (Amundsen et al. Citation1997; Copaja et al. Citation2017; Marengo et al. Citation2018; Mwakalapa et al. Citation2019; Nakayama et al. Citation2013; Zhang et al. Citation2016). Therefore, monitoring of potentially toxic metals in fish is important for both environmental and public health (Maurya et al. Citation2019; Mwakalapa et al. Citation2019). Fish are among the most frequently used bioindicators of pollution in aquatic ecosystems (Stankovic et al. Citation2014) and provide data on bioaccumulation of heavy metals in wild and farmed fish. These data are needed for knowing the contamination status of waterbodies and for assessment of the health risk to aquatic organisms and humans. Limited scientific data are available on bioaccumulation of metals in wild and farmed fish from Zambia as well as sub-Saharan Africa. Furthermore, risk assessment for heavy metals through consumption of farmed and wild freshwater fish from Zambia has not been reported.
In Zambia and the rest of Africa, aquaculture is practiced in fishponds, tanks and in cages on lakes. Lake Kariba on the Zambia–Zimbabwe border is one location where farming of Oreochromis niloticus (Nile tilapia) in cages is practiced on an intensive scale. The aims of this study were to (1) assess and compare the levels of heavy metals in both wild and farmed tilapia, (2) evaluate the impact of intensive fish farming on wild tilapia near the farms and (3) compare the results with existing maximum residue levels and threshold values set for humans and fish health.
Materials and methods
Description of sampling area and species
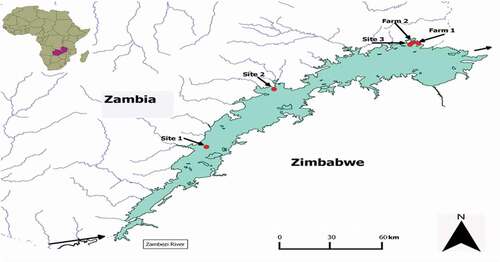
Lake Kariba is a man-made lake located on the southern border of Zambia with Zimbabwe (−17° S 28° E). It was built between 1958 and 1963 for the purpose of hydroelectric generation. The lake is 320 km long with an area of 5400 km2, and an average depth of 29 m. The lake controls about 90% of the Zambezi river runoff, and water flows from west to east. The climate is sub-tropical with annual rainfall between 400 and 700 mm and temperature between 13°C and 40°C. Fish (O. niloticus) were collected from five locations (sites 1–3, and farms 1 and 2) along the lake (). Sites 1 and 2 are in Sinazongwe and Gweembe districts, respectively, over 100 km from site 3. The human populations in sites 1 and 2 are 98,246 and 50,136, respectively (Zambia Central Statistical Office Citation2012). Site 3 is in Siavonga district, on the eastern end of the lake and has a population of 58,864. Farms 1 and 2 are also located in Siavonga district and use cages for farming tilapia in the lake. O. niloticus is an omnivorous fish native to river Nile, with a worldwide distribution (FAO, Citation2005). It feeds on zooplankton and phytoplankton and higher plants (like algae). The fish thrives in tropical and subtropical climates with environmental temperatures of 9–42°C, living in shallow waters. It is found both as wild and farmed fish. Its fast growth and resistance to harsh conditions makes it favourable for aquaculture. Other activities on and around the lake are commercial fishing of kapenta (Limnothrissa miodon), farming, livestock, and wildlife managing. In addition, active coal mining is taking place at site 1. Site 3 also has a feed processing plant.
Figure 1. Map of Lake Kariba showing the 5 locations (sites 1–3 and farms 1 and 2) where tilapia was collected on the Zambian side. (Courtesy of Eliezer Brown Mwakalapa 2019).
Ethical consideration and permission for the study
The study proposal was approved by the University of Zambia, School of Veterinary Medicine research committee. Wild tilapia was bought from fishermen. Permission from local district fisheries and veterinary officers was obtained before sampling in their areas. Managers at the fish farms gave their permission for samples to be collected from their farms.
Sample collection
A total of 172 wild and farmed tilapia were collected from June to July 2016. Live wild tilapia was bought from fishermen, placed in ice water and dissected back at the shore. Dip netting was used to catch farmed tilapia then dissected at the shore. Fish length and weight were recorded (). The scale used in the field could only weigh fish up to 1 kg, fish beyond this were assigned 1 kg. Therefore, only length was used for statistics. Stainless-steel forceps and scalpel blades were used to dissected muscle tissue of approximately 10 g. The tissue was placed in clean 15-ml Eppendorf tubes, then transported on ice in a cooler box to the University of Zambia, Veterinary Medicine School and stored at −20°C. Later, samples were transported on ice to the Laboratory of Environment Toxicology at the Norwegian University of Life Science (NMBU) in Oslo, Norway, and stored at −20°C until analysis. Permission to transport samples to Norway was obtained from the Ministry of Livestock and Fisheries, Zambia, and Norwegian Food Safety Authority.
Table 1. Location and fish characteristics: Sampling time, mean and range of individual length and number of pooled muscle samples from farmed (farms 1 and 2) and wild tilapia distant (sites 1 and 2) and near farms (site 3) from Lake Kariba. Zambia
Sample analysis
After selection of fish based on similar weight/length from each location, 100 muscle samples were pooled in equal amounts as shown in . Heavy metal analysis was done at the Laboratory for Soil and Water analysis, Faculty of Environmental Sciences and Natural Resource Management (MINA), Norwegian University of Life Sciences (NMBU), Campus Ås, Norway.
Extraction and analysis of heavy metals
The following heavy metals were analysed: Mg, Fe, Zn, Al, Cu, Se, Co, Mo, As, Cr, V, Ni, Hg, Pb, Li, Cd, and Ag. Approximately 200 mg of muscle samples were weighed in ultrapure Teflon tubes (pre-rinsed in 7 M nitric acid (HNO3) and in Milli-Q water®). Internal standard (74Se, In) and 5 mL Ultrapure HNO3 were added. The mixture was digested at 260°C in an UltraCLAVE (Milestone S.r.L, Sorisole (BG) – Italy). After digestion, 1 mL of UltraPure concentrated HCl was added (to prevent loss of Hg) and then diluted to 50 mL with distilled water. The samples were analysed using an Agilent 8800 ICP-MS.
Quality control and quality assurance
Method accuracy was verified by analysing certified reference materials in the same way, at the same time as the sample series. Fish Protein Certified Reference Material for Trace Metals (CRM Dorm-3, National Research Council Canada, Institute for National Measurement Standards, M-12, Ottawa, ON K1A 0R6, Canada) and fish muscle (ERM-BB422, European Commission – Joint Research Centre, Institute for Reference Materials and Measurements (IRMM), 2440 Geel, Belgium) were used. The quantified values show good agreement with the certified values. LOD and LOQ were quantified from 3 to 10 times STDEV in the method blanks, n = 6. The mean of LOD and LOQ were calculated using average of the sample weights in a 50 ml dilution.
Human and fish health risk assessment
The mean metal concentrations in fish muscle (mg/kg ww) were compared to maximum limits (ML) set by WHO and EU (FAO/WHO Citation2002; EC EC Citation2006) for human consumption. Noncarcinogenic risks, estimated weekly intake (EWI), target hazard quotient (THQ) and hazard index (HI) were calculated as described by Mwakalapa et al. (Citation2019), using formulas (1)–(3). EWIs were compared to provisional tolerable weekly intakes (PTWI) set by WHO. Target hazard quotient is the ratio between the estimated daily intake (EDI) and the oral reference dose (RfD, mg/kg bw/day) (Saha et al. Citation2016; USEPA Citation2018). RfD is an estimate of a daily oral exposure to a toxic substance that is likely to be without an appreciable risk of harmful effects during a lifetime (Varol et al. Citation2017; Mwakalapa et al. Citation2019). The HI also referred to total target hazard quotient (TTHQ), which is the sum of individual metal THQs. Values of THQ and HI >1 pose a risk of developing non-carcinogenic effects in one’s lifetime (Saha et al. Citation2016; Copat et al. Citation2018). Selenium health benefit Values (HBVSe) for all site were calculated as described by Ralston (Ralston et al. Citation2016), using formula (4). A positive HBVSe indicates protective effects of selenium against mercury in the fish, while a negative value indicates that mercury poses a threat to human health (Ralston et al. Citation2019; Yabanli and Tay Citation2021). The daily average fish ingestion per person (fish ingestion rate) is 30.14 g/day (Kaminski et al. Citation2018; Tran et al. Citation2019), life expectancy (exposure duration) of 64 years, exposure frequency to heavy metals of 365 days/year, and average body weight of an adult 70 kg were used in the calculations.
where MC = mean metal concentration, IRD = daily average fish ingestion per person, and BW = average adult body weight.
where EF = Exposure frequency, ED = exposure duration, FIR = fish ingestion rate, C = mean metal concentration, RfD = oral reference dose, WBA = average body weight of an adult and TA = average exposure time with noncarcinogenic effect (EF*ED).
The carcinogenic risk/cancer risks (CR) due to lifetime exposure to arsenic, chromium, cadmium, nickel and lead were calculated as described by (Saha et al. Citation2016), using formula (5). The total cancer risk (TCR) due to fish consumption from the lake, was calculated as the sum of the individual cancer risks (Bamuwamye et al. Citation2015), using formula (6). Carcinogenic risks (CR) are estimated as the incremental probability of an individual to develop cancer, over a lifetime, as a result of exposure to a potential carcinogen (Ahmed et al. Citation2016). According to USEPA (Citation2018), acceptable lifetime cancer risk levels range from 10−4 (1 in 10,000) to 10−6 (1 in 1,000,000) chance of an individual developing cancer (Varol et al. Citation2017). Cancer risk values greater than 10−4 are unacceptable and those less than 10−6 indicate a negligible risk of cancer in an individual’s lifetime. Cancer slope factors (CSF) (mg/kg/day)−1 1.5 (As), 6.3 (Cd), 0.5 (Cr), 1.7 (Ni) and 0.0085 (Pb) from the Integrated Risk Information System USEPA (Citation2018) database were used in the calculation of CR (Raknuzzaman et al. Citation2016).
where CSF = Cancer slope factor, EDI = Estimated daily intake (EWI/7).
Risk to fish health was assessed using Environmental Quality Standards (EQS) set by EU (Ec Citation2006). EQS are concentrations of a particular pollutant or group of pollutants in water, sediment or biota that should not be exceeded in order to protect humans, aquatic species (fish) and the environment (EC EC Citation2006; Lyche et al. Citation2019).
Statistical analysis
Data was organised in MS Excel 2016 spread sheets. JMP 14 statistical software was used for further analysis. Readings below the limit of detection (<LOD) were assigned a value of half the LOD. Since the data were not normally distributed, non-parametric tests Wilcoxon/Kruskal–Wallis test (rank sum) for differences among locations and Wilcoxon pair test for differences between locations were used. Spearman rank correlation was used to assess the correlation between variables; p <.05 values were considered significant.
Results
Concentration of heavy metals in muscle
Fish biometric data is presented in . Wild tilapia from sites 1 and 2 had significantly greater total length (p < .01) than those from site 3 and farmed tilapia. Descriptive statistics (mean, median, minimum and maximum) are shown in . Concentration of heavy metals in fish muscle in descending order was as follows: Mg >Fe >Zn >Al >Cu >Se >Co >Mo >As >Cr >V > Ni >Hg >Pb >Li >Cd >Ag. Except for Pb, all other metals were present in all samples.
Table 2. Descriptive statistics of heavy metal concentrations in muscles of wild and farmed tilapia (mg/kg ww) and maximum limits (ML) set by WHO/FAO, EU, FDA
Essential metals
Essential metals (Cu, Fe, Zn and Mo) were higher in farmed and the wild tilapia sampled near the fish farms (site 3) compared to wild fish sampled at locations away from the farms, sites 1 and 2 (). The highest levels of Fe were in farmed fish farm 1 (9.38 mg/kg) and wild fish sampled at site 3 (8.16 mg/kg). Fe levels in fish from these locations were significantly higher (p < .05) than in fish sampled from sites 1 and 2. Likewise, Zn levels in farmed fish and wild fish from site 3 were significantly higher (p < .01) than in wild fish from sites 1 and 2. The highest Zn level was at site 3 (8.49 mg/kg) and lowest at site 2 (4.75 mg/kg). Cu levels in farmed and wild fish from site 3 were also significantly higher (p < .01) than wild fish from sites 1 and 2. The highest Cu level was at farm 2 (3.5 mg/kg) and the lowest at site 1 (0.25 mg/kg). Se in wild fish from site 3 (0.14 mg/kg) had significantly lower (p < .05) levels than those from sites 1, 2 and farm 1. The highest Se level 0.178 mg/kg was in farm 1. The highest Co level was at farm 1 (0.07 mg/kg) and lowest at site 1 (0.03 mg/kg). The Co levels in fish from farm 1 were significantly higher (p < .01) than wild fish from sites 1 and 2. Mo levels in farmed and wild fish from site 3 were significantly higher (p < .01) than wild fish from sites 1 and 2. Highest Mo level was at farm 1 (0.06 mg/kg) and lowest at site 1 (<0.01 mg/kg). Cr and Mg showed no significant difference among all locations.
Figure 2. Concentration of heavy metals (Cu, Fe, Zn, Ni, Mo, Al and Cd) in muscle tissue of farmed and wild tilapia from Lake Karbia. Site with the same letter (a,b,c,d, or e) showed no significant difference in metal concentration at ** p < .01 and * p < .05.
Non-essential metals
Non-essential metals (Al, Ag, Ni and Cd) were higher in wild tilapia at sites 1 and 2 (). Al was significantly higher in wild fish from sites 1 and 2 than farmed and wild fish from site 3. The highest level of Al was at site 1 (4.81 mg/kg) and lowest at farm 1 (0.78 mg/kg). As levels in wild fish from site 2 and farm 1 (site 3) were significantly higher than wild fish from sites 1 and 3. The highest As level was at farm 1 (0.04 mg/kg). V levels at sites 1, 2 and farm 1 (site 3) were significantly higher (p < .01) than other locations, with the highest level at site 2 (0.0476 mg/kg). Ni level at sites 1 and 2 was significantly higher than farmed and wild fish from site 3. The highest level was at site 2 (0.0186 mg/kg). Hg levels in wild fish (all sites) were significantly higher (p < .05) than farmed fish (site 3). The highest Hg level was at site 1 (0.021 mg/kg). The level of Pb in wild fish from site 3 was significantly lower (p < .01) than sites 1,2 and farm 1, with the highest level at site 2 (0.00925 mg/kg). Site 3 had significantly higher levels (p < .01) of Li than sites 1, 2 and farm 1, with the highest level of 0.00933 mg/kg. Cd levels at farm 2 were significantly lower (p < .05) than the other locations. Ag levels at sites 1 and 2 were higher (p < .01) than fish from sites 3 and farm 2. The highest level was at site 2 (0.00155 mg/kg).
Correlation among metals and fish length
Fish length had a significant positive correlation (Spearman’s correlation) with Ni and Al, but significant negative correlation with Cu, Fe, Zn, Co and Mo. Significant positive correlation was also found for Fe, Cu, Zn, Co and Mo. Al had significant positive correlation with Cd, Ag, Hg and Ni. Al, Cd and Ni had significant negative correlation with Zn, Cu and Mo.
Risk assessment
Human health
Compared to maximum limits set by WHO/FA0, EU and FDA, all the measured metals in fish muscle were below these limits (). EWIs of all analysed muscles were also below the PTWI (). The calculated THQ and HI for all metals were less than the threshold of 1 () posing no risk to human health. HBVSe was positive for all locations, indicating protective effect of Se against Hg. Cancer risk due to consumption of As, Cr, Cd, Ni and Pb in fish were less than 1 × 10⁻⁴ () showing no risk of cancer.
Table 3. Estimated weekly intake (EWI) of heavy metals and Selenium health benefit values (HBVSe) from consumption of muscle tissue from wild and farmed tilapia from Lake Kariba, Zambia
Table 4. Total hazard quotient (THQ) and hazard index (HI) for analysed heavy metals from consumption of wild and farmed tilapia
Table 5. Estimation of cancer risk (CR) posed by a lifetime of consumption of wild and farmed tilapia from Kariba due to As, Pb, Cd, Cr and Ni
Fish health
The European Union has set an Environmental Quality Standard (EQS) of 0.02 mg/kg of mercury in fish in the environment for assessment of fish health (EC EC Citation2006). The mean Hg level in wild fish from site 1 (0.021 mg/kg) was higher than the EQS set by the EU (). This may cause adverse effects in the fish.
Discussion
Metal concentration in muscle of farmed and wild tilapia from Lake Kariba
The study found significant difference in metal concentrations, with essential metals higher in farmed tilapia and non-essential metals higher in wild tilapia. Essential metals (Cu, Zn, Fe, Co and Mo) were higher in farmed and wild fish (site 3) near the farms, than in wild fish (sites 1 and 2) far from the farms. Essential metals are necessary for various biological functions and are therefore added as trace elements to fish feed (Yildiz Citation2008; Fallah et al. Citation2011), which may explain the higher levels in farmed fish (Sapkota et al. Citation2008; Burridge et al. Citation2010). Feed spillage from the fish farms is accessed by the wild tilapia nearby, thereby exposing them to higher levels of essential metals than the wild fish far from the fish farms (Basaran et al. Citation2010; Ballester-Molto et al. Citation2017). Non-essential metals (Al, Ni, Cd, Hg) were higher in wild fish sampled far from the fish farms. The higher Hg level at site 1 (0.021 mg/kg) () could possibly be due to coal mining in the area as coal mining has been reported to release Hg to the environment (Liu et al. Citation2014; Plessl et al. Citation2019). This calls for further studies. Furthermore, wild tilapia can live up to 9 years compared to farmed tilapia, which is harvested within 6 months of cage-rearing on the lake. The wild tilapia can therefore accumulate contaminants with long biological half-lives such as Hg and Cd over a longer life-span compared to farmed tilapia. Positive associations between Hg and Cd concentrations in tilapia and age as well as size are documented in other studies (Hamada et al. Citation2018). However, in the present study, we did not find any association between fish size (length) and Hg, whereas Cd and length showed significant association.
Comparison of metal concentration in muscle of tilapia with other regions
Sub-Saharan Africa
Levels of Cu, Fe, Zn and Mo in wild tilapia were similar to results reported in an earlier study on the same lake (Nakayama et al. Citation2010) but 10 (Cu) and two (Zn) times lower than findings by Berg et al. (Citation1995) (). The 21 years lapse between the study by Berg et al. (Citation1995) and our study may account for changes in metal content in the lake. This downward temporal trend could be due to changes in mining techniques along the drainage area of Lake Kariba, which are more environmentally friendly today. Berg et al. (Citation1995) also sampled in an area where cage and pond aquaculture were being practiced, which could have influenced levels of metals in the wild tilapia. Wild tilapia from Tanzania (Mapenzi et al. Citation2020) and Kenya (Nyingi et al. Citation2016) had three to 20 times higher levels of Fe, Cu and Zn than the present study, which may be explained by their location in areas with more industrial mining, agriculture and human activities. Cr level was 10 times lower than an earlier study in Kariba (Nakayama et al. Citation2010). The level of Cd was similar to those detected 6 years earlier (Nakayama et al. Citation2010), but more than 20 times lower than 21 years earlier in the lake, suggesting a reduction of Cd levels the last 20 years (Berg et al. Citation1995). Hg has not previously been analysed in tilapia from Zambia, but the levels were about 20 times lower than in wild tilapia from Tanzania (Mshana Grayson Citation2015) and two times lower than Ethiopia (Dsikowitzky et al. Citation2012). Pb levels were similar to findings 6 years earlier in Lake Kariba (Nakayama et al. Citation2010), but over 100 times lower than 21 years earlier in the same lake (Berg et al. Citation1995). Pb was also more than seven times lower than in Tanzania (Mapenzi et al. Citation2020), Kenya (Nyingi et al. Citation2016) and Ethiopia (Dsikowitzky et al. Citation2012). Ni in this study was ten times lower than earlier findings in Lake Kariba (Berg et al. Citation1995; Nakayama et al. Citation2010). The decrease of Pb, Cr and Ni levels was contrary to expectations, since the number of kapenta fishing boats rose from 423 in 2009 to 962 in 2013; these are thought to be the sources of Pb, Cr and Ni (Chali et al. Citation2014; Paulet Citation2014). The levels of metals in wild tilapia from Lake Kariba were thus lower than the levels in tilapia from other countries in the region. We also report lower levels of Cd (20x) and Pb (100x) compared with a previous study from the same lake. The Hg concentration was not measured in the previous study, but the levels found in the present study were lower than tilapia from Tanzania and Ethiopia.
Table 6. Comparison of mean concentration of heavy metals in muscle (mg/kg ww) of wild tilapia from other studies
As stated above, the farmed tilapia had significant higher levels of essential metals and significant lower levels of non-essential metals compared to the wild tilapia sampled far from the fish farms.
Farmed tilapia in this study had similar levels of the essential metals, Cu and Zn to those found earlier in fish from Lake Kariba (Berg et al. Citation1995), but five to 12 times higher than in farmed tilapia from Uganda (Birungi et al. Citation2007) (). This could be due to differences in composition of trace elements in the fish feeds. For Pb, Cd and Ni, levels were more than 200 times less than those found earlier in Lake Kariba (Berg et al. Citation1995). This is similar to observations above in wild tilapia where levels were also higher in the earlier study by Berg et al. (Citation1995), which indicates a substantial decline in the contamination of non-essential metals in Lake Kariba.
Table 7. Comparison of mean concentration of heavy metals in muscle (mg/kg ww) of farmed tilapia from other studies
North Africa
Levels of Cu, Fe, V, Al and Co in wild tilapia were similar to findings in Egypt (Ibrahim et al. Citation2020), whereas Se, Cr, As, Cd, Hg, Pb and Ni were two times lower than in Egypt (Hamada et al. Citation2018; Ibrahim et al. Citation2020) (). Tributaries that drain into river Nile carry effluents from industries and agriculture, as well as sewage. This may account for higher levels of Cd, Hg and Pb in Egypt.
The levels of Pb, Hg and Cd in farmed tilapia from Egypt (Authman et al. Citation2012; Hamada et al. Citation2018) were over 100 times higher than in the current study probably due to industrial and agricultural effluents as well as sewage, which have been reported to cause metal contamination in water in these areas (Authman et al. Citation2012; Hamada et al. Citation2018). Farmed Egyptian tilapia had also 5–100 times higher levels of Al and Ni than in the present study (Authman et al. Citation2012).
Asia and Middle East
Levels of Cu, Zn and As in wild tilapia were similar to those found in Saudi Arabia (Mohammed Citation2009; Abdel-Baki et al. Citation2011), China (Leung et al. Citation2014) and Malaysia (Taweel and Shuhaimi-Othman Citation2011) (). Cr was comparable to levels in Saudi Arabia (Abdel-Baki et al. Citation2011), but five to 16 times lower in China (Leung et al. Citation2014) and Malaysia (Abdulali Taweel and Shuhaimi-Othman Citation2011). Levels of Cd were similar to findings in Saudi Arabia (Abdel-Baki et al. Citation2011) but three to 40 times lower than in China (Leung et al. Citation2014), Malaysia (Abdulali Taweel and Shuhaimi-Othman Citation2011) and Saudi Arabia (Mohammed Citation2009). Levels of Hg in wild tilapia were 10 to 20 times higher than those found in Saudi Arabia (Abdel-Baki et al. Citation2011) but 4 to 8 times lower than the Hg levels detected in wild tilapia from Malaysia (Naji et al. Citation2014). Pb levels were similar to those in Saudi Arabia (Abdel-Baki et al. Citation2011), but substantially lower than in China (Leung et al. Citation2014), Malaysia (Abdulali Taweel and Shuhaimi-Othman Citation2011) and Saudi Arabia (Mohammed Citation2009). It was noted that levels of Pb in China were almost 1000 times higher (Leung et al. Citation2014). In the present study, Ni was more than 30 times lower than in China (Leung et al. Citation2014) and Malaysia (Abdulali Taweel and Shuhaimi-Othman Citation2011), while As was comparable to levels in China (Leung et al. Citation2014). The higher levels of Pb, Ni, Hg and Cd in wild tilapia from Asia are probably due to discharge of untreated industrial, agricultural and domestic effluents to aquatic environments.
The Cu levels in farmed fish from Lake Kariba were comparable to those in Taiwan (Ling et al. Citation2013), but five times higher than in Malaysia (Taweel et al. Citation2013) (). Zinc levels were similar to those in Malaysia (Taweel et al. Citation2013), but nine times lower than in Taiwan (Ling et al. Citation2013). Co and Se levels were also lower than those in Taiwan (Ling et al. Citation2013). The variation in the levels of essential metals in farmed fish is probably due to differences in the content of these chemicals in the local fish feed. Levels of non-essential metals, As, Cd, Pb, Cr and Ni were substantially lower than findings in China (Cheung et al. Citation2008; Kwok et al. Citation2014; Geng et al. Citation2015), Malaysia (Taweel and Shuhaimi-Othman Citation2011) and Taiwan (Ling et al. Citation2013). The levels of Hg detected in farmed tilapia from China are also substantially higher than the levels detected in the present study as well as other studies from sub-Saharan Africa. The higher levels of heavy metals in farmed fish from Asia may be due to the higher level of industrial and agricultural activities, which increase the risk of pollution of aquatic environments. Difference in feed composition may also affect levels in different areas.
Correlations
In the present study, essential metals (Fe, Cu, Zn, Co and Mo) showed positive correlation, which may be explained by a common source of trace elements from the fish feed (Yildiz Citation2008; Fallah et al. Citation2011). Non-essential metals (Al, Cd, Ag, Hg and Ni) also had positive correlation but showed negative correlation with essential metals (Zn, Cu and Mo). The wild fish had higher levels of non-essential metals probably due to a longer life span resulting in longer exposure, whereas they had lower essential metals probably because they were not exposed to commercial feed. This may explain the negative correlation between non-essential and essential metals. Since wild fish were larger than the farmed fish () and had lower levels of essential metals (Zn, Cu and Mo), this accounted for the negative correlation observed between length and Zn, Cu and Mo.
Possible health risk assessment
Human health risk
The concentrations of metals in the muscle of wild and farmed tilapia from Lake Kariba () were below the threshold values for adverse effects set by WHO/FAO (FAO/WHO Citation2002) and EU(EC EC Citation2006). We estimated the EWI () and showed that the EWI was much lower than the PTWI. The THQs, which is the ratio of the exposure levels (EWI) of the individual potential harmful metal and the level at which no adverse effects are expected (PTWI), were below 1 for all metals. Likewise, the HI (), which is the sum of THQs for all metals was also below 1, indicating that the fish can be consumed regularly without any significant health risk from both single metal exposure and cumulative effect of exposure to multiple metals. HBVSe from all sites were positive, indicating protecting effects of selenium against mercury in the fish (Ralston et al. Citation2016; Yabanli and Tay Citation2021). Mercury has been shown to inhibit selenium-dependent enzymes (selenoenzymes) that protect against and reverse oxidative brain damage and perform other vital functions such as foetal brain development, growth, thyroid hormone metabolism and calcium regulation (Squadrone et al. Citation2015; Ralston et al. Citation2016, Citation2019). Selenium sequesters mercury, forming an insoluble selenium-mercury (HgSe) compound, that is excreted from the body (Ralston et al. Citation2016; Yabanli and Tay Citation2021). Thus, a Se:Hg molar >1, indicates excess Se and its protective effect against Hg (Squadrone et al. Citation2015; Yabanli and Tay Citation2021). The estimated TCR for As, Cd, Cr, Ni and Pb was less than 1 × 10x−4 (), indicating that the risk of humans developing cancer during their lifetime, as a result of consuming wild and farmed tilapia from Lake Kariba was less than 1:10,000 (Varol et al. Citation2017).
Fish health risk
The mean concentration of Hg at site 1 (0.021 mg/kg) was slightly higher than the EQSBiota (0.02 mg/kg) set by the EU (EC EC Citation2006). An EQS is the concentration of a particular pollutant or group of pollutants in water, sediment or biota that should not be exceeded in order to protect human health and the environment (Lyche et al. Citation2019). Environmental quality standards (EQS) are therefore guidelines set by the EU for monitoring pollution in water and biota (aquatic organisms). Chemical pollution of surface water poses a threat to the aquatic environment and may induce acute and chronic toxicity in aquatic organisms (Ec Citation2006). Relatively small concentrations of Hg (<160 mg/kg ww) can adversely affect the reproduction, development, growth, metabolism, neurobehavior, and immune responses of fish (Weis Citation2009; Rhea et al. Citation2013). Though the mean at site 1 was above the EQS, only one sample (0.16 mg/kg) was above the EQS. However, this finding is still a cause of concern, since it is above the EQS and may induce adverse effects in fish and other sensitive aquatic organisms.
Conclusions
The study presents the first comparison of heavy metals in wild and farmed tilapia on Lake Kariba in Zambia. This will serve as a baseline for future studies and developing of guidelines for the rapidly developing aquaculture sector in Zambia as well as sub-Saharan Africa. Heavy metal levels in all fish were below the ML set by WHO/EU. Essential metals (Cu, Zn, Fe, Mo and Co) were higher in farmed fish, while non-essential metals (Cd, Pb, Al, Ni and Hg) were higher in wild fish. Wild tilapia near the fish farms also had higher levels of essential metals compared to those distant from the farms suggesting that spill-over of feed and waste from the farms has the potential to contaminate the wild fish in the vicinity. It is therefore vital that proper guidelines are put in place to limit the effects on wild fish. Levels of Cd, Hg and Pb in Lake Kariba were also lower than those reported in North Africa and Asia. EWI of all metals were far below the PTWI. The THQ and HI were all below 1, showing no risk of non-carcinogenic effects from consumption of individual or combination of metals in fish, during a lifetime. HBVSe were all positive, indicating protective effects of Se against Hg in fish. Total cancer risks were below 1 × 10⁻⁴, showing less than 1:10,000 risk of carcinogenic effects from fish consumption during a lifetime. Levels of Hg in some wild fish were higher than the EQS set by the EU. Long-term exposure to Hg may therefore cause adverse effects in wild fish and other aquatic organisms. The findings of this study show that tilapia from the lake are safe for human consumption and there are no adverse effects on fish health.
Acknowledgments
The study was a part of TRAHESA project, A Capacity Building for Training and Research in Aquatic and Environmental Health in Eastern and Southern Africa, funded by NORAD Project (No. RAF-19/0018TAZ-13/0027). We would like to thank the local Veterinary and Fisheries authorities in Gweembe, Siavonga and Sinazongwe district for their support, fishermen and fish farmers for assisting us with sample collection. We express our appreciation to staff at MINA, NMBU for analysis of heavy metals.
Disclosure statement
No potential conflict of interest was reported by the author(s).
Additional information
Funding
References
- Abdel-Baki AS, Dkhil MA, Al-Quraishy S. 2011. Bioaccumulation of some heavy metals in tilapia fish relevant to their concentration in water and sediment of Wadi Hanifah, Saudi Arabia. AFR J BIOTECHNOL. 10:2541–2547. doi:https://doi.org/10.5897/AJB10.1772
- Adriano DC. 2001. Trace elements in terrestrial environments: biogeochemistry, bioavailability, and risks of metals. 2nd ed. New York: Springer Verlag; p. 91–131.
- Ahmed K, Baki MA, Kundu GK, Saiful I, Monirul I, Muzammel H. 2016. Human health risks from heavy metals in fish of Buriganga river, Bangladesh. SpringerPlus. 5(1):1697. doi:https://doi.org/10.1186/s40064-016-3357-0.
- Amundsen P-A, Staldvik FJ, Lukin AA, Kashulin NA, Popova OA, Reshetnikov YS. 1997. Heavy metal contamination in freshwater fish from the border region between Norway and Russia. Sci Total Environ. 201(3):211–224. doi:https://doi.org/10.1016/S0048-9697(97)84058-2.
- Arisekar U, Shakila RJ, Shalini R, Jeyasekaran G. 2020. Human health risk assessment of heavy metals in aquatic sediments and freshwater fish caught from Thamirabarani River, the Western Ghats of South Tamil Nadu. Mar Pollut Bull. 159:111496. doi:https://doi.org/10.1016/j.marpolbul.2020.111496
- Authman MM, Abbas WT, Gaafar AY. 2012. Metals concentrations in Nile tilapia Oreochromis niloticus () from illegal fish farm in Al-Minufiya Province, Egypt, and their effects on some tissues structures. Ecotoxicol Environ Saf. 84:163–172. doi:https://doi.org/10.1016/j.ecoenv.2012.07.005
- Ballester-Molto M, Sanchez-Jerez P, Aguado-Gimenez F. 2017. Consumption of particulate wastes derived from cage fish farming by aggregated wild fish. An experimental approach. Mar Environ Res. 130:166–173. doi:https://doi.org/10.1016/j.marenvres.2017.07.014
- Bamuwamye M, Ogwok P, Tumuhairwe V. 2015. Cancer and non-cancer risks associated with heavy metal exposures from street foods: evaluation of roasted meats in an urban setting. J Environ Pollut Human Health. 3(2):24–30. doi:https://doi.org/10.12691/jephh-3-2-1.
- Basaran AK, Aksu M, Egemen O. 2010. Impacts of the fish farms on the water column nutrient concentrations and accumulation of heavy metals in the sediments in the eastern Aegean Sea (Turkey). Environ Monit Assess. 162(1):439–451. doi:https://doi.org/10.1007/s10661-009-0808-x.
- Béné C, Barange M, Subasinghe R, Pinstrup-Andersen P, Merino G, Hemre G-I, Williams M. 2015. Feeding 9 billion by 2050 – putting fish back on the menu. Food Security. 7(2):261–274. doi:https://doi.org/10.1007/s12571-015-0427-z.
- Berg H, Kiibus M, Kautsky N. 1995. Heavy metals in tropical Lake Kariba, Zimbabwe. Water Air Soil Pollut. 83(3):237–252. doi:https://doi.org/10.1007/BF00477355.
- Berg H, Martina K, Kautsky N. 1992. DDT and other insecticides in the Lake Kariba ecosystem, Zimbabwe. Ambio. 21(7):444–450.
- Birungi Z, Masola B, Zaranyika MF, Naigaga I, Marshall B. 2007. Active biomonitoring of trace heavy metals using fish (Oreochromis niloticus) as bioindicator species. The case of Nakivubo wetland along Lake Victoria. Phys Chem Earth Parts A/B/C. 32(15):1350–1358. doi:https://doi.org/10.1016/j.pce.2007.07.034.
- Burridge L, Weis JS, Cabello F, Pizarro J, Bostick K. 2010. Chemical use in salmon aquaculture: a review of current practices and possible environmental effects. Aquaculture. 306(1):7–23. doi:https://doi.org/10.1016/j.aquaculture.2010.05.020.
- Chali M, Musuka G, Confred, Nyimbili B. 2014. The impact of fishing pressure on Kapenta (Limnothrissa miodon) production in Lake Kariba, Zambia! A case study of Siavonga District. Int J Agric Fish. 2(6):107–116.
- Chan CY, Tran N, Pethiyagoda S, Crissman CC, Sulser TB, Phillips MJ. 2019. Prospects and challenges of fish for food security in Africa. Global Food Security. 20:17–25. doi:https://doi.org/10.1016/j.gfs.2018.12.002
- Cheung KC, Leung HM, Wong MH. 2008. Metal concentrations of common freshwater and marine fish from the Pearl River Delta, South China. Arch Environ Contam Toxicol. 54(4):705–715. doi:https://doi.org/10.1007/s00244-007-9064-7.
- Copaja SV, Perez CA, Vega-Retter C, Veliz D. 2017. Heavy metal content in Chilean fish related to habitat use, tissue type and river of origin. Bull Environ Contam Toxicol. 99(6):695–700. doi:https://doi.org/10.1007/s00128-017-2200-9.
- Copat C, Grasso A, Fiore M, Cristaldi A, Zuccarello P, Signorelli SS, … Ferrante M. 2018. Trace elements in seafood from the Mediterranean sea: an exposure risk assessment. Food Chem Toxicol. 115:13–19. doi:https://doi.org/10.1016/j.fct.2018.03.001
- DIRECTIVE 2013/39/EU OF THE EUROPEAN PARLIAMENT AND OF THE COUNCIL of 12 August 2013 amending Directives 2000/60/EC and 2008/105/EC as regards priority substances in the field of water policy, (2013).
- Dsikowitzky L, Tsegaye M, Dadebo E, Carvalho C, Sindern S. 2012. Assessment of heavy metals in water samples and tissues of edible fish species from Awassa and Koka Rift Valley Lakes, Ethiopia. Environ Monit Assessment, 185. doi:https://doi.org/10.1007/s10661-012-2777-8
- [EC] European Commission. 2006. COMMISSION REGULATION (EC) No 1881/2006 of 19 December 2006 setting maximum levels for certain contaminants in foodstuffs. IOP Publishing PhysicsWep. https://www.fsai.ie/uploadedFiles/Consol_Reg1881_2006.pdf
- [EFSA] European Food safety. 2010. EFSA Panel on Contaminants in the Food Chain Scientific Opinion on Lead in Food. 8(4), 1570. doi: https://doi.org/10.2903/j.efsa.2010.1570.
- [EFSA] European Food Safety Authority. 2008. Safety of aluminium from dietary intake1. Scientific Opinion of the Panel on Food Additives, Flavourings, Processing Aids and Food Contact Materials (AFC). Adopted on 22 May 2008. The EFSA Journal.
- [EFSA] European Food Safety Authority. 2012. Scientific Opinion on the risk for public health related to the presence of mercury and methylmercury in food. Panel on Contaminants in the Food Chain. 10(12), 2985. doi: https://doi.org/10.2903/j.efsa.2012.2985.
- Fallah AA, Saei-Dehkordi SS, Nematollahi A, Jafari T. 2011. Comparative study of heavy metal and trace element accumulation in edible tissues of farmed and wild rainbow trout (Oncorhynchus mykiss) using ICP-OES technique. Microchem J. 98(2):275–279. doi:https://doi.org/10.1016/j.microc.2011.02.007.
- Finley, B. L, Monnot, A. D, Paustenbach, D. J, & Gaffney, S. H. (2012). Derivation of a chronic oral reference dose for cobalt. Regulatory Toxicology and Pharmacology, 64(3), 491–503. doi:https://doi.org/10.1016/j.yrtph.2012.08.022
- [FAO] Food and Agriculture Organisation. 2005-2019. Cultured aquatic species information programme. Oreochromis niloticus. Cultured aquatic species information programme. Text by Rakocy, J. E. In: FAO Fisheries and Aquaculture Department [online]. Rome. [Updated Oct 18 Feb 2005; cited 23 Oct 2019]. accessed 2019 Oct 23 www.fao.org/fishery/culturedspecies/Oreochromis_niloticus/en .
- [FAO] Food and Agriculture Organisation. 2016. The state of world fisheries and aquaculture 2016. Contributing to food security and nutrition for all. Rome: 200.
- [FAQ] Food and Agriculture Organisation. 2018. THE STATE OF WORLD FISHERIES AND AQUACULTURE - MEETING THE SUSTAINABLE DEVELOPMENT GOALS. Rome.
- [FAO] Food and Agriculture Organisation. 2020. The state of world fisheries and aquaculture 2020. Sustainability in action. Rome. doi:https://doi.org/10.4060/ca9229en
- [FAO/WHO] Food and Agriculture Organisation/World Health Organisation. 2002. Codex Alimentarius, Schedule 1 of the proposed draft Codex general standards for contaminants and toxins in food. Joint FAO/WHO Food Standards Programme, Codex Committee, Rotterdam. PhysicsWep: http://www.fao.org/input/download/report/28/Al03_12e.pdf .
- Geng -J-J, Li H, Liu J-P, Yang Y, Jin Z-L, Zhang Y-N, … Du Z-Y. 2015. Nutrients and contaminants in tissues of five fish species obtained from Shanghai markets: risk–benefit evaluation from human health perspectives. Sci Total Environ. 536:933–945. doi:https://doi.org/10.1016/j.scitotenv.2015.06.057
- Genschick S, Kaminski AM, Kefi AS, Cole SM. 2017. Aquaculture in Zambia- An overview and evaluation of the sector’s responsiveness to the needs of the poor. Penang (Malaysia): CGIAR Research Program on Fish Agri-Food Systems and Lusaka, Zambia: Department of Fisheries. Working Paper: FISH-2017-08.
- Hamada M, Elbayoumi Z, Khader R, Elbagory A. 2018. Assessment of heavy metal concentration in fish meat of wild and farmed nile tilapia (Oreochromis Niloticus), Egypt. Alexandria J Vet Sci. 57:30. doi:https://doi.org/10.5455/ajvs.295019
- Ibrahim M, Sayed E-S, Shaban A, Abdel-Ghafour S, Abouzied S, Abdel-Rahman R, Hassan M, El-Lahamy A, Adel, Abo–Zeid S, et al. 2020. Effect of location and grilling process on heavy metals concentration in muscles of different fish species, Egypt %J. Egypt J Aquat Biol Fish. 24(6):15–24. doi:https://doi.org/10.21608/ejabf.2020.109083.
- Jarić I, Višnjić-Jeftić Ž, Cvijanović G, Gačić Z, Jovanović L, Skorić S, Lenhardt M. 2011. Determination of differential heavy metal and trace element accumulation in liver, gills, intestine and muscle of sterlet (Acipenser ruthenus) from the Danube River in Serbia by ICP-OES. Microchem J. 98(1):77–81. doi:https://doi.org/10.1016/j.microc.2010.11.008.
- Javed M, Usmani N. 2017. An overview of the adverse effects of heavy metal contamination on fish health. Proc Nat Acad Sci In Sec B. 89(2):389–403. doi:https://doi.org/10.1007/s40011-017-0875-7.
- [JECFA] Joint FAO/WHO Expert Committee on Food Additives. 2011. Evaluation of Certain Food Additives and Contaminants Seventy-Third Report of the Joint FAO/WHO Expert Committee on Food Additives. Evaluation of Certain Food Additives and Contaminants.
- [JECFA] Joint FAO/WHO Expert Committee on Food Additives. 2017. Food Contaminants. http://apps.who.int/foodadditives-contaminants-jecfa-database/search.aspx
- Food and Agriculture Organisation (FAO). 2007. THE STATE OF WORLD FISHERIES AND AQUACULTURE 2006. Rome: FAO (Fisheries and Aquaculture Department; p. 1–180. Rome.
- [JECFA] Joint FAO/WHO Expert Committee on Food Additives, Food Agriculture Organization of the United, Nations World Health, Organization. 1989. Evaluation of certain food additives and contaminants: thirty-third report of the Joint FAO/WHO Expert Committee on Food Additives [meeting held in Geneva from 21 to 30 March 1988]. Geneva: World Health Organization.
- Kaminski AM, Genschick S, Kefi AS, Kruijssen F. 2018. Commercialization and upgrading in the aquaculture value chain in Zambia. Aquaculture. 493:355–364. doi:https://doi.org/10.1016/j.aquaculture.2017.12.010
- Kishimba MA, Henry L, Mwevura H, Mmochi AJ, Mihale M, Hellar H. 2004. The status of pesticide pollution in Tanzania. Talanta. 64(1):48–53. doi:https://doi.org/10.1016/j.talanta.2003.11.047.
- Kwok CK, Liang Y, Wang H, Dong YH, Leung SY, Wong MH. 2014. Bioaccumulation of heavy metals in fish and Ardeid at Pearl River Estuary, China. Ecotoxicol Environ Saf. 106:62–67. doi:https://doi.org/10.1016/j.ecoenv.2014.04.016
- Leung HM, Leung AOW, Wang HS, Ma KK, Liang Y, Ho KC, Yung KKL, Tohidi F, Yung KKL. 2014. Assessment of heavy metals/metalloid (As, Pb, Cd, Ni, Zn, Cr, Cu, Mn) concentrations in edible fish species tissue in the Pearl River Delta (PRD), China. Mar Pollut Bull. 78(1):235–245. doi:https://doi.org/10.1016/j.marpolbul.2013.10.028.
- Li X, Li J, Wang Y, Fu L, Fu Y, Li B, Jiao B. 2011. Aquaculture industry in China: current state, challenges, and outlook. Rev Fish Sci. 19(3):187–200. doi:https://doi.org/10.1080/10641262.2011.573597.
- LIN, H. T., WONG, S. S. & LI, G.-C. 2004. Heavy metal content of rice and Shellfish in Taiwan. Journal of Food and Drug Analysis, 12, 167–174.
- Ling M-P, Wu -C-C, Yang K-R, Hsu H-T. 2013. Differential accumulation of trace elements in ventral and dorsal muscle tissues in tilapia and milkfish with different feeding habits from the same cultured fishery pond. Ecotoxicol Environ Saf. 89:222–230. doi:https://doi.org/10.1016/j.ecoenv.2012.12.002
- Liu J, Xu X, Yu S, Cheng H, Hong Y, Feng X. 2014. Mercury pollution in fish from South China Sea: levels, species-specific accumulation, and possible sources. Environ Res. 131:160–164. doi:https://doi.org/10.1016/j.envres.2014.03.004
- Lyche J, Ludvig., Nøstbakken O, Jakob., Berg V. 2019. EU water framework-directive priority contaminants in Norwegian freshwater fish. Norway.
- Mansour SA, Sidky MM. 2002. Ecotoxicological Studies. 3. Heavy metals contaminating water and fish from Fayoum Governorate, Egypt. Food Chem. 78(1):15–22. doi:https://doi.org/10.1016/S0308-8146(01)00197-2.
- Mapenzi LL, Shimba MJ, Moto EA, Maghembe RS, Mmochi AJ. 2020. Heavy metals bio-accumulation in tilapia and catfish species in Lake Rukwa ecosystem Tanzania. J Geochem Explor. 208:106413. doi:https://doi.org/10.1016/j.gexplo.2019.106413
- Marengo M, Durieux EDH, Ternengo S, Lejeune P, Degrange E, Pasqualini V, Gobert S. 2018. Comparison of elemental composition in two wild and cultured marine fish and potential risks to human health. Ecotoxicol Environ Saf. 158:204–212. doi:https://doi.org/10.1016/j.ecoenv.2018.04.034
- Maurya PK, Malik DS, Yadav KK, Kumar A, Kumar S, Kamyab H. 2019. Bioaccumulation and potential sources of heavy metal contamination in fish species in River Ganga basin: possible human health risks evaluation. Toxicol Rep. 6:472–481. doi:https://doi.org/10.1016/j.toxrep.2019.05.012
- Miao, L, Liu, B, He, J, Xie, J, Ge, X, Xu, P, . . . Liang, Z. (2010). Evaluation of nutritive quality and nutritional components in the muscle of GIFT strain of Nile tilapia (Oreochromis niloticus). Journal of Shanghai Ocean University, 19(5), 635–641
- Mohammed AA-K. 2009. Accumulation of heavy metals in Tilapia Fish (Oreochromis niloticus) from Al-Khadoud Spring, Al-Hassa, Saudi Arabia. Am J Appl Sci. 6(12). doi:https://doi.org/10.3844/ajassp.2009.2024.2029.
- Mshana Grayson J. 2015. Mercury and lead contamination in three fish species and sediments from lake rukwa and catchment areas in Tanzania. J Health Pollut. 5(8):7–18. doi:https://doi.org/10.5696/i2156-9614-5-8.7.
- Mwakalapa. EB, Mmochi. AJ, Müller. MHB, Mdegela. RH, Lyche. JL, Polder. A. 2018. Occurrence and levels of persistent organic pollutants (POPs) in farmed and wild marine fish from Tanzania. A pilot study. Chemosphere. 191(438–449):438–449. doi:https://doi.org/10.1016/j.chemosphere.2017.09.121.
- Mwakalapa EB, Simukoko CK, Mmochi AJ, Mdegela RH, Berg V, Bjorge Muller MH, Polder A, Polder A. 2019. Heavy metals in farmed and wild milkfish (Chanos chanos) and wild mullet (Mugil cephalus) along the coasts of Tanzania and associated health risk for humans and fish. Chemosphere. 224:176–186. doi:https://doi.org/10.1016/j.chemosphere.2019.02.063
- Naji A, Ismail A, Kamrani E, Sohrabi T. 2014. Correlation of MT levels in livers and gills with heavy metals in wild tilapia (Oreochromis mossambicus) from the Klang River, Malaysia. Bull Environ Contam Toxicol. 92(6):674–679. doi:https://doi.org/10.1007/s00128-014-1243-4.
- Nakayama SM, Ikenaka Y, Muzandu K, Choongo K, Yabe J, Muroya T, Ishizuka M, Minagawa M, Umemura T, Ishizuka M. 2013. Geographic information system-based source estimation of copper pollution in Lake Itezhi-tezhi and metal-accumulation profiles in Oreochromis spp. from both field and laboratory studies. Arch Environ Contam Toxicol. 64(1):119–129. doi:https://doi.org/10.1007/s00244-012-9802-3.
- Nakayama SMM, Ikenaka Y, Muzandu K, Choongo K, Oroszlany B, Teraoka H, Ishizuka M, Ishizuka M. 2010. Heavy metal accumulation in lake sediments, fish (Oreochromis niloticus and Serranochromis thumbergi), and Crayfish (Cherax quadricarinatus) in Lake Itezhi-tezhi and Lake Kariba, Zambia. Arch Environ Contam Toxicol. 59(2):291–300. doi:https://doi.org/10.1007/s00244-010-9483-8.
- Nazir R, Khan M, Masab M, Rehman HU, Rauf NU, Shahab S, … Shaheen Z. 2015. Accumulation of heavy metals (Ni, Cu, Cd, Cr, Pb, Zn, Fe) in the soil, water and plants and analysis of physico-chemical parameters of soil and water collected from Tanda Dam Kohat. J Pharmaceut Sci Res. 7:89–97.
- Nonga HE, Mdegela RH, Lie E, Sandvik M, Skaare JU. 2011. Assessment of farming practices and uses of agrochemicals in Lake Manyara basin, Tanzania. Af J Agric Res. 6:2216–2230. doi:https://doi.org/10.5897/AJAR11.271
- Nyingi B, Gitahi KJ, Kiptoo M, Jackson K. 2016. Heavy metal concentrations in water and selected fish species (tilapia, catfish and lungfish) from Lake Baringo, Kenya. Int J Sci Environ. 5:4288–4295.
- Paulet G. 2014. KAPENTA RIG SURVEY OF THE ZAMBIAN WATERS OF LAKE KARIBA. Ebene (Mauritius).
- Plessl C, Gilbert BM, Sigmund MF, Theiner S, Avenant-Oldewage A, Keppler BK, Jirsa F. 2019. Mercury, silver, selenium and other trace elements in three cyprinid fish species from the Vaal Dam, South Africa, including implications for fish consumers. Sci Total Environ. 659:1158–1167. doi:https://doi.org/10.1016/j.scitotenv.2018.12.442
- Polder A, Muller MB, Lyche JL, Mdegela RH, Nonga HE, Mabiki FP, Lie E, Skaare JU, Sandvik M, Skjerve E. 2014. Levels and patterns of persistent organic pollutants (POPs) in tilapia (Oreochromis sp.) from four different lakes in Tanzania: geographical differences and implications for human health. Sci Total Environ. 488-489:252–260. doi:https://doi.org/10.1016/j.scitotenv.2014.04.085
- Raknuzzaman M, Ahmed MK, Islam MS, Habibullah-Al-Mamun M, Tokumura M, Sekine M, Masunaga S. 2016. Trace metal contamination in commercial fish and crustaceans collected from coastal area of Bangladesh and health risk assessment. Environ Sci Pollut Res. 23(17):17298–17310. doi:https://doi.org/10.1007/s11356-016-6918-4.
- Ralston NVC, Kaneko JJ, Raymond LJ. 2019. Selenium health benefit values provide a reliable index of seafood benefits vs. risks. J Trace Elements Medi Biol. 55:50–57. doi:https://doi.org/10.1016/j.jtemb.2019.05.009
- Ralston NVC, Ralston CR, Raymond LJ. 2016. Selenium health benefit values: updated criteria for mercury risk assessments. Biol Trace Elem Res. 171(2):262–269. doi:https://doi.org/10.1007/s12011-015-0516-z.
- Rhea DT, Farag AM, Harper DD, McConnell E, Brumbaugh WG. 2013. Mercury and selenium concentrations in biofilm, macroinvertebrates, and fish collected in the Yankee fork of the Salmon River, Idaho, USA, and their potential effects on fish health. Arch Environ Contam Toxicol. 64(1):130–139. doi:https://doi.org/10.1007/s00244-012-9816-x.
- Saha N, Mollah MZI, Alam MF, Safiur Rahman M. 2016. Seasonal investigation of heavy metals in marine fishes captured from the Bay of Bengal and the implications for human health risk assessment. Food Control. 70:110–118. doi:https://doi.org/10.1016/j.foodcont.2016.05.040
- Sapkota A, Sapkota AR, Kucharski M, Burke J, McKenzie S, Walker P, Lawrence R. 2008. Aquaculture practices and potential human health risks: current knowledge and future priorities. Environ Int. 34(8):1215–1226. doi:https://doi.org/10.1016/j.envint.2008.04.009.
- Shaalan M, El-Mahdy M, Saleh M, El-Matbouli M. 2018. Aquaculture in Egypt: insights on the current trends and future perspectives for sustainable development. Rev Fish Sci Aquacult. 26(1):99–110. doi:https://doi.org/10.1080/23308249.2017.1358696.
- Squadrone S, Benedetto A, Brizio P, Prearo M, Abete MC. 2015. Mercury and selenium in European catfish (Silurus glanis) from Northern Italian Rivers: can molar ratio be a predictive factor for mercury toxicity in a top predator? Chemosphere. 119:24–30. doi:https://doi.org/10.1016/j.chemosphere.2014.05.052
- Ssebugere P, Sillanpää M, Wang P, Li Y, Kiremire BT, Kasozi GN, … Jiang G. 2014. Polychlorinated dibenzo-p-dioxins, polychlorinated dibenzofurans and polybrominated diphenyl ethers in sediments and fish species from the Murchison Bay of Lake Victoria, Uganda. Sci Total Environ. 500-501(1–10). doi:https://doi.org/10.1016/j.scitotenv.2014.08.076.
- Stankovic S, Kalaba P, & Stankovic A. R. (2014). Biota as toxic metal indicators. Environmental Chemistry Letters, 12(1), 63–84. doi: https://doi.org/10.1007/s10311-013-0430-6.
- Subasinghe RP. 2005. Epidemiological approach to aquatic animal health management: opportunities and challenges for developing countries to increase aquatic production through aquaculture. Prev Vet Med. 67(2):117–124. doi:https://doi.org/10.1016/j.prevetmed.2004.11.004.
- Taweel A, Shuhaimi-Othman M. 2011. Heavy metals concentration in different organs of tilapia fish (Oreochromis niloticus) from selected areas of Bangi, Selangor, Malaysia. Afr J Biotechnol. 10(55).
- Taweel A, Shuhaimi-Othman M, Ahmad AK. 2013. Assessment of heavy metals in tilapia fish (Oreochromis niloticus) from the Langat River and Engineering Lake in Bangi, Malaysia, and evaluation of the health risk from tilapia consumption. Ecotoxicol Environ Saf. 93:45–51. doi:https://doi.org/10.1016/j.ecoenv.2013.03.031
- Tchounwou PB, Yedjou CG, Patlolla AK, Sutton DJ. 2012. Heavy metal toxicity and the environment. Exp Suppl. 101:133–164. doi:https://doi.org/10.1007/978-3-7643-8340-4_6
- Tran N, Chu L, Chan CY, Genschick S, Phillips MJ, Kefi AS. 2019. Fish supply and demand for food security in Sub-Saharan Africa: an analysis of the Zambian fish sector. Marine Pol. 99:343–350. doi:https://doi.org/10.1016/j.marpol.2018.11.009
- [USEPA] U.S. Environmental Protection Agency. 1995. Final water quality guidance for the Great Lakes system. Fed. Regist. 60:15365–15425.
- [USEPA] United States Environmental Protection Agency. 2018. US EPA Regional Screening Levels (RSLs) (November 2018)- Dataset- California open data. [accessed 2021 Jul 28] https://data.ca.gov/dataset/us-epa-regional-screening-levels-rsls-november-2018/resource/b66c9172-a61a-4131-997f-01f45a473a08
- Varol M, Kaya GK, Alp A. 2017. Heavy metal and arsenic concentrations in rainbow trout (Oncorhynchus mykiss) farmed in a dam reservoir on the Firat (Euphrates) River: risk-based consumption advisories. Sci Total Environ. 599-600:1288–1296. doi:https://doi.org/10.1016/j.scitotenv.2017.05.052
- Vicente-Zurdo D, Gómez-Gómez B, Pérez-Corona MT, Madrid Y. 2019. Impact of fish growing conditions and cooking methods on selenium species in swordfish and salmon fillets. J Food Compos Anal. 83:103275. doi:https://doi.org/10.1016/j.jfca.2019.103275
- Vos JG, Dybing E, Greim HA, Ladefoged O, Lambre C, Tarazona JV, … Vethaak AD. 2000. Health effects of endocrine-disrupting chemicals on wildlife, with special reference to the European situation. Crit Rev Toxicol. 30(1):71–133. doi:https://doi.org/10.1080/10408440091159176.
- Waseem A, Arshad J, Iqbal F, Sajjad A, Mehmood Z, Murtaza G. 2014. Pollution status of Pakistan: a retrospective review on heavy metal contamination of water, soil, and vegetables. Biomed Res Int. (2014:813206. doi:https://doi.org/10.1155/2014/813206
- Watterson. A, Little. D, Young. JA, Boyd. K, Azim. E, Murray. F. 2008. Towards integration of environmental and health impact assessments for wild capture fishing and farmed fish with particular reference to public health and occupational health dimensions. Int J Environ Res Public Health. 5(258–227):258–277. doi:https://doi.org/10.3390/ijerph5040258.
- Weis JS. 2009. Reproductive, developmental, and neurobehavioral effects of methylmercury in fishes. J Environ Sci Health Part C. 27(4):212–225. doi:https://doi.org/10.1080/10590500903310088.
- Xiao H, Zang S, Guan Y, Liu S, Gao Y, Sun Q, Pei X, Li M, Wang J, Pei X. 2014. Assessment of potential risks associated with heavy metal contamination in sediment in Aobaopao Lake, China, determined from sediment cores. Ecotoxicology. 23(4):527–537. doi:https://doi.org/10.1007/s10646-014-1220-z.
- Yabanli M, Tay S. 2021. Selenium and mercury balance in sea bream obtained from different living environments in Turkey: a risk assessment for the consumer health. Environ Sci Pollut Res Int. 28(27):36069–36075. doi:https://doi.org/10.1007/s11356-021-13366-y.
- Yildiz M. 2008. Mineral composition in fillets of sea bass (Dicentrarchus labrax) and sea bream (Sparus aurata): a comparison of cultured and wild fish. J Appl Ichthyol. 24(5):589–594. doi:https://doi.org/10.1111/j.1439-0426.2008.01097.x.
- Zambia Central Statistical Office. (2012). Zambia 2010 Census of Population and Housing. Lusaka, Zambia.
- Zhang W, Jin X, Di Z, Zhu X, Shan B. 2016. Heavy metals in surface sediments of the shallow lakes in eastern China: their relations with environmental factors and anthropogenic activities. Environ Sci Pollut Res. 23(24):25364–25373. doi:https://doi.org/10.1007/s11356-016-7643-8.