
 ?Mathematical formulae have been encoded as MathML and are displayed in this HTML version using MathJax in order to improve their display. Uncheck the box to turn MathJax off. This feature requires Javascript. Click on a formula to zoom.
Abstract
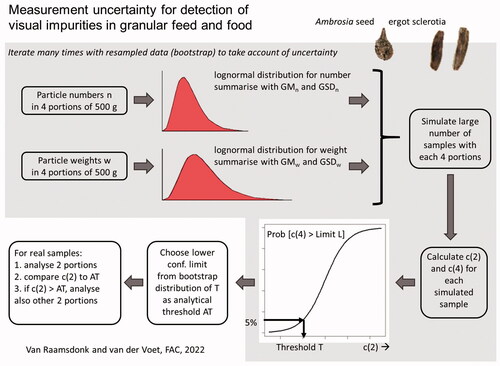
The presence is regulated of visually detectable seeds from a selection of toxic plants and fungi mycelium bodies (sclerotia) in feed (Directive 2002/32/EC) and in food (Regulation (EC) 1881/2006). Homogenisation as typical for chemical analyses is not applicable, and dedicated approaches are needed for visual examination methods. Visual methods require two parameters to characterise measurement uncertainties for both unit counts and unit weights. A new approach is to divide approximately 2 kg of sample material into four subsamples of approximately 500 g and to separately examine the four subsamples for numbers and particle weights of seeds or sclerotia. This study is the first to produce datasets on inhomogeneity among subsamples of a sample for visually detectable undesirable substances. Analytical thresholds were calculated from a simulation model and bootstrap procedures based on our data. The analytical thresholds assuring a controlled false-negative rate of 5% for decisions in compliance with legal limits depend on the diversity of the unit counts and weights, the level of the legal limit and the amount of material examined initially in the step-wise approach, either one or two subsamples. A procedure is proposed for examination in practice where only two subsamples, or alternatively even only one subsample, would be examined. If the resulting level of contamination exceeds the relevant threshold additional subsamples need to be examined as well. In most of the investigated cases, analytical thresholds could be established for the examination of just one subsample (500 g) taken from a sample of 2 kg. However, for ergot sclerotia in food with a legal limit of 200 mg kg−1, at least two subsamples (1000 g) need to be examined in the first step. Other groups of visually detectable undesirable substances exist which need further attention.
Graphical Abstract
Introduction
Legal limits exist for the contamination levels of visually observable undesirable substances in granular matrices, such as whole kernel cereals or bird feeds. For monitoring these substances, feed and food samples with granular materials are typically subjected to visual examination. Homogenisation of the final or laboratory sample and extraction of the required test aliquots from the sample material, which is a commonly applied procedure for chemical analysis, is not applicable due to the coarse nature of the material. Consequently, visual examination is preferably applied to the entire laboratory or final sample in feed analysis. Visual examination can be time-consuming and therefore expensive if a large amount of material has to be inspected. Therefore it is of interest to consider the consequences of examining less material for the measurement uncertainty and thus for the quality of the inspection procedure. Measurement uncertainty is one of the principal parameters to monitor the performance of analytical methods (ISO Citation2017). Although there are many differences between chemical methods such as spectroscopy and methods for visual examination, we here focus on the difference in the order of magnitude of the number of particles involved that is relevant to characterise inhomogeneity and measurement uncertainty. The consequence of the difference in the number of targeted units is an alternative statistical basis, which requires the development of an adjusted set of performance parameters for visual methods, including measurement uncertainty (Raamsdonk et al. Citation2022). In chemical analysis, the variation in real contamination level among test aliquots taken from a homogenised sample is small and is often assumed to follow a normal, or a lognormal distribution at low levels. Measurement uncertainty is usually expressed by the reproducibility standard deviation sR representing the width of the associated normal distribution. For an approach wherein a first step only part of the full sample is investigated, there will be remaining uncertainty about the contamination level in the full sample. In the method proposed in this paper, the existing inhomogeneity is used to derive analytical thresholds in order to assure a chosen probability for the true contamination level to be below the legal limit, that is, control of the false-negative rate. Measurement uncertainty is related to the contamination level, which is often expressed by the Horwitz equation (AOAC Citation2002; Horwitz and Albert Citation2006). Counts of low numbers of units of undesirable substances as found in granular matrices can be assumed to follow a discrete distribution, which could be a Poisson, a geometrical or a negative binomial distribution. This situation of low numbers of analytical units results in chance effects after subsampling to produce test aliquots, or, in other words, the degree of possible homogenisation is fundamentally limited. It can also be hypothesized that the measurement uncertainty will strongly depend on the amount of material examined, and will have higher levels than found in chemical analysis. In order to limit chance effects, recommended or mandatory sample sizes for visual methods are rather large and range from 250 g (IAG Citation2011; CEN Citation2018) to 2 kg (European Commission Citation2009a). The approach to deriving analytical thresholds based on measurement uncertainty can be contrasted with alternative approaches to set analytical thresholds at fixed percentages of the legal limit without differentiation between target materials with different measurement uncertainties.
The units targeted in the visual examination are described by two parameters: the number of units in an investigated subsample and the weight of the individual units. A larger number of units with low weights may give the result of the same concentration of the target as a low number of units with high weights. The variation in unit weights is not the same for all targets. Seeds of plants, such as Ambrosia and Datura, mentioned in European legislation, show a limited variability with typically a factor of 2 or less between the lowest and highest possible weights. Bodies produced by the mould Claviceps (ergot sclerotia or parts thereof), however, show up to a factor of 150 difference for different examination weights. These different situations call for a new strategy to calculate measurement uncertainties and to derive analytical thresholds which accommodate different distributions for the two parameters, the number of units in a subsample and unit weight.
The amount of 2 kg sample material required for examination of granular feed ingredients (European Commission Citation2013) is inconveniently large in regular monitoring programmes. However, data for analysing the inhomogeneity and calculating the measurement uncertainty of subsamples of the required amount were not available at the time. RIKILT, as the forerunner of WFSR, started to examine approximately 2 kg of sample material divided into four subsamples of equal weight in 2016. Targeted substances were Ambrosia, Datura and ergot sclerotia in whole kernel cereals and bird feeds. In this exploration phase, all four subsamples were examined regardless of the level of contamination in order to build datasets for the mentioned targets with equal data per sample. The desire to examine smaller amounts while maintaining comparable levels of risk was addressed at the level of the European Union as well in the framework of a major revision of the Regulation with analytical methods for feed monitoring (European Commission Citation2009a). This discussion was facilitated by the availability of datasets from 4 years’ examination of samples in four equal subsamples of sample material.
This paper presents the legal framework for visual inspection of undesirable substances and describes the results of the exploratory study examining four subsamples per sample over a time span of 4 years. A new simulation-based approach to characterise distributions for unit numbers and unit weights in a set of samples of a specific sample weight are presented and discussed. The resulting statistical model has been used to characterise measurement uncertainty and to calculate analytical thresholds for controlling the fraction of false-negative results based on inspecting just one or two subsamples. The application of the results in practical monitoring is discussed and options for transferring the developed approach to other targets for visual examination in feed and food monitoring are given attention.
Legal framework for monitoring
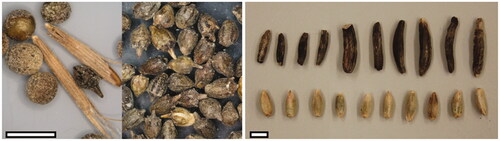
The statutory limits for botanical undesirable substances in feed are regulated in Directive 2002/32/EC (European Union Citation2002). The range of unground undesirable substances includes a large and loosely defined group described as ‘Weed seeds and unground and uncrushed fruits containing alkaloids, glucosides or other toxic substances separately or in combination including –Datura sp.’ with a limit of 3000 mg kg−1 (European Union Citation2002: section VI, item 1). A specific limit for Datura sp. seeds is established at 1000 mg kg−1. For Ambrosia seeds () a limit of 50 mg kg−1 feed is set for compound feed and feed materials consisting of unground seeds. A higher limit of 200 mg kg−1 applies to materials of two specified grass species when not fed directly to animals. The legal limits for ergot sclerotia () are different for food and feed materials. The current limit in unprocessed cereals with the exception of corn and rice intended for use as a food ingredient is 200 mg kg−1 (European Commission Citation2006b), amended by European Union (Citation2021) (Regulation (EU) Citation2021/1399)). Feed materials and compound feed containing unground cereals are limited to a level of 1000 mg kg−1 of ergot sclerotia (European Union Citation2002, section II, item 2), but a proposal to lower this to 500 mg kg−1 is in the discussion.
Figure 1. Images of targeted undesirable substances. Left: Ambrosia artemisiifolia seed surrounded with matrix material, collection of A. artemisiifolia seeds. Right: ergot sclerotia showing size diversity (top) with matrix kernels (rye seeds; bottom). Size bars 5 mm.
The representativity of the aggregate or laboratory sample is the responsibility of the competent authority and is therefore not included in the present approach. For example, a method for detection of ‘Besatz’ (impurities), including sclerotia, in cereal samples (CEN Citation2018), ignores these procedures for sample collection and quantifies the impurities in a sample rather than in a lot. The CEN method recommends starting with 1 kg of sample material, but an amount of 250 g is allowed. The scope of the CEN method does not specify its application in terms of food or feed material (CEN Citation2018). In contrast to the CEN method, a strategy to analyse the entire laboratory sample of 2 kg was chosen for the monitoring of visible undesirable substances in the whole kernel feeds (European Commission Citation2013).
Materials and methods
Visual examination and data
The samples examined for the national feed monitoring program of the Dutch Competent Authority have been used to collect the required data. The procedure for the current research is based on the analysis of whole kernel material according to the methods of IAG (Citation2011, Citation2019) and CEN (Citation2018). In principle, the methods are highly comparable and include sieving in order to retrieve fractions with comparable particle size and with removal of impurities of deviating size as part of ‘besatz’, and manual selection of weed seeds and of ergot sclerotia material. Identification is based on information from textbooks and seed atlases (Hohmann Citation2006; Cappers et al. Citation2012) and material from the WFSR reference collection. The undesirable substances Ambrosia seeds (species: A. artemisiifolia) and ergot sclerotia are shown in . A subdivision in four subsamples is a major new element in the procedure.
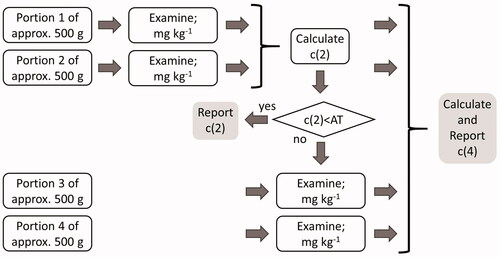
The current method includes the division of the total sample material (∼2 kg) in four equal subsamples of approximately 500 g, the examination of two subsamples including the sieving and correct identification of the selected material, and in those cases that the result exceeds the appropriate analytical threshold, the examination of the two remaining subsamples (). The final result in terms of counts and total weight of the selected units will be calculated from all examined subsamples, either two or four. This study aims at establishing the analytical thresholds for five combinations of substances and legal limits.
Figure 2. Flow chart of the monitoring procedure to establish the correct contamination level of units of undesirable substances in feeds of whole kernels.
In the current study, the entire sample of approximately 2 kg of material has been used, subdivided into four subsamples regardless of the level of contamination in order to collect sufficient data for establishing analytical thresholds. Since January 2016, 120 samples of bird feed (composed primarily of maize, sunflower, small grass seeds), and whole kernel cereals (mostly rye) received at WFSR have been split into four equal subsamples. This was done by means of a sample divider. In some cases, this resulted in three subsamples, due to insufficient size of the original sample. To ensure a balanced statistical analysis, three of the original samples that were divided into only three subsamples were ignored. Of the resulting 117 samples, 55 samples were positive for Ambrosia and 43 samples were positive for Datura. The raw data are included in Supplemental Material A (Tables A1 and A2). A set of 78 samples of whole kernel cereals has been examined for the presence of ergot sclerotia. Of these, 57 samples appeared to be positive for ergot sclerotia. An additional eight samples of bird feed were positive for ergot sclerotia as well, making a total of 65 samples positive for ergot sclerotia. For each of the four subsamples per original sample, seeds (Ambrosia, Datura) or fragments (ergot sclerotia) were counted, and the total weight of these seeds or fragments was determined, with the only exception of 20 samples of whole kernel cereals without counts (see Supplementary material A, Table A3).
Table 1. Geometric mean (GM) and geometric standard deviation (GSD) to characterise lognormal distributions of particle number (in 500 g) and particle weight estimated from available data sets.
Table 2. Estimated thresholds for screening results (one or two portions).
Table 3. Estimated probabilities of false negative results P(FN) for screening one or two portions and using thresholds that are fixed fractions of the legal limit: T = 0.5 × L or T = 0.67 × L.
Descriptive statistics based on calculated concentrations
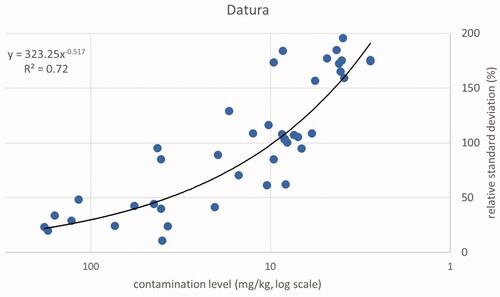
Only the positive samples have been used for the descriptive analysis. In addition, one sample was classified as an outlier due to a high weight fraction of Ambrosia and Datura seeds in one subsample, while the other three subsamples did not contain any seeds of these two species. Totals of 55 samples for Ambrosia, 43 samples for Datura and 45 samples for ergot sclerotia were included in the descriptive statistics. The combined results per sample for the contamination level expressed as concentration (weight fraction) are shown in plots of relative standard deviations related to contamination level for the three types of substances. Trend lines were calculated using the power trend function of Excel. The same function was chosen for comparability among the three datasets. Note that for the power function the reported squared correlation is the square of the Pearson correlation coefficient at the double-logarithmic scale, where the relation is linear:
Overview of a new statistical approach
For feed, a legal limit applies to concentrations
where
is the true concentration (mass fraction, weight fraction; in mg kg−1) in a 2 kg sample (European Commission Citation2009a). Concentrations are calculated as
where
is the total weight of all particles, and
is the total sample weight. In our study, the material was split into four subsamples of around 500 g each, which gives four concentrations
A weighted average of the four concentrations for the subsamples is then
which gives exactly the same result as the direct calculation, so
Such concentrations can be assumed to be without error, because all the material is examined, and weight determination is very precise. Therefore, statistical tests are not needed and samples are approved if
If fewer subsamples are analysed, the estimated concentration in one subsample is or the estimated concentration in two subsamples is
where
is the concentration in subsample
Only for results above a certain analytical threshold
it would be needed to analyse the other subsamples as well. A statistical model is needed to determine the threshold
such that there is only a limited probability, say
of not further investigating material that would have been rejected in the full sample, that is,
or
respectively. The aim of the statistical procedure is therefore to control the false-negative rate.
To establish it is needed to know the sampling distribution of
or
In analytical chemistry, one would typically rely on a normal or lognormal distribution for concentrations in any specific sample, and the standard deviation
of that distribution would be used to set the threshold, for example, as
where
is the
quantile of the standard normal distribution, for example,
Because the standard deviation is likely dependent on the level of the concentration, empirical relations have been established in analytical chemistry for
as a function of concentration
for example the Horwitz equation (Horwitz and Albert Citation2006).
However, for visual counts, this approach fails. It can be reasoned that can have very different values at the same level of
This is because the same value of
can be obtained from many small particles or few large particles. The distribution of concentration
is therefore dependent on the distributions of both the particle number in a subsample
and the individual particle weight
This behaviour was indeed observed in simulations (not shown in this paper). There is no analytical expression for the distribution of the concentration in a subsample with
particles,
However, simple distributional assumptions are possible for the input elements of this equation, and a simulation (Monte Carlo) approach can be used for numerical integration of the probability distributions for particle numbers and particle weights to derive an empirical distribution for
as described in the following subsections. All samples with complete data have been used for the statistical modelling, that is, 117 samples for Ambrosia and for Datura and 65 for ergot sclerotia.
Distributions for particle numbers and particle weights
For particle number (per subsample) a Poisson distribution is assumed. A Poisson distribution is characterised by a single parameter
(being the expected count). Multiple subsamples from the same sample will have the same
Different samples will have different levels and the variation of
between samples is assumed to be described by a lognormal distribution. A lognormal distribution can be characterised in different ways, for example, by the mean
and standard deviation
of the corresponding normal distribution, or alternatively by the geometric mean (
) and geometric standard deviation (
). We will use the latter parameterisation because of its better interpretability.
is just a number on the counting scale, and
is a factor that can be applied to get a count value corresponding with a distance of one standard deviation at the logarithmic scale. Note that an approximate 95% confidence interval on the logarithmic scale (
) corresponds to an interval
on the original count scale.
An alternative to the lognormal distribution is the gamma distribution with shape parameter and rate parameter
For interpretation, note that for a
distribution the expected value is
and the coefficient of variation (relative standard deviation) is
Parameters of a gamma distribution should be positive numbers (>0). In practice, sampling from gamma distributions requires however higher values,
and
Estimates of
from the available data were often <0.1. For this reason, the lognormal distribution for the mean particle number
was preferred.
For particle weight we also assume a lognormal distribution characterised by the geometric mean (
) and geometric standard deviation (
). The lognormal distribution was fitted to the collection of average particle weights per subsample, excluding of course the subsamples which contained no particles.
Thus, we estimated the four parameters
and
for each target from the available data. For the rejection sampling described below, we also calculated the 1st and 99th percentile of the particle weight distribution (
and
respectively).
A new simulation-based approach to characterise measurement uncertainty
Using the estimated distribution parameters for the particle number and size, large amounts of data can be simulated to represent the outcome of measuring concentration on either two subsamples (c2) or four subsamples (c4). For each of 10,000 simulated samples, mean particle numbers () were generated. Then, for each of 10,000 × 4 subsamples, the number of particles was drawn from the Poisson distribution
Simulation-based on the fitted parameters from the real data will result in most concentrations being far below the legal limit. It can be noted that concentrations very far below (or very far above) will lead to probabilities of non-conformance
(or
), and will not contribute to the estimation of the threshold
Therefore, we use rejection sampling to exclude such data from the simulations and create a simulated dataset with at least 10,000 samples in a relevant concentration range. In more detail, rejection sampling was performed as described next. Samples were rejected when they would almost certainly lead to both c2 and c4 values below the limit, that is, when the highest generated
in any of the four subsamples multiplied by a high weight
was still lower than
(The factor 2 is to convert from mg kg−1 to mg (0.5 kg)−1). For symmetry, although not so relevant in practice, samples were also rejected when they would almost certainly lead to both c2 and c4 values above the limit, that is when the lowest generated
multiplied by a low weight
was still higher than
The rejection sampling was repeated until a set of 10,000 simulated samples was obtained. In practice, this could mean that for cases with data far below the legal limit (such as Datura) all or almost all simulated samples will be rejected and that up to thousands of rounds with every 10,000 simulated samples are required before a final set of 10,000 simulated samples is obtained.
For each of the simulated particles in each of the simulated subsamples in the final set, the particle weight was sampled from the lognormal distribution
From the simulated data, concentrations were calculated for the first subsample (
), the first two subsamples (
) and for all four subsamples (
) per sample.
Calculation of an analytical threshold to control the fraction of false-negative results
As already described above, the proposed method is to analyse the results of one or two subsamples and then decide based on a threshold whether more subsamples should be analysed. The threshold value should be chosen such that the probability that no further subsamples would be analysed for non-conforming samples (the false-negative rate) remains at a low chosen value, say 5%. The simulation results for (or
) and
were classified into 100 categories for
(or
) (characterised by the mean value within each class). The exceedance probability
was calculated within each category. A logistic curve, that is,
(or
) was fitted to the tabulated data by logistic regression. In spite of the criteria used in the rejection sampling, there may still be an overwhelming majority of classes with
or
which may give numerical problems in the curve fitting (note that values in the extreme tails are not informative to estimate a logistic curve). Therefore classes with a
or
lower than half the highest concentration in the set with
were omitted. Similarly, classes with a
or
higher than twice the lowest concentration in the set with
were omitted. In any case, classes with
were retained. From the fitted logistic curve, the analytical threshold
was calculated as the concentration where the probability equals a pre-specified false-negative rate
that is,
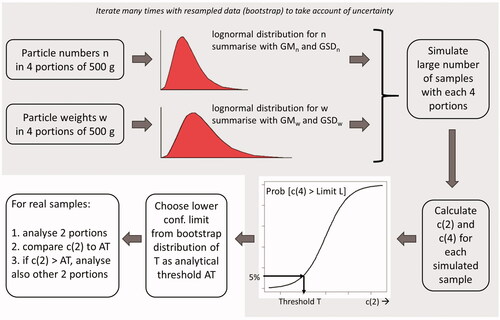
In order to estimate the uncertainty of the estimated threshold, a non-parametric bootstrap procedure was used (Efron Citation1979). The calculation of distributional parameters for particle number and particle weight
and the simulation procedure were repeated for 1000 resampled datasets (100 for Datura). As a conservative approach, a lower percentile of the uncertainty distribution (here chosen as p5) was calculated as the suggested analytical threshold (AT) for practical use ().
Figure 3. Flow chart of the bootstrap analysis to establish the analytical thresholds with a probability of 95% correct compliance.
The proposed approach was programmed in the general statistical package GenStat 19th edition (https://www.vsni.co.uk/software/genstat). The code is available in Supplemental material C.
There are various factors that might influence the result or the robustness and sensitivity of the chosen approach, that is, the variability of the result under repeated calculation with a different seed of the random generator or when using different input parameters as follows:
the number of simulated samples (here 10,000);
the number of bootstrap iterations to characterise the sampling uncertainty (here 100);
the criteria for rejection sampling (here based on the 1st and 99th percentile of the particle weight distribution);
the grouping of the simulations for the curve fitting (here 100 classes);
the criteria for omitting tails in curve fitting (here using a factor 2 as described).
Some of these factors were investigated in a robustness and sensitivity analysis (see Supplemental Material B).
Results
Full data of positive samples are provided as Supplemental Material A.
Descriptive statistics
Seeds
In total, 54 out of 116 bird feed samples contained Ambrosia seeds, of which 10 samples exceeded the legal limit of 50 mg kg−1 (data in Supplemental Material A, Table A1). Two samples contained very high levels of Ambrosia seeds, that is, more than ten times the legal limit with 661 and 758 mg kg−1 (samples 458,569 and 442,913). Datura seeds were detected in 42 out of the same set of 116 samples (data in Supplemental Material A, Table A2). The highest levels were 173 and 181 mg kg−1 (samples 461,054 and 398,904). Exceedances of the legal limit (1000 mg kg−1) were not found.
For low-weight fractions, the relative standard deviation (RSD) can be as high as 173% of the mean. Consider a sample of 2000 g of bird feed with one Ambrosia seed of 5 mg in weight. This sample is divided into four subsamples of equal size, one containing the one seed and, consequently, three subsamples without any Ambrosia seed. The average weight fraction will be 2.5 mg kg−1 with a standard deviation of 4.33 mg kg−1. This will result in an RSD of 173%. The relationship between the RSD and the mean for the samples testing positive for Ambrosia is shown in (based on Supplemental Material A, Table A1). These values indicate a lower inhomogeneity at higher weight fractions of the contaminant. The relationship between weight fraction and the relative standard deviation is best represented using a power equation considering the values for R2. The squared correlation between log (y) and log (x) was R2 = 0.84). Datura shows a comparable value (, based on Supplemental Material A, Table A2, R2 = 0.72). At weight fractions higher than about 11 mg kg−1 (Ambrosia) or 17 mg kg−1 (Datura) and a presence of one or more seeds in at least two of the four subsamples, the RSD will have a value below 100%.
Figure 4. Relative standard deviation in % as a function of correct weight fraction in mg kg−1 for all samples testing positive for Ambrosia.
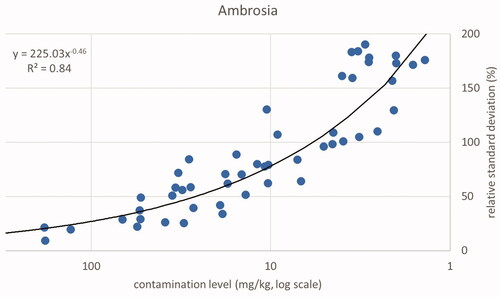
Figure 5. Relative standard deviation in % as a function of correct weight fraction in mg kg−1 for all samples testing positive for Datura.
Sclerotia fragments
Ergot sclerotia material was present in 65 out of the 86 samples of whole kernel cereals and bird feed samples. High levels (exceeding 50% of the legal limit of 1000 mg kg−1) were found in four samples of cereals (samples 443,620, 496,367, 520,680 and 580,313). Data on both the number and total weight of fragments of sclerotia is available from 45 positive samples. The weight of single fragments of sclerotia ranged from less than 1 to 150 mg (in sample 582,949) with an average of 24.8 mg per sclerotium (n = 666 fragments). In addition, eight out of the 117 samples of bird feed contained sclerotia fragments, which are comparable to the sclerotia produced by Claviceps moulds (Supplemental Material A, Table A3). A bird feed (364523, content 1053.3 mg kg−1) showed a level exceeding the statutory limit for feed (1000 mg kg−1).
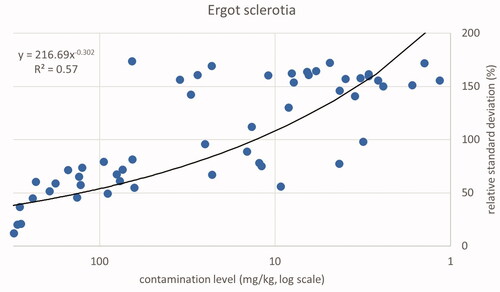
As was observed for seeds a comparable trend for sclerotia fragments in cereal samples was found in terms of a lower relative standard deviation at higher contamination levels. All samples with a relative standard deviation higher than 100% showed a contamination level below 65 mg kg−1. The next level found was 63.1 mg kg−1 (sample 530129) with an RSD of 56%. The estimated level of contamination above which values for RSD below 100% can be expected to exceed a level of 65 mg kg−1. The relation between the level of contamination and the relative standard deviation is illustrated in . The correlation between the logarithm of the contamination level and the logarithm of the relative standard deviation is R2 = 0.57, which is substantially lower than those found for Ambrosia and Datura, due to the higher diversity of weights of the sclerotia compared to seeds.
Figure 6. Plot of correct weight fractions in mg kg−1 (x-axis) and relative standard deviations in % (y-axis) for all samples of cereals testing positive for ergot sclerotia (dots). The trend line, its equation and correlation coefficient applies to the set of cereal samples.
Variability of particle numbers and weights
The variability of particle numbers per type of contamination was characterised by lognormal distributions, with parameters and
Similarly, the variability of particle weights per type of contamination was also characterised by lognormal distributions, with parameters
and
The estimated parameters of the distributions for particle number and particle weight are given in . It can be seen that all three kinds of particles occur on roughly equal levels of around one particle per subsample, but that the variability of particle numbers between samples increases from ergot via Datura to Ambrosia. The mean particle size increases from Ambrosia via Datura to ergot, whereas the variation in particle weight is much higher for ergot than for Ambrosia and Datura.
Analytical thresholds and false negative rates
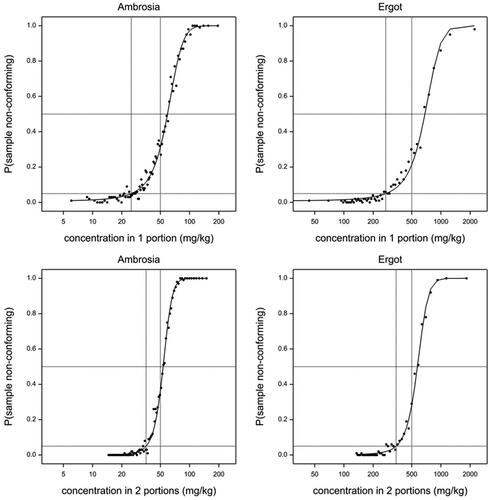
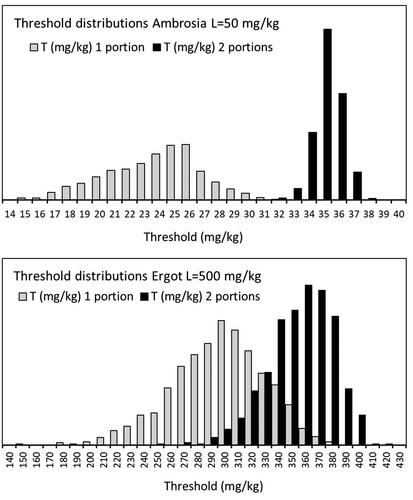
Application of the simulation model leads to fitted logistic curves for the probability of a non-conforming sample conditional on the result from screening two subsamples such as shown in for two example targets, Ambrosia (L = 50) and ergot (L = 500). Similar curves but shifted to the left were obtained for analysing one subsample. Note that the curve fits shown are for the simulations from the original data, but similar curve fits were made for simulations from each of the resampled data sets.
Figure 7. Fitted logistic curves from example simulated datasets for Ambrosia (L = 50 mg kg−1) and ergot (L = 500 mg kg−1). The horizontal dashed lines are at probabilities 0.05 and 0.5. The vertical dashed lines are at the calculated threshold T and at the legal limit L.
The estimated thresholds are characterised by the 5th, 50th and 95th percentiles shown in . For Ambrosia and ergot, 1000 bootstrap iterations were used to characterise the sampling uncertainty, for Datura this was restricted to 100 bootstrap iterations for computational reasons (see Section “Discussion”). For two examples, Ambrosia and ergot (L = 500), the distributions are illustrated in .
Figure 8. Uncertainty due to number of examined portions is shown in distributions (representing 1000 resampled datasets) of calculated thresholds T for the targets Ambrosia (L = 50 mg kg−1) and ergot (L = 500 mg kg−1) after screening one or two portions. Axis labels indicate maximum T values (in mg kg−1) in each plot.
To account for the uncertainty due to the limited number of samples available, the 5th uncertainty percentile is suggested as an analytical threshold (AT) for practical use thus providing a reliable result with at least 95% probability.
The results in show a much larger sampling uncertainty for ergot (all targets) than for Ambrosia and Datura. This is primarily due to the much higher variability of the particle weight ( = 2.6 for ergot instead of 1.2–1.4). Note that in a lognormal distribution
is roughly the factor to find a high (p97.5) value. This factor is therefore 7 for ergot vs max. 2 for Ambrosia/Datura. The relatively low number of samples (n = 65 for ergot vs. n = 117 for Ambrosia and Datura, respectively) might have contributed.
In regulatory discussions, it has been suggested to use thresholds that are a fixed fraction of the legal limit. shows the estimated false-negative rates that would correspond with suggested thresholds of 50% or 67% of L after screening one or two subsamples of 500 g. It can be seen that expected false-negative rates would be very variable across targets, which is due to the different underlying characteristics of the particle number and particle size distributions.
Discussion
Visual monitoring is relevant in the control of feed and food
A range of toxic compounds originating from plants and moulds is identified as hazards in the feed and food production chains (EFSA Citation2007, Citation2008, Citation2012a; Colegate and Stegelmeier Citation2012). In certain cases, the monitoring of plants or most notably seeds and mycelium bodies of moulds is applied for guarding feed and food safety (Raamsdonk et al., Citation2009). Among the first documented cases of food poisoning caused by infested plant ingredients is the consumption of bread from cereals infested by ergot sclerotia (mycelium bodies of the mould Claviceps) in northern Norway early in the 17th century (Alm Citation2003) and in New England in the late 17th century (the Salem witchcraft trials; Woolf Citation2000), among other cases (Scott Citation2009). The intoxication symptoms were already known as Saint Anthony’s fire from the Middle Ages (Lee Citation2009). After an outbreak in France (Pont St. Esprit; Lorenz and Hoseney Citation1979; Scott Citation2009) in 1951 increased attention was given to the analysis of ergot alkaloids. These alkaloids are principally produced in the sclerotia, but ergot alkaloids were occasionally detected in visually non-detectable infestations of cereal samples, and sclerotia were found without any detectable level of ergot alkaloids (Mulder et al. Citation2012). ergot content in individual sclerotia can vary considerably (Lorenz and Hoseney Citation1979; EFSA Citation2005; Krska and Crews Citation2008; Scott Citation2009; EFSA Citation2012b). Although alkaloids are the primary cause of disease symptoms, the detection of sclerotia is currently the target of the official control of feed and food. Another issue is the tropane alkaloids originating primarily from seeds and roots of plants of several families. The highest concentrations are found in members of the family Solanaceae. The first incidence of intoxication with jimsonweed (‘Jamestown weed’; Datura stramonium) was documented in 1676 in Jamestown, USA, and a range of more recent occasions has been reported (Adamse et al. Citation2014). Ambrosia is included in Directive 2002/32/EC for its production of highly allergenic pollen (D’Amato et al. Citation2007; Frick et al. Citation2011).
Chemical measurement uncertainty approaches are not suitable for visual methods
Measurement uncertainty is a well-known performance characteristic in the domain of quantitative analysis and testing for feed and food safety. Several sources of measurement uncertainty can be distinguished, such as the laboratory conditions, nature of the method, equipment, the technician, the quality of reference materials, and the condition of the sample (Korol et al. Citation2015). As an example of the importance of the type of sample, mycotoxins can occur in clusters or nuggets in a sample. These situations indicate that homogenization is important and specific procedures are designed (Reiter et al. Citation2011). For aflatoxins, slurry mixing with water revealed a sufficient homogeneity (Reiter et al. Citation2009). Slurry mixing, as is grinding, is obviously not applicable for visible units in whole kernel feeds or feed materials. These options for homogenization result in acceptable levels not exceeding the relative reproducibility standard deviations of 5.7% for a contamination level of 0.1% (w/w), 8% at 0.01% and 11% at 0.001% (AOAC Citation2002; in Gustavo González and Ángeles Herrador Citation2007). These levels can be translated to maximum measurement uncertainty limits for chemical detection methods of 11%, 16% and 22% at the same contamination levels (Codex Alimentarius Citation2004).
The situation for visual detection methods differs from mainstream analytical chemistry. Ambrosia and Datura material are present in units of large size: whole seeds. The weight of an Ambrosia seed varies between 4 and 7 mg, and that of a Datura seed between 5 and 10 mg. Note that the difference between counting 1 seed or 2 seeds in different subsamples of a sample is an increase of 100%, resulting in a standard deviation that is larger than the mean (relative standard deviation larger than 100%). At higher seed counts, a difference of 1 seed is an increasingly smaller percentage and the relative standard deviation will gradually be lower. In the particular case of plant seeds or sclerotia, inhomogeneity remains the primary element in measurement uncertainty for this class of visual detection methods. The current analytical results for visual undesirable substances reveal that relative standard deviations occur, based on the trend lines in , which are much larger than the acceptable relative standard deviations in analytical chemistry for comparable analytical levels, and much larger than uncertainty ranges found in practice (Korol et al. Citation2017). The analysis of duplicate aliquots taken from a homogenous batch of material, as common procedures in chemical analysis, appeared to be not transferable to the detection of plant seeds and ergot sclerotia in the whole kernel feeds for the same reason – inhomogeneity – and in the absence of true duplicates, representing equal contamination levels, a value for the parameter repeatability cannot be calculated for whole kernel matrices. An alternative procedure for assessing reproducibility is to reintroduce the selected, counted and weighted units of the undesirable substance in the feed matrix, let the units and the matrix material settle for a week to reach a situation of balanced moisture in both types of material and examine the total sample again. This would ideally result in identical (count) or highly comparable (weight) results, which obviously can only represent reproducibility circumstances (Raamsdonk et al. Citation2012). This dedicated procedure is typically used in validation procedures and in proficiency testing.
Introduction of new parameters: count dispersal and weight uncertainty
The different background and application of quality parameters resulted in the initiative of WFSR and IAG section Feed Microscopy to develop a standard for quality assurance and control. These Guidelines include a description of the theoretical background, sets of quality parameters for different types of analytical methods, method design and quality control, and in a separate part layouts of validation studies (Raamsdonk et al. Citation2022). One issue is to avoid the term measurement uncertainty for its different information content in visual methods. As an alternative, two terms are being proposed: count dispersal and weight uncertainty, for indicating the difference between results in terms of numbers or as weights (Raamsdonk et al. Citation2022). Besides the argumentation from the perspective of levels of homogeneity and data handling, the statistical background differs as well.
In chemical analysis, estimated levels of the analyte often conform to a normal or lognormal distribution. Similar to visual examinations, chemical detection methods also detect numbers of particles, in that case molecules, that are directly converted into a weight content in the evaluation of the primary result. However, the numbers of units in visual detection are much lower than in chemical analysis (where they are in the range of 1012 or more). With very high numbers there will no longer be relevant variability between subsamples (sufficient homogenisation). For visual examinations where even a single particle (n = 1) can be detected, it is essential to account for the statistical variation of counts and weights separately. The counts will follow a Poisson distribution for subsamples from a single batch, but allowing for variation between samples in a collection of samples a lognormal or gamma distribution was found to be appropriate. Skew distributions are expected for weight results as well and here a lognormal distribution was also found satisfactory. The estimation of count dispersal and weight uncertainty, as alternative parameters for measurement uncertainty in visual examination methods, can be based on these statistical derivations. This principle has been applied for the modelling of the distribution of the results for seeds of Ambrosia and Datura, and for ergot sclerotia.
The proposed approach cannot be described in terms of screening and confirmation
There are both similarities and differences between the two-step approach proposed here and the screening-confirmation paradigm often used in analytical chemistry. In analytical chemistry, a strategy of applying a screening method followed by a confirmation method when the result exceeds a detection limit for screening (CCβ) is frequently applied (European Commission Citation2006a; European Commission Citation2021). A screening method is primarily applied for avoiding false-negative results () with a high throughput, frequently based on a qualitative or semi-quantitative protocol, for example, a bioassay. Precise identification of the target is not necessary. A confirmation method should be able to precisely identify the target and should comply with performance parameters such as trueness/recovery, precision, and a decision limit (CCα). Even in the situation of a full quantitative screening method, this result is not part of the finally established contamination level of the target in the sample as produced by the confirmation method.
In the protocol of visual examination as presented here, there are also two steps, where the second examination is only performed if the result from the first examination exceeds an analytical threshold. Similar to the screening step in analytical chemistry, the analytical threshold is meant to control the rate of false-negative results (). However, there are principal differences. The procedure per subsample of the initial examination is exactly the same as the procedure per subsample of the extended examination when the first result exceeds the analytical threshold. All units selected from any number of subsamples, as far as examined, contribute to the final result. In addition to the desire to control the rate of false-negative results, the examination of additional subsamples is meant to compensate for the large inhomogeneity among subsamples as well. The currently proposed procedure is comparable to the microscopic examination of processed animal proteins in feed (Annex VI in European Commission Citation2009a) where a second determination is needed when the first result exceeds a threshold, in that protocol indicated as ‘decision limit’. Neither the term screening nor confirmation has been used to indicate the two determination cycles in that microscopic protocol. We, therefore, avoid these terms also in our approach.
Applicability of the statistical model
A simulation-based model was presented to calculate an analytical threshold for concentrations from visual counts and weighing for use in a screening procedure based on only one or two out of four subsamples. Analytical thresholds were chosen such that the Type 1 error rate, that is, the probability of erroneously concluding conformity with the legal limit was restricted to a low value (here ). A simulation approach has been used because to our best knowledge there is no analytical approach to estimate the variability of concentrations derived from low counts of particles and their weight in samples. The variability of the estimated concentration will increase both with a higher number of particles and higher particle weight, but in a different way.
It should be realised that the model to set a threshold is adaptive to the data set used, or more precisely, to the parameter values of the lognormal distributions for particle size and weight as extracted from the available datasets. The model is designed to have the required statistical properties for samples from a sample population that would correspond with the samples in the analysed data set. In other words, when another sample population would be considered, the model would suggest another threshold.
The threshold is estimated from a logistic curve fitted to simulated data in an appropriate range. As explained in the Methods section, rejection sampling was used in the simulations to obtain enough relevant data points. For targets where the real data have concentrations that are far below the legal limit, such as Datura in this study, very many iterations of rejection sampling have to be made which leads to a huge computational load. For Datura after one subsample the number of rejection sampling iterations was around 4000 (note that this was to be applied in each of the uncertainty iterations) in comparison to 2–6 rejection sampling iterations for Ambrosia and ergot targets. For this computational reason, the number of bootstrap iterations was restricted to 100 for the Datura target. In practice, thresholds for Datura could be set lower because the exceedance of the limit is hardly ever expected based on current experience.
Considering the fitted logistic curves (see ), it might seem logical that the probability of non-conformity should be 0.5 if the estimate based on, for example, two subsamples (c2) would be exactly equal to the legal limit. However, c2 is an average of two, c4 is an average of four subsamples including these two. Moreover, we want to predict c4 from c2, so we are in a regression situation, where the optimal prediction is always shrinking towards the mean value in the population. Thus, the expected c4 is not L when c2 = L, but biased in the direction of the average concentration in the sample collection (which is in all cases examined lower than L). Consequently, the logistic curve was fitted with an intercept rather than forced through the point (L, 0.5), as shown in .
Minimum amount of material needed to control the false negative rate depends on the type of undesirable substance
The results show that the target type of material has a strong influence on the results. Ergot sclerotia are larger and much more variable. Therefore more material is needed to check conformity with the legal limit. Our results show an estimated threshold of 0 and therefore examination of one subsample appears to be insufficient to control a legal limit of 200 mg kg−1. The differences between the three substances included in this study regarding the relationship between contamination level and relative standard deviation () were a first indication of the need to develop thresholds case-by-case. Extrapolation to other situations, either other circumstances or designs, or other types of undesirable substances, might need alternative strategies. It is possible but has to be demonstrated, that the statistical approach could be applicable to other cases as well.
Suggestions for further research
In the group of physically undesirable substances, two different situations can exist. In this paper, we have evaluated the case where data on counts and weights can be collected. The alternative situation is that a final weight of the units or fragments can be established, without a count of the units. An example of this second situation is the detection of remnants of packaging material in former food products. Several fragments can stick together and the diversity of weight per unit is even larger than found for ergot sclerotia.
The approach of examining two subsamples and, if the result exceeds the applicable analytical threshold, examination of the other two subsamples (), has been adopted as the preferred method for a proficiency test on quantifying the contamination levels of ergot sclerotia (Peereboom et al. Citation2021). Due to unavoidable inhomogeneity, as explained in this paper, samples for PTs on methods for whole kernel matrices are not drawn from a general batch but spiked independently. This means that there is no general true value, applicable to all samples, but an a priori known spike amount and weight of the undesirable substance per sample (Raamsdonk et al. Citation2022). The logical consequence is the evaluation of the results per sample. The study design was intended to comply with the ISO Standard for organising and evaluating PTs (ISO Citation2010). The independent but comparable background of the samples complies with clauses 3.7 and 4.4.3 of that Standard. Annex B.3 of ISO (Citation2010) provides several options for evaluating results. Some of these options appear to be applicable to the specific situation of granular matrices. The standard deviations between the spiked and reported results after examination of two subsamples (50% of the total sample amount) were considerably larger compared to the examination of the entire sample (in four subsamples). This is predominantly a representation of the inhomogeneity level, in view of the good performance of the participants for the entire sample. These results illustrate the need to examine a sample as large as reasonable, with appropriate analytical thresholds to examine additional material. It also indicates the importance of a good and well-established procedure for collecting the aggregate sample and the reduction to the laboratory sample (Annex I in European Commission Citation2009b). This PT also illustrates the compliance of dedicated evaluation methods for visible undesirable substances with ISO 17043 (ISO Citation2010).
A proficiency test was organised by WFSR on behalf of IAG section Feedstuff Microscopy in 2019 for the detection of packaging materials in bakery by-products (Raamsdonk et al. Citation2020). The evaluation of the results was complicated by the situation that the nature of the undesirable substance, the remnants of the packaging material, does not allow for collecting results in terms of counts. The approach as discussed in this paper to derive analytical thresholds related to sample sizes, based on both count dispersal and weight uncertainty, is therefore not applicable. Despite this, data is needed for exploring weight uncertainty for this type of physical substance. In addition, other matrices occur, such as fat or liquid materials with different viscosities and compositions, and the presence of microplastic in the food production chain. This array of other materials with physical undesirable substances results from innovations in the framework of circular agronomy, which needs better valorisation of former food products than currently achieved, provided that the contamination with packaging material will be within limits (Annex III in Regulation (European Commission Citation2009b; Raamsdonk et al. Citation2011). This framework points to an urgent requirement of additional research for principles of method development and validation for the detection of physical particles in former food products.
Conclusions
We have designed a method for optimal examination of weed seeds and ergot sclerotia in whole grain cereals and bird feed by examining four subsamples out of a sample of approximately 2 kg. This method was in its first stage intended to collect data on inhomogeneity. This data has been used to derive analytical thresholds as decision levels after the initial examination of either one or two subsamples. In cases of exceedance of the initial result of this threshold one or two additional subsamples are to be examined in future monitoring practices. In all cases, the final result is based on the result of all examined subsamples. After the initial examination of only one instead of two subsamples, the analytical thresholds are lower and therefore more samples will need additional examination.
The analysis of samples of approximately 2 kg in four subsamples of approximately 500 g provided a good overview of inhomogeneity. This study is the first to produce datasets on inhomogeneity for visually detectable undesirable substances. Homogenisation along procedures known for chemical analyses is not applicable, and dedicated approaches are needed for visual research. The inhomogeneity among subsamples is based on the number of particles and the weight diversity among the particles, and in order to define measurement uncertainty properly, this term is replaced by count dispersal and weight uncertainty for visual examination methods.
The presence of datasets for Ambrosia seeds, Datura seeds and ergot sclerotia with counts and average unit weights over four subsamples per sample allowed to model the relationship between contamination level and the probability to exceed the legal limit after examination of one or two subsamples. For each of the three substances in relation to a legal limit, a logistic curve could be fitted to describe the probability of having a non-conforming 2 kg sample as a function of the result obtained for either one or two subsamples. The analytical thresholds assuring a correct decision on compliance with legal limits with a 95% probability are dependent on the estimated statistical distributions of unit numbers and weights, the amount of material examined and the level of the legal limit. In most cases, analytical thresholds in terms of mg kg−1 could be established for the examination of one subsample (500 g) taken from a sample of 2 kg. However, for ergot sclerotia in food with a legal limit of 200 mg kg−1, the analytical threshold for using just one subsample was 0 mg kg−1, indicating that at least two subsamples (1000 g) need to be examined.
True contamination levels higher than approximately 20 mg kg−1 (Ambrosia and Datura) or approximately 65 mg kg−1 (ergot sclerotia) are shown to have relative standard deviations below 100%. These levels are much higher than accepted in chemical analyses and are dependent on the variation in unit weights, which is larger for sclerotia fragments (1–150 mg, an average of 25 mg; n = 666) than for seeds within a species.
In addition to seeds and sclerotia, other groups of undesirable substances exist as whole units. Packaging material in former food products is a substance that does not allow the counting of units. In the view of circular agronomy, former food products need reapplication, for instance as feed ingredients, and the collection of data on inhomogeneity in this type of commodities needs urgent attention.
Supplemental Material
Download Zip (647.1 KB)Acknowledgements
We thank our colleagues J. de Jong, M. de Nijs and A. Verschoor (WFSR) for facilitating this study.
Disclosure statement
No potential conflict of interest was reported by the author(s).
Additional information
Funding
References
- Adamse P, Egmond Hv, Noordam MY, Mulder PPJ, Nijs Md. 2014. Tropane alkaloids in food: poisoning incidents. Qual Assur Saf Crops Foods. 6(1):15–24. doi:https://doi.org/10.3920/QAS2013.0314
- Alm T. 2003. The witch trials of Finnmark, northern Norway, during the 17th century: evidence for ergotism as a contributing factor. Econ Bot. 57(3):403–416. doi:https://doi.org/10.1663/0013-0001(2003)057[0403:TWTOFN2.0.CO;2]
- AOAC. 2002. Guidelines for single laboratory validation of chemical methods for dietary supplements and botanicals. Rockville (MD): AOAC.
- Cappers RTJ, Bekker RM, Jans JEA. 2012. Digitale Zadenatlas van Nederland [Digital seed atlas of the Netherlands]. Groningen (The Netherlands): Barkhuis.
- CEN. 2018. EN 15587 cereals and cereal products - determination of Besatz in wheat (Triticum aestivum L.), durum wheat (Triticum durum Desf.), rye (Secale cereale L.) and feed barley (Hordeum vulgare L.). Pilsen (Czech Republic): European Standards.
- Codex Alimentarius. 2004. Guidelines on measurement uncertainty. Geneva (Switzerland): WHO.
- Colegate SM, Stegelmeier BL. 2012. Dietary exposure of livestock and humans to hepatotoxic natural products. In: Fink-Gremmels J, editor. Animal feed contamination. Cambridge (UK): Woodhead Publishing Ltd.; p. 352–382.
- D’Amato G, Cecchi L, Bonini S, Nunes C, Annesi-Maesano I, Behrendt H, Liccardi G, Popov T, van Cauwenberge P. 2007. Allergenic pollen and pollen allergy in Europe. Allergy. 62(9):976–990. doi:https://doi.org/10.1111/j.1398-9995.2007.01393.x
- Efron B. 1979. Bootstrap methods: another look at the jackknife. Ann Stat. 7(1):1–26. doi:https://doi.org/10.1214/aos/1176344552
- EFSA. 2007. Assessment of plants/herbs, plant/herb extracts and their naturally or synthetically produced components as “additives” for use in animal production. CFT/EFSA/FEEDAP/2005/01. doi:https://doi.org/10.2903/sp.efsa.2007.ZN-001
- EFSA. 2005. Opinion of the scientific panel on contaminants in food chain on a request from the commission related to ergot as undesirable substance in animal feed. EFSA J. 225:1–27. https://www.efsa.europa.eu/en/efsajournal/pub/225.
- EFSA. 2008. Ricin (from Ricinus communis) as undesirable substances in animal feed. Scientific Opinion of the Panel on Contaminants in the Food Chain. EFSA J. 726:1–38.
- EFSA. 2012a. Compendium of botanicals reported to contain naturally occurring substances of possible concern for human health when used in food and food supplements. EFSA J. 10(5):2663–2722. doi:https://doi.org/10.2903/j.efsa.2012.2663. https://www.efsa.europa.eu/en/microstrategy/botanical-summary-report.
- EFSA. 2012b. Scientific opinion on ergot alkaloids in food and feed. EFSA Panel on Contaminants in the Food Chain (CONTAM). EFSA J. 10(7):2798. doi:https://doi.org/10.2903/j.efsa.2012.2798
- European Commission. 2006a. Commission Regulation (EC) No 401/2006 of 23 February 2006 laying down the methods of sampling and analysis for the official control of the levels of mycotoxins in foodstuffs. Off J European Union. 70:12–53.
- European Commission. 2006b. Commission Regulation (EC) No 1881/2006 of 19 December 2006 setting maximum levels for certain contaminants in foodstuffs. Off J European Union. 364:5–33.
- European Commission. 2009a. Commission Regulation (EC) No 152/2009 of 27 January 2009 laying down the methods of sampling and analysis for the official control of feed. Off J European Union. 54:1–130.
- European Commission. 2009b. Regulation (EC) No 767/2009 of the European Parliament and of the Council of 13 July 2009 on the placing on the market and use of feed, amending European Parliament and Council Regulation (EC) No 1831/2003 and repealing Council Directive 79/373/EEC, Commission Directive 80/511/EEC, Council Directives 82/471/EEC, 83/228/EEC, 93/74/EEC, 93/113/EC and 96/25/EC and Commission Decision 2004/217/EC. Off J European Union. 229:1–41.
- European Commission. 2013. Commission Regulation (EU) No 691/2013 of 19 July 2013 amending Regulation (EC) No 152/2009 as regards methods of sampling and analysis. Off J European Union. 197:1–12.
- European Commission. 2021. Commission Implementing Regulation (EU) 2021/808 of 22 March 2021 on the performance of analytical methods for residues of pharmacologically active substances used in food-producing animals and on the interpretation of results as well as on the methods to be used for sampling and repealing Decisions 2002/657/EC and 98/179/EC. Off J European Union. 180:84–114.
- European Union. 2002. Directive 2002/32/EC of the European parliament and of the council of 7 May 2002 on undesirable substances in animal feed. Off J European Union. 140:10–22.
- European Union. 2021. Commission Regulation (EU) 2021/1399 of 24 August 2021 amending Regulation (EC) No 1881/2006 as regards maximum levels of ergot sclerotia and ergot alkaloids in certain foodstuffs. Off J European Union. 301:1–5.
- Frick G, Boschung H, Schulz-Schroeder G, Russ G, Ujčič-Vrhovnik I, Jakovac-Strajn B, Angetter D, John I, Jørgensen JS. 2011. Ragweed (Ambrosia sp.) seeds in bird feed. Biotechnol Agron Soc Environ. 15(S1):39–44.
- Gustavo González A, Ángeles Herrador M. 2007. A practical guide to analytical method validation, including measurement uncertainty and accuracy profiles. Tr Anal Chem. 26(3):227–238. doi:https://doi.org/10.1016/j.trac.2007.01.009
- Hohmann B. 2006. Mikroskopische Untersuchung Pflanzlicher Lebensmittel Und Futtermittel. Hamburg (Germany): Behr’s Verlag.
- Horwitz W, Albert R. 2006. The Horwitz Ratio (HorRat): a useful index of method performance with respect to precision. J AOAC International. 89(4):1095–1109. doi:https://doi.org/10.1093/jaoac/89.4.1095
- IAG. 2011. Method for the determination of ergot (Claviceps purpurea Tul.). Hameln (Germany): International Association of Feedingstuff Analysis.
- IAG. 2019. Method for the determination of fruits and seeds of Ambrosia spp. Hameln (Germany): International Association of Feedingstuff Analysis.
- ISO. 2010. Conformity assessment - general requirements for proficiency testing. Brussels (Belgium): European Committee for Electrotechnical Standardization. Ref. No. EN ISO/IEC 17043:2010 E.
- ISO. 2017. General requirements for the competence of testing and calibration laboratories. Geneva (Switzerland): International Organization for Standardization. Ref. No. ISO/IEC 17025:2017(E).
- Korol W, Bielecka G, Rubaj J, Walczyński S. 2015. Uncertainty from sample preparation in the laboratory on the example of various feeds. Accred Qual Assur. 20(1):61–66. doi:https://doi.org/10.1007/s00769-014-1096-x
- Korol W, Rubaj J, Bielecka G, Walczyński S, Reszko-Zygmunt J, Dobrowolski R. 2017. Criteria for using proficiency test results for estimation of measurement uncertainty: feed analysis example. Accred Qual Assur. 22(2):83–89. doi:https://doi.org/10.1007/s00769-017-1252-1
- Krska R, Crews C. 2008. Significance, chemistry and determination of ergot alkaloids: a review. Food Addit Contam Part A Chem Anal Control Expo Risk Assess. 25(6):722–731. doi:https://doi.org/10.1080/02652030701765756
- Lee MR. 2009. The history of ergot of rye (Claviceps purpurea) I: from antiquity to 1900. J R Coll Physicians Edinb. 39(2):179–184.
- Lorenz K, Hoseney RC. 1979. Ergot on cereal grains. CRC Crit Rev Food Sci Nutr. 11(4):311–354. doi:https://doi.org/10.1080/10408397909527267
- Mulder PPJ, Raamsdonk LWDv, Egmond Hv, Horst Tvd, Jong Jd. 2012. Ergot alkaloids in animal feed. Results of a survey in The Netherlands. Wageningen (The Netherlands): Wageningen Food Safety Research. Report no. 2012.005.
- Peereboom DPKH, Hedemann JBGM, Smits CPAF, Nijs Md, Raamsdonk LWDv. 2021. Proficiency test for ergot sclerotia in cereals. Wageningen (The Netherlands): Wageningen Food Safety Research. Report no. 2021.002. doi:https://doi.org/10.18174/541805
- Raamsdonk LWDv, Rijk R, Schouten GPJ, Mennes W, Meijer GAL, Poel Avd, Jong Jd. 2011. A risk evaluation of traces of packaging materials in former food products intended as feed materials. Wageningen (The Netherlands): RIKILT. Report no. 2011.002.
- Raamsdonk LWDv, Frick G, Ujcic Vrhovnik I, Zadravec M, Zegers J, Krull-Wöhrmann R, Weiss R. 2022. Quality assurance and control of visual methods for feed and food inspection. Part 1: theory and principles, Part 2: Validation. Wageningen (The Netherlands): Wageningen Food Safety Research.
- Raamsdonk LWDv, Smits CPAF, Hedemann B. 2020. Proficiency test of detection of packaging material in bakery by-products 2019. Wageningen (The Netherlands): Wageningen Food Safety Research. Report no. 2020.022. doi:https://doi.org/10.18174/543274
- Raamsdonk LWDv, Vancutsem J, Jorgensen JS. 2009. A survey on the presence of undesirable botanical substances in feed in the European Union. Biotechnol Agron Soc Environ. 13(S):33–38.
- Raamsdonk LWDv, Pinckaers V, Vliege JM, Egmond Hv. 2012. Examination of packaging materials in bakery products. A validated method for detection and quantification. Wageningen (The Netherlands): RIKILT. Report no. 2012.007.
- Reiter EV, Zentek J, Razzazi E. 2009. Review on sample preparation strategies and methods used for the analysis of aflatoxins in food and feed. Mol Nutr Food Res. 53(4):508–524. doi:https://doi.org/10.1002/mnfr.200800145
- Reiter EV, Dutton MF, Agus A, Nordkvist E, Mwanza MF, Njobeh PB, Prawano D, Häggblom P, Razzazi-Fazeli E, Zentekab J, et al. 2011. Uncertainty from sampling in measurements of aflatoxins in animal feedingstuffs: application of the Eurachem/CITAC guidelines. Analyst. 136(19):4059–4069. doi:https://doi.org/10.1039/c1an15124j
- Scott PM. 2009. Ergot alkaloids: extent of human and animal exposure. World Mycotoxin J. 2(2):141–149. doi:https://doi.org/10.3920/WMJ2008.1109
- Woolf A. 2000. Witchcraft or mycotoxin? The Salem witch trials. J Toxicol Clin Toxicol. 38(4):457–460. doi:https://doi.org/10.1081/clt-100100958