
Abstract
Plant-based dietary supplements may contain undesirable contaminants such as polycyclic aromatic hydrocarbons, dioxins and dioxin-like polychlorinated biphenyls (dl-PCBs) due to the sources of raw materials or processing methods used. The presence of these contaminants in a series of herbal supplements sold on the Ghanaian market for improving sexual performance was examined using the DR CALUX® bioassay in combination with GC-HRMS analysis. Overall, cell responses at 4 and 48 h exposure to extracts prepared without an acid-silica clean-up were relatively higher than the responses obtained from extracts prepared with an acid-silica clean-up. This indicated that the 40 supplements contained only low levels of stable aryl hydrocarbon receptor (AhR) agonists like polychlorinated dibenzo-p-dioxins and dibenzofurans (PCDD/Fs) and dl-PCBs, while some contained substantial amounts of less stable AhR-agonists. Ten supplements selected for confirmation with GC-HRMS analysis contained PCDD/Fs and dl-PCBs at levels ranging from 0.01 to 0.19 pg toxic equivalent (TEQ)/g only, while the level of the sum of 4 polycyclic aromatic hydrocarbons (Σ4PAHs) representing less stable AhR agonists, ranged from not detected (ND) to 25.5 ng/g. These concentrations were in line with the responses observed in the DR CALUX® bioassay. The concentration of PCDD/Fs and dl-PCBs corresponded to estimated daily intakes (EDIs) ranging from 0.01 to 1.20 pg TEQ/day, or 0.001 to 0.12 pg TEQ/kg bw/week for a 70 kg bw consumer, which was below the established tolerable weekly intake (TWI) of 2 pg TEQ/kg bw/week, thus indicating low concern for consumers’ health. Similarly, the EDIs based on the detected Σ4PAHs in supplements ranged from 7.2 to 111 ng/day, or 0.1 to 1.6 ng/kg bw/day, which corresponded to MOE values above 10,000, indicating a low health concern.
Graphical Abstract
Introduction
In many parts of the world and especially in Africa, individuals depend on herbal medicinal plants and supplements as an alternative to their primary healthcare needs. Also in Ghana, there is substantial use of plant-based supplements due to socio-cultural and economic reasons. These products come in different forms (e.g. decoctions, powders, liquids, capsules, tablets, ointments, and creams) and are available at various retail shops (e.g. open markets, kiosks, pharmacies and chemical shops) across the country. To extend their shelf-life, the majority are sun dried or smoked over open fires to reduce the moisture content before being sold in their crude state or further processed into other forms. These production processes may pre-dispose finished products to contain certain undesirable contaminants such as polycyclic aromatic hydrocarbons (PAHs), dioxins (polychlorinated dibenzo-p-dioxins and dibenzofurans (PCDD/Fs)) and dioxin-like polychlorinated biphenyls (dl-PCBs) when conditions (such as high temperature, low oxygen) and applied fuels are favourable for their formations (Lohmann et al. Citation2000; WHO Citation2002; Hoogenboom et al. Citation2012). Also, these contaminants may occur in herbal products when raw materials are harvested from polluted/contaminated sites and production amidst heavily industrialized areas (Schuler et al. Citation1997; Loutfy et al. Citation2010).
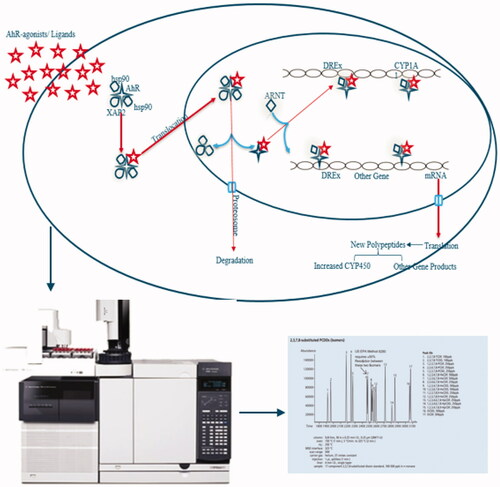
The PCDD/Fs of concern are those composed of two benzene rings with chlorine atoms linked together by one or two oxygen atoms. The toxicity and level of persistence of these compounds are dependent on the number and position of the chlorine atoms. The name dioxin-like PCBs relates to compounds with structural similarities to PCDD/Fs and similar mode of action, proceeding via stimulation of the aryl hydrocarbon receptor (AhR) pathway (Nebert et al. Citation1993; White and Birnbaum Citation2009; Tuomisto Citation2019). The intensity at which these agonists bind to the AhR, inducing the related effects determines their relative toxic potencies, where 2,3,7,8-tetrachlorodibenzo-p-dioxin (TCDD) is considered one of the most toxic congeners and therefore assigned a Toxic Equivalency Factor (TEF) value of 1. The TEF for six other PCDDs, ten PCDFs and twelve dl-PCBs were derived from in vitro and in vivo studies concerning the index chemical (i.e. 2,3,7,8-TCDD) (Van den Berg et al. Citation2006). In practice, the determined concentrations of the individual congeners are multiplied by the TEF values for each congener and summed to derive the toxic equivalents (TEQ) content. Thus, the total TEQ content expresses the toxicity as if the mixture consists of pure TCDD (Van den Berg et al. Citation1998; Commission Regulation (EC) No 1881/Citation2006).
PAHs are common environmental contaminants which consist of only carbon and hydrogen with two or more aromatic rings arranged in a linear, clustered or angular form (Billiard et al. Citation2002; Abdel-Shafy and Mansour Citation2016). As the number of rings increases, so does in general their lipophilicity, environmental persistence and the degree of DNA damage occurring in vivo (Cerniglia Citation1993). Although PAHs are easily metabolised by cytochrome P450 enzymes, they are of concern, as some of their metabolites are more toxic than the parent compound itself. Other concerns include interferences with the thyroid gland, reproductive and immune systems (Veraldi et al. Citation2006; Oostingh et al. Citation2008; Lee et al. Citation2016).
The EU Scientific Committee on Food has identified 15 PAHs of concern due to their carcinogenicity and mutagenicity (SCF Citation2002; Zelinkova and Wenzl Citation2015). Initially, benzo[a]pyrene (BaP) was used as the golden standard for assessing the risks of PAHs, however, the European Food Safety Authority (EFSA Citation2008) later concluded that the sum of 4 PAHs (Σ4PAHs) (i.e. benzo[a]anthracene (BaA), benzo[a]pyrene (BaP), benzo[b]fluoranthene (BbF) and chrysene) is more representative of the levels of carcinogenic PAHs in food, which was then implemented in legislation. Besides their mutagenic effect, certain PAHs are known to stimulate the AhR (EFSA Citation2008). As a result, the Dioxin Responsive Chemical-Activated LUciferase gene eXpression (DR CALUX®) bioassay, initially developed for the detection of PCDD/Fs and dl-PCBs, is also suitable in screening for the presence of PAHs (Bovee et al. Citation1996). Additionally, the DR CALUX assay can distinguish between PAHs and PCDD/Fs and dl-PCBs due to the metabolic stability of the latter after prolonged exposure, and the use of an acid-silica clean-up specifically for PCDD/Fs and dl-PCBs (Bovee et al. Citation1998).
Currently, in Ghana, there is a lack of data on consumer exposure to PAHs, dioxins and dl-PCBs through the consumption of plant-based supplements, although they are suspected to be contaminated with these compounds due to processing methods used (i.e. drying over open fires, smoking). Amongst the most popular supplements are those sold for improving sexual performance, which are also used by the youth for recreational purposes aside from their intended use. Previous studies by Akuamoa et al. (Citation2021) on these herbal supplements revealed the high phosphodiesterase type 5 (PDE-5) inhibition potentials were due to the addition of synthetic PDE-5 inhibitors (Akuamoa et al. Citation2022). Another study focused on the presence of pyrrolizidine alkaloids (Unpublished); a class of natural toxins present in certain plant families. The present study is intended to further investigate these herbal supplements to identify other undesirable contaminants such as PAHs, dioxins and dl-PCBs, possibly introduced before or during production. To this end, the 40 selected supplements were screened using the DR CALUX® bioassay to identify the presence of stable (acid-silica clean-up and 48 h exposure) and less stable (without acid-silica clean-up and 4 h exposure) AhR-agonists. Based on the results from the bioassay screening, ten supplements were selected for further analysis using gas chromatography coupled with high-resolution mass spectrometry (GC-HRMS) to evaluate whether the observed bioassay responses were due to known PAHs, dioxins and/or dl-PCBs and if the levels of these compounds could explain the observed bioassay responses. Finally, the risk for consumers was assessed using the margin of exposure approach for PAHs, and a comparison of estimated intakes to established Tolerable Weekly Intake (TWI) for dioxins and dl-PCBs.
Materials and methods
Supplements
Forty herbal supplements sold for improving sexual performance were selected from various markets and pharmacy shops in Accra (Ghana). These supplements were previously tested in a study by Akuamoa et al. (Citation2021) to determine their inhibition potentials against PDE-5 enzyme activity, and subsequently, the active compounds responsible for the observed inhibition potentials (Akuamoa et al. Citation2022). In this study, the supplements were analyzed for the potential presence of genotoxic and carcinogenic AhR agonists (i.e. PAHs) including AhR agonists with other potential adverse effects (i.e. PCDD/Fs). Supplementary Table S1 presents the list of 40 supplements and their allocated sample ID, origin, instructions for use, and recommended daily intakes. Herein after, samples are referred to by their allocated sample ID.
Chemicals and reagents
Methanol (MeOH) ultra-LC-MS (purity 99.98%; CAS-67-56-1), n-hexane PEC grade (CAS-110-54-3), and diethyl ether (purity 99.5%; CAS-60-29-7) were purchased from Actu-All Chemicals (Oss, The Netherlands). Na2SO4 (CAS-7757-82-6) was purchased from Merck (Darmstadt, Germany), silica from Ossum Chemicals (Oss, The Netherlands), and sulphuric acid from Merck (Darmstadt, Germany). The modified rat hepatoma cell line (H4IIE-Luc) was obtained from Wageningen University (identical to the cell line from Bio Detection Systems BV, Amsterdam, The Netherlands). Alpha minimum essential medium (AMEM) (1x) and foetal bovine serum (FBS) qualified H1 (Lot. 08Q7183K) were purchased from Gibco (Grand Island, New York), penicillin (5000 U; Lot. 097M4877V) and streptomycin (5 mg/L) from Sigma-Aldrich Chemie (Schnelldorf, Germany), 2,3,7,8-tetrachlorodibenzo-p-dioxin (TCDD; CAS-1746-01-6) from Schmidt BV (Amsterdam, The Netherlands), benzo[b]fluoranthene (BbF; CAS 205-99-2) and Chrysene (CAS 218-01-9) from Merck Life Science NV (Amsterdam, The Netherlands), dimethyl sulfoxide (DMSO) from Merck (Darmstadt, Germany), benzo[a] anthracene (BaA; CAS 56-55-3) and benzo[a]pyrene (BaP; CAS-50-32-8) from Dr Ehrenstorfer (Augsburg, Germany). Cell culture lysis reagent was obtained from Promega Benelux BV (Leiden, The Netherlands). T75 cell culture flasks, and tissue culture treated white 96-well clear bottom assay plates with lid, were purchased from VWR International BV (Amsterdam, The Netherlands). Ultra-pure water was prepared using a Milli-Q water purification system.
Acid-silica preparation
Silica (334 g) was impregnated with sulphuric acid (167 g) in a 1000 mL conical flask and activated by mixing overnight (14 h) on a head-over-head mixer (Heidolph Reax 2) at room temperature.
Sample preparation
One gram or millilitre portion of the solid or liquid sample was weighed into a 15 mL capacity polypropylene Eppendorf tube. As sample controls, feed samples containing a mixture of dioxins and dl-PCBs at concentrations of 0.02, 0.29, 0.48, 0.70, 1.57 and 3.35 ng TEQ kg-1 were included and treated similarly to the supplements. Next, 4 mL methanol (MeOH): H20 (85:15 v/v %) was added and vortexed at speed 5 for a minute while ensuring that all solutes were in suspension and not stuck at the bottom (Vortex-2 Genie, Model G-56OE). Subsequently, 4 mL n-hexane/diethyl ether (97:3 v/v %) was added and placed on a head-over-head mixer (Heidolph Reax 2) for 30 minutes at speed 5, and centrifuged (2910 g) (Sorvall RC3BP plus low-speed centrifuge; Thermo Scientific) for 10 minutes at 22 °C. After centrifugation, the n-hexane/diethyl ether phase was collected into a clean borosilicate glass tube. Again, 4 mL of n-hexane/diethyl ether (97:3 v/v %) was added and the extraction process was repeated. The n-hexane/diethyl ether phase was again collected and added to the previous one, resulting in about 8 mL. These extracts were treated with or without a clean-up over an acid-silica column before further analysis in the bioassay.
Sample treatment without an acid-silica clean-up
Each extract was evaporated to 1 mL using a vacuum evaporation system (Savant SPD 2010, Speed Vac Concentrator) with the temperature set at 45 °C, ramp at 3, vacuum pressure at level 30 and a runtime of 15 minutes. Afterwards, 20 µL DMSO was added (as a keeper) to the 1 mL extract and mixed before further evaporation in the vacuum evaporation system using the same program but reduced runtime (until the n-hexane/diethyl ether (97:3 v/v %) solvent was evaporated). Finally, an additional 20 µL DMSO was added to the extracts and mixed, resulting in a total volume of around 40 µL DMSO.
Sample clean-up using acid-silica
Glass columns (held in place with a clamp on a ring stand) were prepared with tips directed towards the opening of 50 mL liquid scintillation vials. Next, plugs of cotton (heated to complete dryness at 160 °C) were pushed down to the tips of each glass column. Ten grams of acid silica were weighed into each glass column followed by 2 grams of Na2SO4 (heated at 125 °C). The side of each glass column was gently tapped to ensure both anhydrous mixtures were compacted. Next, each column was pre-washed with 20 mL n-hexane/diethyl ether (97:3 v/v %) to condition the column while getting rid of impurities. The 50 mL liquid scintillation vials were replaced by new ones and the entire content of each sample extract (approximately 4 mL) was pipetted (and rinsed twice with 2 mL n-hexane/diethyl ether (97:3 v/v %)) into the glass columns. Next, extracts were eluted with 20 mL n-hexane/diethyl ether (97:3 v/v %) and subsequently an extra 10 mL of the same eluent, making a total volume of about 40 mL.
Each 40 mL sample extract was evaporated to about 1 mL using a vacuum evaporation system (Savant SPD 2010, Speed Vac Concentrator) with the temperature set at 45 °C, ramp at 3, vacuum pressure at level 30 and a runtime of 60 minutes. Afterwards, 1 mL was withdrawn from the vial, and transferred to a 6 mL borosilicate tube which already contained 20 µL DMSO (as a keeper) and the pipette rinsed twice with 2 mL n-hexane/diethyl ether (97:3 v/v %). The solution was mixed before evaporation in the vacuum system with the same program but reduced runtime. The n-hexane/diethyl ether (97:3 v/v %) solvent was evaporated. An additional 20 µL DMSO was added to the extracts suspended in DMSO and mixed, resulting in a total sample volume of around 40 µL.
Controls on the evaporation process of extracts
To check to what extent the evaporation step affected the responses, both BaP and TCDD standards were treated in two different ways, i.e. one was evaporated and the other one was not evaporated. The ‘evaporated’ TCDD and BaP standard solutions in DMSO were included and treated in the same way as sample extracts right before the second evaporation, i.e. by adding 20 µL of each TCDD and BaP standard solution and 5 mL n-hexane/diethyl ether (97:3 v/v %) into a 6 mL borosilicate tube, mixed and evaporate together with the sample extracts. The n-hexane/diethyl ether (97:3 v/v %) was evaporated, and an additional 20 µL DMSO was added to the standards suspended in DMSO and mixed, resulting in a total volume of about 40 µL.
DR CALUX® bioassay
Each evaporated extract and standard in DMSO were diluted with a 2 mL culture medium, i.e. AMEM supplemented with 10% FBS and 0.5% penicillin/streptomycin, resulting in a final DMSO concentration of ≈2%. The DR-CALUX bioassay was performed as described previously by Hoogenboom et al. (Citation1999). In short, recombinant rat hepatoma cells (H4IIE-Luc) were grown at 37 °C (5% CO2) and 100% relative humidity in a culture medium. Hundred microlitre cells (about 40,000 cells/well) were seeded in 96-well plates (Corning) and grown for 24 h before adding 100 µL of each extract or standard in culture medium in triplicate (final volume 200 µL, final concentration DMSO ≈ 1%). To check the effect of the evaporation in each series, unevaporated BaP and TCDD standard solutions (calibration curve) were also included for comparison, where 20 µL of unevaporated solution and 20 µL DMSO were added directly to a 2 mL incubation medium, from which 100 µL each were aliquoted into each well in triplicate. The luciferase concentration was subsequently measured 4 and 48 h after exposure. For this, the medium was removed, and the cell monolayers were washed with 200 µL phosphate-buffered saline (PBS) (Oxoid). Cells were lysed using a 20 µL cell culture lysis reagent (Promega) and incubated for 25 minutes at room temperature.
Luciferase activity of the cell lysate was measured with a CLARIOstar microplate reader (BMG Labtech) from Isogen Life Science BV (Utrecht, The Netherlands) which automatically added 100 µL assay mixture (substrate) containing 20 mM tricine, 1.07 mM MgCO3, Mg(OH)2.5H2O, 2.67 mM MgSO4.7H2O, 0.1 mM EDTA, 33.3 mM DTT, 261 µM Coenzyme A, 470 µM luciferin, and 530 µM ATP at a pH of 7.8. TCDD and BaP standard dose-response curves were fitted using a user-defined exponential equation y = a0/(1+(x/a1)^a2) (where a0 was the maximum response, a1 was the concentration showing a half-maximal response (EC50) and a2 was the coefficient for the steepness of the curve) with SlideWrite Plus v.6.1 (Advanced graphics software, USA). Graphs were plotted with GraphPad Prism 5.
GC-HRMS analysis of PAHs, dioxins and dl-PCBs
Depending on the available amount, 0.7 to 4 g (average 2.3 g) supplements were mixed with celite, spiked with 13C labelled standards of PCDD/Fs, PCBs and PAHs, and extracted using accelerated solvent extraction (ASE). After filtering over Na2SO4, half of the extract was used for the analysis of PAHs, and the other half for PCDD/Fs and PCBs.
The latter compounds were analyzed using standard and accredited methods (Ten Dam et al. Citation2016). Extracts were concentrated, mixed with n-hexane and purified on a Dextech (LCTech), using acid silica, alumina oxide and a carbon column, resulting in two fractions (i.e. fraction A with the eight mono-ortho- and six non-dioxin-like (ndl)-PCBs and fraction B with the 17 PCDD/Fs and four non-ortho PCBs). Both fractions were concentrated to 500 µL isooctane or toluene, respectively, and analyzed with GC/HRMS (Autospec), using a DB-5ms column (60 m × 0.25 mm ID: Fd 0.25 µm) (Agilent J&W, Folson, USA). The MS was tuned to a resolution of 10,000 at an electron energy of 35 eV and emission current of 600 µA. The required sensitivity to enable detection of 200 fg TCDD was a signal-to-noise ratio of 50. Of fraction A, 2 µL was injected in SSL mode at 280 °C and of fraction B 100 µL on a PTV injector (Gerstel, Mülheim an der Ruhr, Germany) in Solvent Vent mode via a liner with glass pearls. The U.S. EPA protocol was used regarding the TEQ calculations with the data obtained from the GC-HRMS analysis. Absolute levels of each congener were multiplied by their WHO2005-TEF which were then added together to obtain the overall PCDD/Fs and dl-PCB concentration expressed in TEQ (Van den Berg et al. Citation2006).
PAHs were analyzed using an in-house routine and accredited method by concentrating the other half of the ASE extract. After dissolving in cyclohexane/ethyl acetate 50:50, it was purified on a GPC column (Biobeads SX3). The relevant fraction was concentrated and purified using an alumina oxide column. The eluate was concentrated to 100 µL and analyzed by GC-HRMS using a Varian Select-PAH column (30 m × 0.25 mm, 0.15 µm). A volume of 1 µL was injected in SSL mode at 300 °C and the MS was tuned to a resolution of 12,000 at an electron energy of 35 eV and emission current of 600 µA.
Results and discussion
The present study applies two procedures for the detection of stable and unstable AhR-agonists. One is based on the metabolic capacity of the cells used in the bioassay; the other is based on the application of an acid-silica clean-up which is known to remove many compounds (less stable) from the extracts. Regarding the differences in the metabolic capacity of the engineered H4IIE rat liver cells used in the DR CALUX® bioassay for conversion of PCDD/Fs versus PAHs, responses were measured after 4 and 48 h exposure. This was to predict the potential metabolism and/or stability of AhR-active compounds present in the supplement extracts. Less stable AhR-agonist (e.g. PAHs) are known to be metabolized by cells, resulting in a relatively high response at 4 h and much lower or almost no response at 48 h, whereas more stable compounds (e.g. PCDD/Fs and dl-PCBs) will elicit a higher response after prolonged exposure (i.e. 48 h) due to their persistent nature (Bovee et al. Citation1996; Hoogenboom et al. Citation1999; Zhou et al. Citation2021).
shows the dose-response curves of TCDD (1a), BaP (1 b), BbF (1c), BaA (1d) and Chrysene (1e) at 4 and 48 h exposure. The 4 PAHs elicited a clear dose-response when using an exposure time of 4 h. However, after prolonged exposure (i.e. 48 h) the responses were lost at the lower concentrations and only observed at high concentrations. The responses obtained at 48 h with very high concentrations for the 4 PAHs were most likely due to metabolic limitation of the cells, i.e. the capacity needed to fully metabolize (and inactivate) the large amounts of active less stable compounds.
Figure 1. DR CALUX® cell responses at 4 and 48 hrs exposure to TCDD (1a), BaP (1 b), BbF (1c), BaA (1d) and Chrysene (1e). Extracts of feed samples (cleaned over acid-silica columns; with each different data point representing a different extract with a different concentration of a mixture of PCDD/Fs and dl-PCBs for which the concentration in TEQ was determined after GC-HRMS analysis (1f)). Results show mean (±SD; n = 3) responses in relative light units (RLUs).
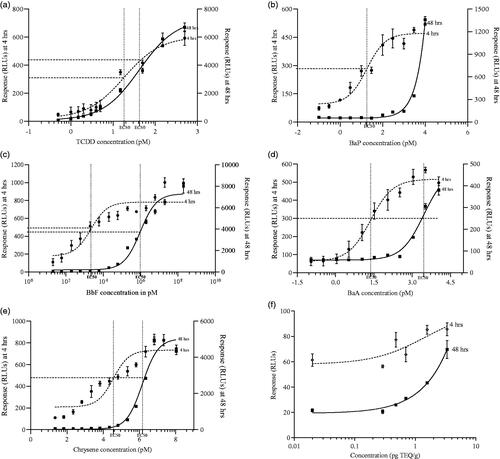
On the contrary, the shape of the dose-response curve of TCDD at 4 and 48 h was similar and signals after 48 h were higher than at 4 h (). Compared to BaP, the dose-response curve of TCDD did not shift to the right with a longer exposure time, which can be attributed to the stable and persistent nature of TCDD. The evaporation step during the sample pre-treatment did not affect the bioassay outcomes, as responses of ‘evaporated’ and ‘unevaporated’ BaP and TCCD standards were identical (data not shown). This implied that the evaporation procedure was optimal and loss of DMSO was minimal, which is of importance given that it was previously demonstrated that the percentage of DMSO affects the luciferase production by the cells (Hoogenboom et al. Citation2006).
In addition, feed samples prepared with soy oil spiked with PCDD/Fs and dl-PCBs at varying concentrations (used in daily routine when screening samples for enforcement purposes) were included to check for unexpected matrix effects when testing extracts with an acid-silica clean-up (). The results showed a dose-related response at 4 and 48 h exposure. Both responses at 4 and 48 h showed similar characteristics as the TCDD standard curve, i.e. no clear shift to the right. The results also demonstrated the successful extraction and clean-up of PCDD/Fs and dl-PCBs over acid-silica and the sensitivity of the assay to determine levels around the EU maximum threshold for the sum of PCDD/Fs and dl-PCBs in feed (i.e. 1.25 ng TEQ kg−1) (Commission Directive 2006/13/EC).
shows the cell responses at 4 and 48 h upon exposure to the supplement extracts prepared with and without an acid-silica clean-up. Exposure for 4 h to extracts prepared without an acid-silica clean-up was to identify less stable compounds that are degraded during acid-silica clean-up, whereas cells exposed for 48 h to extracts treated with acid-silica were to identify the presence of more stable/persistent compounds that are not degraded during the acid-silica treatment (Bovee et al. Citation1996; Citation1998; Hoogenboom et al. Citation1999). The average response of each extract at 4 and 48 h was corrected for the average response observed for DMSO at 4 h and 48 h. These corrected average responses are shown in .
Figure 2. Responses at 4 (a) and 48 hrs (b) exposure to sample extracts prepared with and without acid-silica-clean up (mean ± SD; n = 3 incubations for single clean-up).
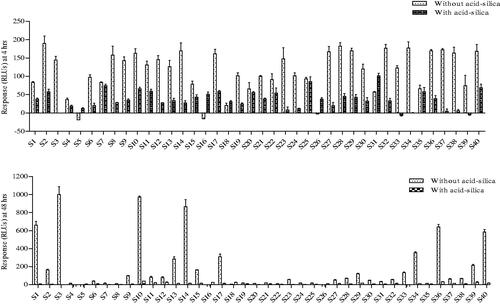
Generally, cell responses at 4 h upon exposure to 35 (87.5%) sample extracts prepared without an acid-silica were higher than the responses obtained from extracts prepared with an acid-silica clean-up, with an overall average response of 120 RLUs compared to 39 RLUs, respectively (). This meant that the responses were mainly caused by compounds that were not recovered from the acid-silica column. However, cell responses at 4 h for the rest of the five sample extracts (S7, S18, S20, S25, S35) treated with and without acid-silica were similar, indicating the presence of compounds that withstood the acid-silica clean-up.
At 48 h, extracts treated with an acid-silica column generally did not show elevated responses (average response of 12 RLUs), thus indicating the absence of stable AhR-agonists like dioxins and dl-PCBs. This implied that the AhR-agonists detected after 4 h in the five supplement extracts (S7, S18, S20, S25, S35) purified over an acid-silica column, were completely metabolised or inactivated by the rat liver cells at 48 h (). Interestingly, cell responses of some extracts i.e. S1, S10, S14, S36 and S40 not treated with an acid-silica clean-up were even higher than at 4 h (). These samples likely contained compounds that were not, or only partially metabolized by the cells (as observed for BaP in high concentrations at 48 h), but were lost upon acid-silica clean-up.
Overall, the results from the DR CALUX® assay indicated that none of the 40 supplements contained high levels of stable AhR-agonists, but rather substantial amounts of other less stable AhR-agonists which were poorly metabolized by the cells. Based on the results obtained, ten supplements (i.e. six supplements (S1, S10, S14, S34, S36, and S40 which showed high responses at 4 and 48 h exposure without acid silica), two supplements, S7 and S25 (which resulted in equal responses at 4 h with or without acid-silica), and two other supplements (S22 and S29) (with low responses at 48 h without acid silica) were selected for further characterization using GC-HRMS to enable evaluation of the outcomes of the bioassay. This further investigation was not to test all samples, but rather to show as proof of the accuracy of the bioassay in presenting reliable leads as a screening assay.
The GC-HRMS reference library contained 24 PAHs including the 4 EU marker PAHs (i.e. benzo[a]anthracene, chrysene, benzo[b]fluoranthene and benzo[a]pyrene) proposed by the EFSA (Citation2008) as indicative for PAHs with genotoxic and carcinogenic properties. Supplementary Table S2 shows the list of 24 PAHs and their respective concentrations in nanogram PAH per gram of supplement. Amongst the list of PAHs, phenanthrene was abundantly identified in all ten samples with concentrations ranging from 2.98 to 94.30 ng g−1. Fluoranthene and pyrene also contributed significantly to the sum of 24 PAHs.
To assess the risk of consumers upon exposure, individual concentrations of the 4 EU marker PAHs were summed to obtain the sum of 4 PAHs (Σ4PAHs), which ranged from not detected (ND) to 25.5 ng g−1 (). Amongst the 4 EU marker PAHs, benzo[b]fluoranthene occurred the most (8 times) and recorded the highest single PAH level in the ten supplements, followed by benzo[a]pyrene (7 times) in terms of occurrence and chrysene in terms of concentration. The six supplements (S1, S10, S14, S34, S36, and S40) which showed high cell responses at both 4 and 48 h (without acid silica), showed detectable levels of PAHs according to the GC-HRMS analysis. In addition, three supplements (S7, S22 and S25) which showed low responses at 4 and 48 h (without acid-silica), showed low levels of the PAHs as determined by the GC-MS analysis. S29 which induced a high response (170 RLUs) at 4 h but a relatively low response (120 RLUs) at 48 h (both without acid-silica), recorded the highest Σ4PAHs (25.5 ng g−1).
Table 1. Compound concentrations (ng g–1) for the Σ4PAHs as determined by GC-HRMS analysis.
The GC-HRMS measured Σ4PAH concentrations were converted to their respective RLUs using the corresponding compound dose-response curves at 4 and 48 h (data not shown). The predicted responses (RLUs) for the supplements with detectable but lower PAH levels (S1, S10, S14, S34, S36, and S40) explained a substantial part of the DR CALUX® response at 4 h but not at 48 h. This indicates that the high responses observed after 48 h for some of the supplements (without acid-silica), were the cause of other (natural) AhR-agonists, which were poorly metabolised by the cells but were lost upon the use of an acid silica clean-up (Amakura et al. Citation2002; Jeuken et al. Citation2003). Examples of such natural AhR-agonist include furocoumarins, flavonoids, stilbenes, carotenoids and indoles which have been reported to lower cholesterol, inhibit the growth of cancer cells, and protect against Parkinson’s disease (Hirano et al. Citation1995; Datla et al. Citation2001; Kurowska and Manthey Citation2004; van Ede et al. Citation2008).
To estimate the daily intakes (EDIs) resulting from the use of the supplements, the Σ4PAH levels were multiplied by the average weight of the recommended dose and by the number of doses per day (). The EDIs for supplements with detected levels ranged from 7.2 to 111.3 ng Σ4PAH day−1. Dividing the EDI by the average weight of a consumer (assuming an average weight of 70 kg) the estimated intake levels ranged from 0.10 to 1.59 ng Σ4PAH kg−1 bw/day ().
Table 2. Calculated daily intakes of the Σ4PAHs resulting from daily use of the supplements and MOE values.
Due to the genotoxic and carcinogenic nature of PAHs, the margin of exposure (MOE) approach was used to assess the potential health risks of consumers upon exposure to these contaminants upon daily long-term use of the respective herbal supplements. The BMDL10, representing the lower 95% confidence interval of the dose that causes a 10% increase in tumour incidence, was used as a reference point. The MOE is the ratio between this BMDL10 and the estimated human daily intake (EDI). For PAHs, the European Food Safety Authority (EFSA Citation2008) established a BMDL10 of 340 µg kg−1 bw/day as a reference point for the 4 EU marker PAHs based on a carcinogenicity study on coal tar mixtures by Culp et al. (Citation1998). Thus, the MOE was determined by dividing the BMDL10 (340,000 ng kg−1 bw/day) by the EDI (ng kg−1 bw/day) (). For compounds with a genotoxic and carcinogenic mode of action, the EFSA considers a MOE larger than 10,000 as a low health concern whereas those close to or less than 10,000 indicate a potential concern for consumer health and a possible priority for risk management actions (EFSA Citation2005, Citation2008). The calculated MOE values for the supplements based on the EDIs were all above 10,000 (), thus indicating a low concern for consumer health.
Although the levels of PAHs identified in this study were relatively low compared to the levels of PAHs reported in other studies, the levels indicate the prevalence of PAHs in herbal products. For instance, Krajian and Odeh (Citation2013) investigated the presence of the 16 US (EPA) PAHs in 10 medicinal plants in Syria and reported a concentration range of 47 to 890 µg kg−1 using reverse-phase high-performance-liquid-chromatography (HPLC) coupled to both ultraviolet and fluorescence detection. Also, Cui et al. (Citation2014) investigated seventy-nine herbal medicinal products for the presence of 16 PAHs using a similar chemical analytical approach as the one employed in this study and reported PAH concentrations ranging from 21.1 to 2856 µg kg−1 which were higher than the amounts determined in the present study. Similarly, Yu et al. (Citation2012) investigated nine Chinese medicinal herbs (Panax, Fructus liquidambaris, liquorice root, mulberry twig, cassia seed, eucommia bark, rose flower, indigo woad leaf and fleece flower root) for the presence of 16 genotoxic and carcinogenic PAHs and recorded concentrations ranging from 98.2 to 2245 µg kg−1. Fiedler et al. (Citation2002) even recorded amounts from 497 to 1162 mg kg−1 when analyzing the total PAH content in four Chinese herbal teas (two green teas, and two brick teas).
It has been suggested that estimating exposure based on the relative potency factors (RPF) of PAHs is more representative of individual compound contributions towards the final estimations than estimations based on the absolute PAH concentrations (Nisbet and Lagoy Citation1992). A potency-based approach for risk assessment on PAHs would help in reducing the tendency of overestimating the risk since several PAHs seem relatively less potent (i.e. low RPF) when compared to BaP. Nevertheless, the challenge in applying these RPFs is the lack of universally accepted RPFs applicable when estimating combined exposure levels for risk assessment, which is a result of the different assays employed in the various studies and the resulting variations in the RPFs established. For instance, Machala et al. (Citation2001) established the RPFs of PAHs based on a DR CALUX assay, Villeneuve et al. (Citation2002) employed the in vitro ethoxyresorufin-O-deethylase assay, while Pieterse et al. (Citation2013) employed the PAH CALUX assay, thus contributing to differences in the established RPFs.
These may subsequently result in great variations in estimated intakes when expressed in e.g. benzo(a)pyrene-equivalents (BaP) and the conclusions drawn. It is also worth noting that reported RPFs for PAHs are based on skin tumours (following skin exposure) or in vitro assays, and there are not sufficient data to establish RPFs for oral exposure. As a result, the use of RPFs in estimating PAH intakes to assess the health risks of consumers has not been adopted by relevant authorities and organisations such as the WHO, EFSA and the United States Environmental Protection Agency (USEPA). Instead, EFSA preferred to base the assessment on four relatively potent PAHs present in PAH mixtures and assumed equal potencies.
Regarding the PCDD/Fs and dl-PCBs, the concentration of individual congeners and the sum of 7 PCDDs, 10 PCDFs, and 4 non-ortho PCBs in the selected supplements as measured by the GC-HRMS analysis are presented in Supplementary Table S3. Mono-ortho and non-dl PCBs were not detected in any of the samples. In most of the supplements, the concentrations of individual congeners were below the LOQ. However, there were detectable levels of 1,2,3,4,6,7,8-heptachlorodibenfuran (1,2,3,4,6,7,8-HpCDF), 1,2,3,4,6,7,8-heptachlorodibenzo-p-dioxin (1,2,3,4,6,7,8-HpCDD), octachlorodibenzodioxin (OCDD) and the non-ortho-PCB 77 in 6, 10, 9 and 10 supplements, respectively. However, these congeners have low toxic potencies, as reflected by their TEF values. Similar results were reported for three medicinal plants (henna, rosemary, and moghat), which showed low levels of PCDD/Fs in these plants when grown on raw wastewater and analysed using GC/HRMS (Loutfy et al. Citation2010). In another study by Mosleh et al. (Citation2014), eight medicinal plants (i.e. caraway, cumin, anise, sage, rosemary, black tea, ginger and cinnamon) randomly collected from Jeddah central market (Saudi Arabia) were investigated using GC-HR/MS, and was concluded that no PCDDs, PCDFs, and dl-PCBs were detected.
To translate the quantified GC-HRMS data into data expressed in toxic equivalents, the concentration of each congener was multiplied by its respective toxic equivalency factor (TEF) and added up to determine the total concentrations in pg TEQ g−1 of supplement (Van den Berg et al. Citation2006). It was decided to use for the calculation of the TEQ values the lower bound concentrations, thus setting values below the LOQ equal to zero to avoid an overestimation of exposure levels (). The upper bound levels are shown in Supplementary Table S3 and were obtained by setting the concentration in the non-detects equal to the LOQ. Accordingly, the concentrations of PCDD/Fs and dl-PCBs in the samples at the lower bound ranged from 0.01 to 0.19 pg TEQ g−1, while the upper bound values ranged from 0.22 to 1.82 pg TEQ g−1, with S36 recording the highest lower bound value and S14 the highest upper bound value.
Table 3. Total PCDD/F and dl-PCB concentrations in the 10 selected samples based on their lower bound values, corresponding EDIs and exposure levels per week when following the recommended intakes.
The majority of the PCDD/Fs and dl-PCB contents were below the LOQ in the ten supplements, which corresponded with the observed responses in the DR CALUX® at 48 h exposure to extracts treated with an acid silica clean-up, as these samples did not elicit any response (). Supplements that did show low responses at 48 h with acid-silica, i.e. S10, S14, S29 S36 and S40, were confirmed by the analytical data, as containing PCDD/Fs plus dl-PCBs, with estimated concentrations of 0.01, 0.05, 0.08, 0.19 and 0.07 pg TEQ g−1, respectively.
Based on the determined PCDD/F and dl-PCB concentrations, the estimated daily intakes (EDIs) (pg TEQ day−1) were calculated by multiplying the respective concentration in the supplements with the average weight of the recommended dose and the number of doses to be taken per day. shows the lower bound concentrations of the 10 supplements, and the corresponding EDI values expressed in pg TEQ day−1 and pg TEQ kg−1 bw week−1 (assuming daily use). The EDIs ranged from 0.01 to 1.20 pg TEQ day−1, where S7 recorded the highest intake level followed by S22 and S25 due to the highly recommended daily intakes of the liquid supplements. Intakes kg−1 bw day−1 were determined by dividing the EDI (pg WHO-TEQ day−1) by the average weight of a consumer. Assuming a daily intake by a 70 kg person, exposure levels ranged from 0.0001 to 0.02 pg TEQ kg−1 bw day−1, which was lower than the exposure levels of these compounds determined upon food consumption (EFSA Citation2018). Assuming daily use, the calculated daily exposures translate to a weekly intake of 0.001 to 0.13 pg TEQ kg−1 bw week−1, and are thus substantially lower than the established TWI of 2 pg TEQ kg−1 bw week−1 (EFSA Citation2018), indicating a low concern for consumers’ health.
According to Loutfy et al. (Citation2010), the differences in PCDD/Fs and dl-PCB concentrations (pg WHO TEQ g−1) in medicinal plants are likely due to the burden of congeners in different plant locations and differences in the accumulation capacities of the plants. In practice also, processing methods involving the exposure of products to high temperature and low oxygen may predispose finished products to these unwanted compounds. The evidence thus gathered in the present and these other studies (Foxall et al. Citation1995; Kim et al. Citation2000; Fiedler et al. Citation2002) points to low levels of PCDD/Fs and dl-PCBs in plant-based products in contrast to animal-derived products (Diletti et al. Citation2008; Adamse et al. Citation2017; Hoogenboom et al. Citation2021). This observation may be explained by the low capability of plants to bioaccumulate these compounds, unlike foods with high lipid content such as fish, meat and dairy products. Furthermore, studies have shown that root uptake and accumulation of PCDD/Fs, and dl-PCBs in plants are low, due to their high n-octanol/water partition coefficients (O’Connor et al. Citation1990; Wild et al. Citation1992; Webber et al. Citation1994; Loutfy et al. Citation2010). Nevertheless, it appeared that for medicinal products, in-field contamination or drying of herbs resulted in a minor risk of introducing high concentrations of dioxins and dl-PCBs.
Conclusions
This study demonstrates the successful application of the DR CALUX® bioassay in screening for the presence of less stable and more stable AhR-agonists in a series of selected herbal supplements sold for improving sexual performance and a confirmation by GC-HRMS of so-called ‘suspect’ samples. In general, cell responses at 4 and 48 h upon exposure to extracts without an acid-silica clean-up can be ascribed to less stable AhR-agonists that were lost upon acid-silica clean-up. Significant amounts of PAHs were detected in some extracts based on the GC-HRMS analysis, but levels of PCDD/Fs and dl-PCBs were low. When comparing the EDIs calculated for the Σ4PAHs with the relevant BMDL10, the MOE values were far above 10,000, indicating a low health concern and the absence of a need for risk management actions. Similarly, the exposure levels to PCDD/Fs and dl-PCBs were substantially lower than the established TWI of 2 pg TEQ kg−1 bw week−1, thus also showing low priority for risk management by relevant authorities concerning the presence of these persistent contaminants in herbal supplements. For further studies, it is recommended to investigate the identity and nature of the unknown natural AhR-agonists in herbal products that could cause high responses in the DR® CALUX bioassay, especially after 48 h exposure.
Collaboration
This project is a collaboration between Wageningen Food Safety Research and the Dept. of Toxicology at Wageningen University and Research.
Supplemental Material
Download MS Word (192.5 KB)Supplemental Material
Download MS Word (54.4 KB)Disclosure statement
The authors declare that they have no known competing financial interest or personal relationship that could have appeared to influence the work reported in this paper.
Additional information
Funding
References
- Abdel-Shafy HI, Mansour MS. 2016. A review on polycyclic aromatic hydrocarbons: source, environmental impact, effect on human health and remediation. Egypt J Pet. 25(1):107–123. doi:10.1016/j.ejpe.2015.03.011
- Adamse P, Schoss S, Theelen RM, Hoogenboom RL. 2017. Levels of dioxins and dioxin-like PCBs in food of animal origin in the Netherlands during the period 2001–2011. Food Additives & Contaminants: Part A. 34(1):78–92. doi:10.1080/19440049.2016.1252065
- Akuamoa F, Hoogenboom RL, Hamers A, Rietjens IM, Bovee TF. 2021. PDE-5 inhibitors in selected herbal supplements from the Ghanaian market for better erectile function as tested by a bioassay. Toxicol In Vitro. 73:105130. doi:10.1016/j.tiv.2021.105130
- Akuamoa F, Bovee T F, van Dam R, Maro L, Wesseling S, Vervoort J, Rietjens IM, Hoogenboom RL. 2022. Identification of phosphodiesterase type-5 (P DE-5) inhibitors in herbal supplements using a tiered approach and associated consumer risk. Food Addit Contam: Part A. 1–12. doi:10.1080/19440049.2022.2052972
- Amakura Y, Tsutsumi T, Nakamura M, Kitagawa H, Fujino J, Sasaki K, Yoshida T, Toyoda M. 2002. Preliminary screening of the inhibitory effect of food extracts on activation of the aryl hydrocarbon receptor induced by 2, 3, 7, 8-tetrachlorodibenzo-p-dioxin. Biol Pharm Bull. 25(2):272–274. doi:10.1248/bpb.25.272
- Billiard SM, Hahn ME, Franks DG, Peterson RE, Bols NC, Hodson PV. 2002. Binding of polycyclic aromatic hydrocarbons (PAHs) to teleost aryl hydrocarbon receptors (AH). Comp Biochem Physiol B. 133(1):55–68. doi:10.1016/S1096-4959(02)00105-7
- Bovee TFH, Hoogenboom RLAP, Traag WA, Zuidema T, Horstman JHJ, Kuiper HA, Aarts JM, Murk TJ, Brouwer BA, Denison MS. 1996. Biological screening of Ah receptor agonist activity in butter fat and coconut oil using chemical-activated luciferase expression in a genetically engineered cell line (CALUX). Organohalogen Compd. 27:0–3. doi:10.1080/02652039809374723
- Bovee TF, Hoogenboom LA, Hamers AR, Traag WA, Zuidema T, Aarts JM, Brouwer A, Kuiper HA. 1998. Validation and use of the CALUX‐bioassay for the determination of dioxins and PCBs in bovine milk. Food Addit Contam. 15(8):863–875. doi:10.1080/02652039809374723
- Cerniglia CE. 1993. Biodegradation of polycyclic aromatic hydrocarbons. Curr Opin Biotechnol. 4(3):331–338. doi:10.1016/0958-1669(93)90104-5
- Cui Z, Ge N, Cao Y, Zhang J, Liu Y, Zhou L, Quarantine B. 2014. Investigation and assessment of polycyclic aromatic hydrocarbons contamination in Chinese herbal medicines. Environ Chem. 33:844–849.
- Culp SJ, Gaylor DW, Sheldon WG, Goldstein LS, Beland FA. 1998. A comparison of the tumours induced by coal tar and benzo [a] pyrene in a 2-year bioassay. Carcinogenesis. 19(1):117–124. doi:10.1093/carcin/19.1.117
- Datla KP, Christidou M, Widmer WW, Rooprai HK, Dexter DT. 2001. Tissue distribution and neuroprotective effects of citrus flavonoid tangeretin in a rat model of Parkinson’s disease. Neuroreport. 12:3871–3875.
- Diletti G, Ceci R, Conte A, Benedictis AD, Migliorati G, Scortichini G. 2008. Milk contamination from dioxins in Italy: source identification and intervention strategies. In: The fate of persistent organic pollutants in the Environment. Dordrecht: Springer; p. 301–314.
- EC, European Commission. 2006. Commission Directive 2006/13/EC of 3 February 2006 amending Annexes I and II to Directive 2002/32/EC of the European Parliament and of the Council on undesirable substances in animal feed as regards dioxins and dioxin-like PCBs. Office J European Union. 32:44–53.
- EFSA. 2005. European Food Safety Authority. Opinion of the scientific committee on a request from EFSA related to a harmonised approach for risk assessment of substances which are both genotoxic and carcinogenic. Efsa J. 282:1–31. doi:10.2903/j.efsa.2005.282
- EFSA. 2008. Polycyclic aromatic hydrocarbons in food‐scientific opinion of the panel on contaminants in the food chain. Efsa J. 6(8):724. doi:10.2903/j.efsa.2008.724.
- EFSA. 2018. Risk for animal and human health related to the presence of dioxins and dioxin‐like PCBs in feed and food. Efsa J. 16(11):p.e05333. doi:10.2903/j.efsa.2018.5333
- European Commission. 2006. Commission Regulation (EC) No 1881/2006 of 19 December 2006 setting maximum levels for certain contaminants in foodstuffs. Off J Eur Union. 364:5–24.
- Fiedler H, Cheung CK, Wong MH. 2002. PCDD/PCDF, chlorinated pesticides and PAH in Chinese teas. Chemosphere. 46(9–10):1429–1433. doi:10.1016/S0045-6535(01)00264-8
- Foxall C, Lovett A, Creaser C, Chewe D. 1995. PCB and PCDD/DF concentrations in fruit and vegetable samples from urban and rural areas in Wales and England. Organohalogen Compd. 26:25–30.
- Hirano T, Abe K, Gotoh M, Oka K. 1995. Citrus flavone tangeretin inhibits leukaemic HL-60 cell growth partially through induction of apoptosis with less cytotoxicity on normal lymphocytes. Br J Cancer. 72(6):1380–1388. doi:10.1038/bjc.1995.518
- Hoogenboom L, Hoffer S, Mennen M, Morgenstern P, Traag W. 2012. Dioxins formed during fires; a threat to the food chain. In Presentation 32nd international symposium on halogenated organic pollutants p. 26–31.
- Hoogenboom L, Traag W, Bovee T, Goeyens L, Carbonnelle S, Vanloco J, Beernaert H, Jacobs G, Schoeters G, Goeyens L. 2006. The CALUX bioassay: current status of its application to screening food and feed. Trac Trends Anal Chem. 25(4):410–420. doi:10.1016/j.trac.2006.02.012
- Hoogenboom LP, Hamers AM, Bovee TH. 1999. Bioassays for the detection of growth-promoting agents, veterinary drugs and environmental contaminants in food. Analyst. 124(1):79–85. doi:10.1039/a804950e
- Hoogenboom RL, Ten Dam G, van Leeuwen SP, van Egmond H, Nicolina J, Dwarkasing AJ. 2021. High levels of dioxins and PCBs in meat, fat and livers of free ranging pigs, goats, sheep and cows from the island of Curaçao. Chemosphere. 263:128057. doi:10.1016/j.chemosphere.2020.128057
- Jeuken A, Keser BJ, Khan E, Brouwer A, Koeman J, Denison MS. 2003. Activation of the Ah receptor by extracts of dietary herbal supplements, vegetables, and fruits. J Agric Food Chem. 51(18):5478–5487. doi:10.1021/jf030252u
- Kim Y, Lee SY, Kim M. 2000. The levels of PCDFs and PCDDs in Korean cabbage and radish from Korean markets. Organohalogen Compd. 47:372–374.
- Krajian H, Odeh A. 2013. Polycyclic aromatic hydrocarbons in medicinal plants from Syria. Toxicol Environ Chem. 95(6):942–953. doi:10.1080/02772248.2013.840375
- Kurowska EM, Manthey JA. 2004. Hypolipidemic effects and absorption of citrus polymethoxylated flavones in hamsters with diet-induced hypercholesterolemia. J Agric Food Chem. 52(10):2879–2886. doi:10.1021/jf035354z
- Lee SY, Sekhon SS, Ban YH, Ahn JY, Ko JH, Lee L, Kim SY, Kim YC, Kim YH. 2016. Proteomic analysis of polycyclic aromatic hydrocarbons (PAHs) degradation and detoxification in Sphingobium chungbukense DJ77. J Microbiol Biotechnol. 26(11):1943–1950. doi:10.4014/jmb.1606.06005
- Lohmann R, Northcott GL, Jones KC. 2000. Assessing the contribution of diffuse domestic burning as a source of PCDD/Fs, PCBs, and PAHs to the UK atmosphere. Environ Sci Technol. 34(14):2892–2899. doi:10.1021/es991183w
- Loutfy N, Mosleh Y, Ahmed MT. 2010. Dioxin, dioxin-like PCBs and indicator PCBs in some medicinal plants irrigated with wastewater in Ismailia, Egypt. Polycyclic Aromat Compd. 30(1):9–26. doi:10.1080/10406630903495151
- Machala M, Vondráček J, Bláha L, Ciganek M, Neča J. 2001. Aryl hydrocarbon receptor-mediated activity of mutagenic polycyclic aromatic hydrocarbons determined using in vitro reporter gene assay. Mutat Res. 497(1–2):49–62. doi:10.1016/S1383-5718(01)00240-6
- Mosleh YY, Mofeed J, Almaghrabi OA, Kadasa NM, El-Alzahrani HS, Fuller MP. 2014. Residues of heavy metals, PCDDs, PCDFs, and DL-PCBs some medicinal plants collected randomly from the Jeddah, central market. Life Sci. J. 11:1–8.
- Nebert DW, Puga A, Vasiliou V. 1993. Role of the Ah receptor and the dioxin‐inducible [Ah] gene battery in toxicity, cancer, and signal transduction. Ann NY Acad Sci. 685:624–640. doi:10.1111/j.1749-6632.1993.tb35928.x
- Nisbet IC, Lagoy PK. 1992. Toxic equivalency factors (TEFs) for polycyclic aromatic hydrocarbons (PAHs). Regul Toxicol Pharmacol. 16(3):290–300. doi:10.1016/0273-2300(92)90009-X
- O’Connor GA, Kiehl D, Eiceman GA, Ryan JA. 1990. American society of agronomy, crop science society of America, and Soil Science Society of America. Plant Uptake of Sludge‐Borne PCBs. 19:113–118. doi:10.2134/jeq1990.00472425001900010016x
- Oostingh GJ, Schmittner M, Ehart AK, Tischler U, Duschl A. 2008. A high-throughput screening method based on stably transformed human cells was used to determine the immunotoxic effects of fluoranthene and other PAHs. Toxicol In Vitro. 22(5):1301–1310. doi:10.1016/j.tiv.2008.03.003
- Pieterse B, Felzel E, Winter R, Van Der Burg B, Brouwer A. 2013. PAH-CALUX, an optimized bioassay for AhR-mediated hazard identification of polycyclic aromatic hydrocarbons (PAHs) as individual compounds and in complex mixtures. Environ Sci Technol. 47(20):11651–11659. doi:10.1021/es403810w
- Schuler F, Schmid P, Schlatter C. 1997. Transfer of airborne polychlorinated dibenzo-p-dioxins and dibenzofurans into dairy milk. J Agric Food Chem. 45(10):4162–4167. doi:10.1021/jf970248g
- Scientific Committee on Food (SCF). 2002. Scientific Committee on Food, SCF 2002. Polycyclic aromatic hydrocarbons – occurrence in foods, dietary exposure and health effects. Report No. SCF/CS/CNTM/PAH/29.
- Ten Dam G, Pussente IC, Scholl G, Eppe G, Schaechtele A, van Leeuwen S. 2016. The performance of atmospheric pressure gas chromatography–tandem mass spectrometry compared to gas chromatography–high-resolution mass spectrometry for the analysis of polychlorinated dioxins and polychlorinated biphenyls in food and feed samples. J Chromatogr A. 1477:76–90. doi:10.1016/j.chroma.2016.11.035
- Tuomisto J. 2019. Dioxins and dioxin-like compounds: toxicity in humans and animals, sources, and behaviour in the environment. Wiki J Med. 6(1):8. doi:10.15347/wjm/2019.008
- Van den Berg M, Birnbaum L, Bosveld AT, Brunström B, Cook P, Feeley M, Giesy JP, Hanberg A, Hasegawa R, Kennedy SW, et al. 1998. Toxic equivalency factors (TEFs) for PCBs, PCDDs, and PCDFs for humans and wildlife. Environ Health Perspect. 106(12):775–792., doi:10.1289/ehp.98106775
- Van den Berg M, Birnbaum LS, Denison M, De Vito M, Farland W, Feeley M, Fiedler H, Hakansson H, Hanberg A, Haws L, et al. 2006. The 2005 World Health Organization re-evaluation of human and mammalian toxic equivalency factors for dioxins and dioxin-like compounds. Toxicol Sci. 93(2):223–241. doi:10.1093/toxsci/kfl055
- van Ede K, Li A, Antunes-Fernandes E, Mulder P, Peijnenburg A, Hoogenboom R. 2008. Bioassay directed identification of natural aryl hydrocarbon-receptor agonists in marmalade. Anal Chim Acta. 617(1–2):238–245. doi:10.1016/j.aca.2008.01.054
- Veraldi A, Costantini AS, Bolejack V, Miligi L, Vineis P, van Loveren H. 2006. Immunotoxic effects of chemicals: a matrix for occupational and environmental epidemiological studies. Am J Ind Med. 49(12):1046–1055. doi:10.1002/ajim.20364
- Villeneuve DL, Khim JS, Kannan K, Giesy JP. 2002. Relative potencies of individual polycyclic aromatic hydrocarbons to induce dioxin-like and estrogenic responses in three cell lines. Environ Toxicol. 17(2):128–137. doi:10.1002/tox.10041
- Webber MD, Pietz RI, Granato TC, Svoboda ML. 1994. American society of agronomy, crop science society of America, and Soil Science Society of America. Plant Uptake of PCBs and Other Organic Contaminants from Sludge‐Treated Coal Refuse. 23(5):1019–1026. doi:10.2134/jeq1994.00472425002300050024x
- White SS, Birnbaum LS. 2009. An overview of the effects of dioxins and dioxin-like compounds on vertebrates, as documented in human and ecological epidemiology. J Environ Sci Health C Environ Carcinog Ecotoxicol Rev. 27(4):197–211. doi:10.1080/10590500903310047
- WHO. 2002. Polychlorinated dibenzodioxins, polychlorinated dibenzofurans, and coplanar polychlorinated biphenyls. In: Safety evaluation of certain food additives and contaminants. Geneva, World Health Organization (WHO Food Additives Series, No. 48; http://www.inchem.org/documents/jecfa/jecmono/v48je20.htm. ).
- Wild SR, Berrow ML, McGrath SP, Jones KC. 1992. Polynuclear aromatic hydrocarbons in crops from long-term field experiments amended with sewage sludge. Environ Pollut. 76(1):25–32. doi:10.1016/0269-7491(92)90113-O
- Yu L, Cao Y, Zhang J, Cui Z, Sun H. 2012. Isotope dilution-GC-MS/MS analysis of 16 polycyclic aromatic hydrocarbons in selected medicinal herbs used as health food additives. Food Addit Contam Part A Chem Anal Control Expo Risk Assess. 29(11):1800–1809. doi:10.1080/19440049.2012.711778
- Zelinkova Z, Wenzl T. 2015. The occurrence of 16 EPA PAHs in food–a review. Polycycl Aromat Compd. 35(2–4):248–284. doi:10.1080/10406638.2014.918550
- Zhou Y, van Leeuwen SP, Knobloch M, Dirks C, Weide Y, Bovee TF. 2021. Impurities in technical mixtures of chlorinated paraffin show AhR agonist properties as determined by the DR-CALUX bioassay. Toxicol in Vitro. 72:105098. doi:10.1016/j.tiv.2021.105098