
 ?Mathematical formulae have been encoded as MathML and are displayed in this HTML version using MathJax in order to improve their display. Uncheck the box to turn MathJax off. This feature requires Javascript. Click on a formula to zoom.
Abstract
In the view of a circular economy, there is an increasing need for (re-)using animal by-products that have a wide range of applications and sufficient safety. Hydrolysates of animal proteins (HPs) are frequently used as feed ingredients. Nevertheless, clear criteria for legal use and methods for monitoring feed applications are not available. Here, a range of methods have been used and evaluated for characterizing a set of 26 samples of hydrolysed proteins, ‘hydrolysed’ feather meals and processed animal proteins (PAPs), with verification based on an additional set of eight samples. Methods included determination of ash content, sediment (mineral fraction) content, protein content, species identity, solubility, protein solubility, size exclusion chromatography and polyacrylamide gel electrophoresis (SDS-PAGE). After a comparison of results obtained with water and SDS, water was chosen as the solvent for environmental and occupational reasons. Typical HP samples have a protein content higher than 60%, a solubility exceeding 50% and a virtual absence of a mineral fraction. The first discrimination between HPs and PAPs could be based on the absence or presence, respectively, of a mineral fraction. An approach for HP characterization is designed using a Hydrolysation Index (HI) based on the fraction of peptides smaller than 10 kDa, the solubility of the sample and the fraction of soluble proteins. A simplified version (HIs), exclusively based on the fraction of peptides smaller than 10 kDa and the solubility of the sample, shows a trend among the samples highly comparable to HI. Values for HI and HIs exceeding 60% would characterise HPs. Feather meals, which are heat treated instead of treatment by a chemical process of hydrolysation, range among the PAPs and should not be indicated as “hydrolysed.” The HIs can be used as an easy parameter for classifying HPs and for legal enforcement.
Introduction
In the view of a circular economy, there is an increasing need for (re-)using animal by-products, which have a wide range of applications and which need to be safe and reliable with respect to animal diseases (zoonoses, prions). Hydrolysates of fish by-products are frequently used as an ingredient in fish feed since it improves the quality and applicability of the feed (Chalamaiah et al. 2012; Derouiche Ben Maiz et al. Citation2019). Other sources of hydrolysed proteins include meat (Borrajo et al. Citation2019), whey (Eberhardt et al. 2019), pig material (Liu et al. Citation2010; Chen et al. Citation2019) and insects (Nongonierma and FitzGerald Citation2017).
Fish protein hydrolysates provide properties such as increased solubility, capacity for water binding, oil absorption and gelling activity (Chalamaiah et al. 2012). Several advantages and benefits have been described, including growth performance, antioxidant and antimicrobial activity, immune response and enhanced gut microbiota (Kotzamanis et al. Citation2007; Tang et al. Citation2008; Borrajo et al. Citation2019; Chen et al. Citation2019). Experiments with rats showed a decreased level of cholesterol in their blood and several effects on the enzymes involved after feeding with hydrolysed fish proteins (Hosomi et al. Citation2012). The soluble fraction of proteins after hydrolysis is functioning as a plasticizer in the production of fish feed (Oterhals and Samuelsen Citation2015).
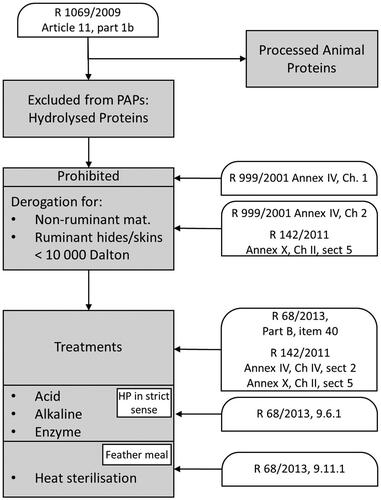
Hydrolysed proteins (HPs) in the context of animal feed are legally defined as polypeptides, peptides and amino acids, or their mixtures, resulting from the hydrolysis of animal by-products (Regulation (EU) 142/2011, Annex I, item 14: European Commission 2011). A range of animal by-products, including HPs, is excluded from the definition of processed animal proteins (PAPs; Regulation (EU) 142/2011, Annex I, item 5) and is, as consequence, not subjected to the species-to-species ban (). Feeding of HP of animal origin is initially prohibited (legal references in ). However, derogations are installed for feeding to non-ruminants of HPs derived from: a) parts of non-ruminants, or b) ruminant hides and skins. The same derogation applies feeding to non-ruminants. HPs derived from ruminant hides and skin should have a maximum molecular mass of 10 000 Dalton (10 kDa). Legal processing options are acid treatment, alkaline treatment, enzyme treatment and high-temperature sterilisation in order to achieve shorter protein chains. The Feed Catalogue lists two feed materials as HP: item 9.6.1 (hydrolysed proteins) and item 9.11.1 (feather meal). Further explanation of the legal context is shown in Van Raamsdonk et al. (Citation2019). Despite their wide options for application, HP still needs to comply with safety standards with respect to prions, pathogens and chemical contaminants.
Figure 1. Overview of major legal provisions for hydrolysed proteins.
Hydrolysation and subsequent purification could be a way to achieve the inactivation of prions and zoonotic agents. Prions are still a major concern in feed safety, although the current incidence level of Transmissible Spongiform Encephalopathies (TSEs) in the European Union (EU) and the United Kingdom is low. Treatment with hypochlorous acid is reported to result in a decrease in prion activity with a factor of 103–106 (Hughson et al. Citation2016; Giles et al. Citation2017). Acid treatment belongs to the legally accepted processes for the production of HP. Another major issue is the possible accumulation of veterinary drugs, such as growth promoters and hormones, or other chemical compounds when closing the circle of legal feeding of animal products back to animals (FAO 2019, p. 138–143). Although exempted from the species-to-species ban, HP is subjected to all safety measures that apply to feed ingredients and they need to comply with the legal limits. Some legal processes for producing HP might be expected to destruct other chemical compounds as well (FAO 2019, p. 213).
Some existing methods could be relevant for the analysis and characterization of HP. Standard sedimentation and microscopic examination of processed animal proteins are laid out in Regulation (EC) 152/2009 (European Commission Citation2009), Annex VI. Raw Protein Measurement is included in Regulation (EC) 152/2009 as well (Annex III point C, equivalent to ISO 5983). A method for solubilized protein measurement (SPM) is available by means of a French harmonized method (BIPEA E.10.AN 79.12). However, neither a method for measuring the degree of hydrolysation by establishing the molecular mass of the HP and peptides nor a method for identifying the source animal is readily available and tested for the specific situation of HP.
In the view of legal enforcement, the degree of hydrolysation and the source animal need to be established. The degree of hydrolysation is defined as the proportion of cleaved peptide bonds in a protein hydrolysate, considering parameters of the raw materials and of the process of hydrolysation (Nielsen et al. Citation2001; Nilsang et al. Citation2005; Batista et al. Citation2010). The degree of hydrolysation varies from 5% to 40% in commercial samples (Chalamaiah et al. 2012). The parameters mentioned cannot be collected in practice, since the a-priori situation cannot be assessed for marketed material. Therefore, derived and indirect criteria have to be developed and applied, hence the term ‘rate of hydrolysation’ will be used throughout this paper.
A range of parameters can be investigated for characterisation of animal products. The presence of sediment (heavy fraction) can be established with standard procedures (Regulation (EC) 152/2009, Annex VI). A general observation can be carried out by microscopy, with additional spot tests for protein detection, or for detecting mixtures (addition of fat, starch a.o.). It is obligatory to confirm that most of the sample material and, hence, of the pellet consists of proteins. The solubility in water or in a buffer can be established with standard procedures. If the amount of pellet is used for determining the solubility of the proteins, it needs to be confirmed that a relationship exists between the amount of the insoluble portion and the total protein content. The portion of the sample that does not dissolve in water or in a buffer does not necessarily consist of non-hydrolysed protein material. The profile of protein molecular masses can be established by means of sodium dodecyl sulphate polyacrylamide gel electrophoresis (SDS-PAGE) or size exclusion chromatography combined with ultraviolet detection (SEC-UV). SEC-UV in combination with other techniques has been used for HP characterization in literature (Hong et al. Citation2012; Shamloo et al. Citation2012; Silva et al. Citation2014; Rocha et al. Citation2017; Acquah et al. Citation2019). Only the soluble part of the sample can be subjected to SDS-PAGE or to SEC-UV. Proteins with a naturally occurring molecular mass below 10 kDa could coexist with the HPs with a molecular mass still higher than 10 kDa if these proteins are not fragmented in the hydrolysation process. These are, however, representing a minor part of the natural diversity of protein molecular masses (CRC protein handbook, part II: Darnall and Klotz Citation2018). The identity of the source animal and protein identification can be established by LC-MS if the proteins are not highly hydrolysed to amino acids and if unique peptides can be still detected. Since DNA will not be destructed by means of certain hydrolysation procedures, most notably enzyme treatment, DNA would be a feasible basis for identification of the source animal. Fragments of proteins are commonly indicated as peptides when consisting of less than 50 amino acids which would relate to a molecular mass below 10 kDa. A protein mixture resulting from hydrolysation, would still consist of complete proteins, almost exclusively with a mass exceeding 10 kDa, and peptides with most probable a mass lower than 10 kDa. In a chemical sense, proteins and peptides are chains of amino acids and in the framework of this study the resulting mixture after hydrolysation of chains of amino acids of any mass will be indicated as proteins.
A measure for the rate of hydrolysation needs to be developed, reflecting the state of the sample in the view of the legal obligations in the best way possible, and be tested for applicability in practice. This study will focus on the applicability of a measure for solubility and on the derivation of the share of protein molecular masses below 10 kDa from an SEC-UV profile, and their combination in an index indicator. Other criteria will be added for constructing a strategy for monitoring the hydrolysed samples.
Based on the legal requirements, monitoring methods should be capable of indicating two characteristics: 1. the proportion of proteins/peptides with a molecular mass lower than 10 kDa in the sample, and 2. the origin of the sample material, either ruminant or non-ruminant. This paper will present a range of methods for characterising HP and for classification in the frame of the legal requirements. Based on these results, a measure will be presented for discrimination between HP and other types of animal by-products, e.g. PAPs.
Materials and methods
Basic data and procedure
A set of 26 samples, indicated as set A, has been collected in different EU countries over the last 5 years for developing data on a range of different parameters. Label declaration indicated HP (18 samples) originating from ruminant (whey powder), porcine, poultry and fish, processed animal proteins (6 samples) originating from porcine, poultry and fish, and processed feather meal (2 samples) declared as “hydrolysed feather meal”. The data collected include qPCR identification, sediment content, ash content, protein content, solubility and share of proteins with a molecular mass below 10 kDa based on SDS-PAGE or on SEC-UV. In all relevant situations, analyses were carried out on both pellets and supernatant collected after dissolution in water or in SDS buffer. The amount of non-soluble material (pellet) was also established using artificial saliva (a saturated buffer of di-Sodium hydrogen phosphate and sodium bicarbonate with sodium chloride and potassium chloride).
A set of eight samples of HP, indicated as set B, was used as confirmation of the collected parameters for all analyses. Descriptions of all samples with their characteristics are shown in Supplemental Material A. The results for the parameter “share of molecular mass below 10 kDa” together with the calculated indices are shown in Supplemental Material B. All overviews are sorted by weight% of the pellet in SDS.
Methods
Methods and necessary standards are presented in Supplemental Material A.
Strategy
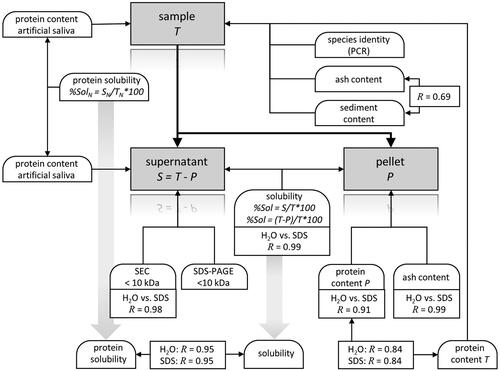
At the start of the study neither the relevance of certain parameters nor the level of threshold values was established for compliance with legal demands. Therefore, a range of different methods was tested and evaluated. Current legal parameters include the fraction of proteins below the molecular weight of 10 kDa and the type of source animal. Solubility has been used as an indicator of the degree of hydrolysation. These parameters have been examined with different methodological approaches. Parameters other than molecular mass, animal type or solubility have been evaluated in this study for achieving a wide basis for the classification of hydrolysed proteins. An overview of the analyses applied, with their mutual relationships is shown in . The section Results presents all results of a single analysis as set out in Supplemental Material A (Methods). Evaluations of these results will be provided in the Discussion, together with indices for the classification of HP.
Figure 2. Overview of the analyses applied for characterization and evaluation of the samples. Mutual relationships of the results are expressed by means of their correlation coefficients.
Results
The parameters and results for the characterization of the samples are shown in Supplemental Material B. Results for the evaluation and classification (solubility in water, % share of proteins with a mass below 10 kDa in water, and the resulting criteria) are shown in Supplemental Material C. The tables provide information for the separate sample sets A and B, and per set, the results for these samples are presented in order of decreasing solubility in water.
General characterisation of the 26 samples in set A
The samples with their basic characteristics are shown in Supplemental Material B. The colour distribution across the columns for the respective parameters indicates the value range per parameter.
Species identification of hydrolysed proteins
The species identification of HP was performed by species-specific qPCR detection methods for ruminants (a.o. cattle), pigs, and poultry (chicken, turkey). Of the 34 samples in Supplemental Material B, three samples did not have a label indication for the origin of the sample and were therefore omitted from the tests. Three out of three cattle samples were positive for ruminant, nine out of nine of the pork samples were positive for pig and six out of nine of the poultry samples were positive for poultry. The three samples of poultry HPs that did not respond to the EURL-chicken/turkey method (https://www.eurl.craw.eu/wp-content/uploads/2021/09/EURL-AP-SOP-Poultry-PCR-V1.0.pdf) did also not respond to the WFSR-poultry method (chicken/turkey/ducks/geese: Scholtens et al. Citation2017, Citation2019). Eight out of ten of the fish samples were positive for fish.
Sedimentation of the heavy fraction and ash content
presents the distribution of the sediment and ash content over three groups of samples (according to the label hydrolysed proteins, processed animal proteins, or feather meals). A moderate relationship is found among these two parameters (R = 0.69). It can be assumed that the heavy fraction (sediment) and the ash consist partly of the same minerals. Some exceptions exist. Samples 512413, 510652 and 512415 showed a relatively high ash content (11.3%, 13.9% and 41.4%, respectively) and only traces of sediment. This could be clarified by assuming the presence of minerals with a low specific density.
Table 1. Sediment and ash content (% w/w) in samples of set A.
It was not possible to quantify the share of the heavy fraction as extracted by the solvent Tetrachloroethylene (TCE) (sediment: specific density exceeding 1.62 g/cm3) for all samples. In those cases where sediment was very limited or absent, the share was indicated as “traces.” A higher share of the heavy fraction in the PAP and feather meal samples were expected to be quantified at levels known from the literature (PAP: 14–52%, Fumière et al. 2017; Veys et al. Citation2017; feather meal: 0.1% after removal of most of the heavy fraction; Veys et al. 2009; Fumière et al. 2017). The shares of sediment material ranged from 0.9% to 31.4%, with one deviating sample of HP showing a share of 0.89% of sediment material (n = 9: PAPs: 6, feather meals: 2, HP: 1 [510659]). These sediments contained bone or fish bone fragments. Samples labelled as HP all except 1 showed no or very limited sedimentation (traces, or sediment of less than 0.2%; n = 17).
The overview in provides a sufficient basis for the discrimination of the group of HPs from other animal proteins such as PAPs. The extraction of sediment or heavy fraction from an animal by-product is a necessary first step in the analysis of PAPs (Regulation (EC) 152/2009, Annex VI). The decision to subject a sample to either the follow-up as defined for PAPs or to the specific methods as will be presented here for HP could be based on the presence of sediment above a certain threshold.
Solubility of the sample material
The solubility of the total material in a sample was established in two ways: dissolution in water and in an SDS buffer. In addition, the solubility of the protein fraction was established by means of a dedicated procedure using artificial saliva for a subset of the samples from set A. The ranges, averages and medians are shown in . Water as solvent showed the capability to dissolve at least a part of the sample material (minimum = 6.3%) even in relatively extreme conditions.
Table 2. Solubility of the total sample material (100 – Pellet share; % w/w) in samples of set A, and the solubility of the protein fraction in selected samples of set A.
An alternative way to solve sample material in water or an SDS buffer and collect the pellet material regardless of its composition is to focus on the protein fraction. A specific buffer solution, indicated as artificial saliva, has been used to extract the proteins from the sample material. Two protein analyses per sample are needed to find the protein content of the total sample and that of the soluble part. The following equation will give the solubility of the proteins:
[1]
[1]
With:
%psupernatant: the crude protein portion of the supernatant (% w/w),
%ptotal: the crude protein portion of the total analysis sample (% w/w).
A subset of the sample set A consisting of 15 samples has been analysed for their soluble protein fraction. It can be hypothesized that a relationship will exist between the solubility of the total sample material based on the share of the pellet and the specific solubility of the protein fraction, especially for those samples primarily consisting of protein material.
The correlations between the results of the three procedures and types of solvents, either the solubility in water or an SDS buffer, or the specific solubility of the protein fraction are shown in . These correlations indicate high comparability among the effects of the several procedures and solvents. The obtained insoluble fractions after using water or SDS as solvent show an almost identical distribution among the samples of set A. The solubility of the protein portion in the samples after applying the artificial saliva is highly comparable to the results obtained with the other solvents. The slightly lower correlation of the results after using the artificial saliva with either one of the two other solvents could be clarified from a varying protein content.
Table 3. Correlation of pellet share (% w/w) among three different solvents in samples of set A.
The solubility of the protein portions is shown in . Four PAPs in this subset showed a portion of soluble proteins of less than 60%, and both feather meals less than 20%. Sample 512414 is comparable to the PAPs, and sample 512416 is comparable to the feather meals. The samples are ordered from left to right in along with a decreasing solubility of the total sample material in water. The relationship between total solubility and protein solubility () is visible in by means of the decreasing bar heights to the right of the plot.
Figure 3. Fraction of soluble protein for 15 samples, arranged according to a decreasing solubility of the total sample (left to right). Blue bars: hydrolysed protein samples. Red bars with blue borders: PAPs. Green bars with red borders: feather meals.
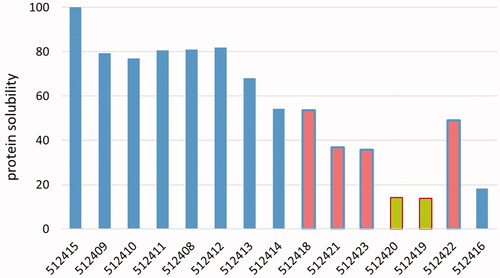
Table 4. Correlation of protein content (% w/w) among total sample material and pellets obtained in two different solvents in samples of set A.
Protein content
The protein content of the sample and of the pellet was determined using the Kjeldahl method (Regulation (EC) 152/2009, Annex III, part C). This method is targeting the nitrogen content, which is recalculated to protein content by using a constant factor of 6.25. This procedure would include the share of non-protein nitrogen-containing molecules, such as DNA (Mariotti et al. Citation2008). Besides the desire to use the official method according to Regulation (EC) 152/2009, the results will be used in comparing sample materials that contains similar amounts of compromising material, and in ratios, which would compensate for errors in protein content analysis.
The share of protein in the samples of set A ranged from 45.4% to 87.5%. The PAPs fit in this range with a diversity of 45.4% to 67.8%. The two feather meals are protein-rich with 83.1% and 87.5%. The overview of the results is presented in Supplemental Material B. The two samples of HP showing a moderate to high ash content (sample 512413: 11.3%, 512415: 41.4%) consist of low content of proteins (below 50% but still exceeding 45.4%). Especially the amount of the remainder of the sample material is considerable for sample 512413 (100% – 48.2% [protein] – 11.3% [ash] = 40.5%). This fraction could consist of fat or other organic material.
The protein contents of the pellets after extracting the soluble part of the sample material were comparable to that of the total sample material. The correlation coefficients are shown in . The correlations between either one of the versions for obtaining a pellet and the total sample are lower than the correlation between the two pellet types. This is caused by the protein contents of three samples. The samples 510652, 470662 and 510659 showed a protein content in the total sample between 66.6% and 75.0%, with much lower protein content in the pellets between 41.1% and 53.7% (Supplemental Material B). In general, there is a good relationship between the protein content of the entire sample and of the pellet. As already pointed out for the determination of the solubility, water and SDS as solvents provide highly comparable results.
SDS-PAGE
A selection of 13 samples from set A was examined by using the technique for the separation of proteins in SDS-PAGE between 10 and 200 kDa. Determination of the range in molecular masses of the samples in the SDS-PAGE gel was performed by using standard protein markers (see Supplemental Material A). The SDS-PAGE method resulted in high repeatability among replicates. An example of results is shown in .
Figure 4. Separation of peptides according to molecular mass using SDS-PAGE. 10 kDa fragment of the ladder is indicated at the left. Sample types: 512408 and 512411: hydrolysed proteins, 512422 and 512423: PAPs.
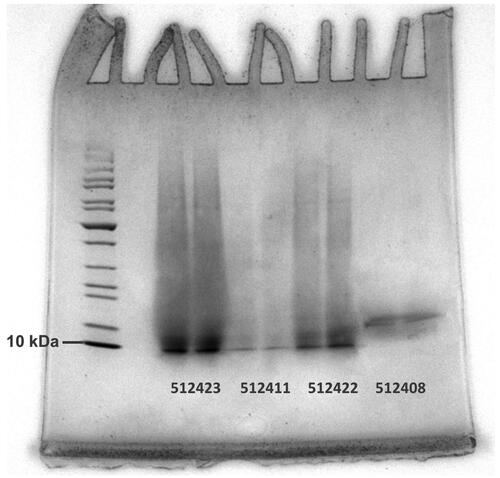
The total protein profile per sample in shows the mass range of the detected proteins in the samples, with the most intense bands representing the highest density in the proteins. The PAPs (samples 512422 and 512423) show a much larger mass diversity of proteins larger than 10 kDa compared to the HP (samples 512408 and 512411). Sample 512408 shows the most intense band at approximately 15 kDa. Due to the lower solubility of the PAP samples, a less dense profile can be expected for the samples 512422 and 512423 compared to the HP. Here, this is, however, not demonstrated. In general, the investigated PAP profiles indicate the presence of many proteins and peptides which are close in mass and cannot be differentiated on the SDS-PAGE. It can be concluded that SDS-PAGE as technique can give an indication of the composition of the proteins in a sample in a qualitative sense. SEC-UV will be explored as an alternative technique in the next section.
SEC-UV analysis
To estimate the molecular mass distributions of the soluble protein hydrolysates, SEC-UV analyses were carried out. Three example SEC-UV chromatograms, with different rates of hydrolysation, are shown in . The extensively hydrolysed porcine protein sample (510652) shows a good solubility (3.3% pellet in H2O and 3.8% pellet in 2% SDS, respectively). The percentage of HP observed in the mass range <10 kDa is 90.8% for the sample dissolved in both H2O and 2% SDS respectively (). The hydrolysed protein of sample 512408 shows a lower solubility (29.1% pellet in H2O and 23.5% pellet in 2% SDS, respectively) with hydrolysation rates of 82.1% in H2O and 76.2% in 2% SDS (). The PAP from fish (512422), which is not hydrolysed, is significantly less soluble (89.9% pellet in H20 and 93.8% pellet in 2% SDS) and shows a percentage of hydrolysed protein with mass <10 kDa of 39.2% for the sample dissolved in H2O and 34.8% for the sample dissolved in 2% SDS ().
Figure 5. SEC-UV (214 nm) chromatograms of hydrolysed proteins in three samples in both H20 and 2% SDS. The 10 kDa limit is indicated as a vertical line. The intensity of the detected signal is indicated in mAU. Note the different scales of the y-axes. (a) sample 510562, (b) sample 512408, (c) sample 512422.
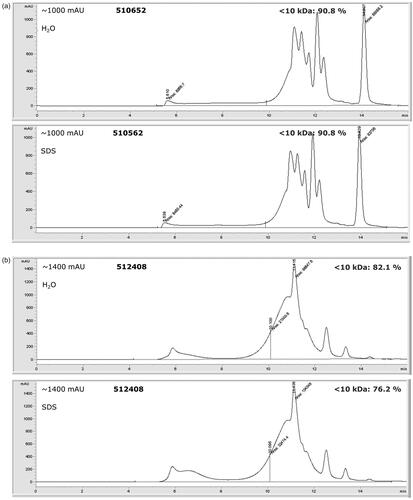
The protein contents for the total samples were determined at 66.6% and 79.4% for the hydrolysed protein in samples 510652 and 512408, respectively. The protein content of PAP sample 512422 was considerably lower at 45.4%. A considerable difference between the crude protein content in the total sample of 510652 and the established pellet was considerable at δ = 20.8%.
As hypothesized for the SDS-PAGE gels, the SEC-UV profiles should reflect the amount of soluble protein in a sample. Two parameters are available for evaluating the relation between solubility and the SEC-UV results. These are the total area under the SEC-UV profile (R = 0.83 with solubility in water) and the intensity of the signal of the highest peak in the profile (R = 0.86). Sample 512415 appears to take a deviating position in the trend of these relationships. Considering this sample as an outlier, the correlations change to R = 0.94 and R = 0.90 between the SEC-UV results and the solubility, respectively. It cannot be concluded to derive all necessary information for classifying samples as HP exclusively from the SEC-UV analysis since an outlying position of a sample can only be established based on sets of information. The results for solubility determined independently from the SEC-UV analysis remains necessary.
Validation with additional samples of set B
The results obtained for the 26 samples of set A were complemented with an additional set with eight samples of HP (set B). Several already calculated parameters indicating the difference among the two solvents have been recalculated for the total set of 34 samples and are presented in . The addition of eight samples of HP did not change the response of the total sample set to the application of either water or SDS-buffer.
Table 5. Correlations among two different solvents (water vs. SDS-buffer) for ash content (% w/w), crude protein content (% w/w), pellet share (solubility (% w/w)) and the fraction of proteins with a molecular mass below 10 kDa (%) in the combined sample set A + B.
In the view of overall highly comparable performance (), water was chosen as the solvent for the experiments for classification of the samples for the absence of environmental exposure, occupational hazards and costs. The further evaluation of the samples and of the structure of the current dataset will therefore be based on the results with water as solvent.
Discussion
This study aims to derive an Index that would serve as an indicator of the rate of hydrolysis for legal monitoring. In order to conclude the characterization of the samples, first, the relationships between the several parameters will be discussed.
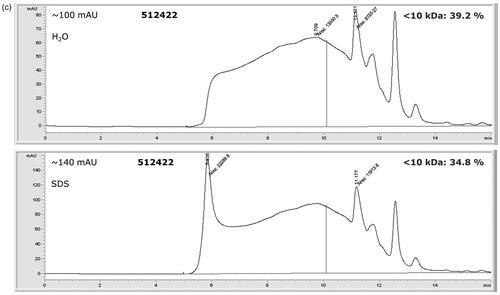
On the basis of the current results, the samples of set A and of set B can be considered to be two independent selections taken from one hypothetical population of all possible HP. For the further analyses and derivation of an index for the classification of HP, both sets will be combined into one set. Candidate parameters for serving as the criterion for the classification of HP are the percentage solubility of the total sample, derived from the pellet percentage, the share of proteins with a molecular mass below 10 kDa, or a combination of these two parameters. The relationship between these two parameters is shown in . The samples of set B (yellow centre) and the PAPs (red centre) are indicated. The four samples represented separately as squares are selected on the basis of specific indication (feather meal) or on the basis of a-posteriori results.
Figure 6. Relationship between pellet% (inverse of solubility) and share of molecular weights below 10 kDa (n = 34; water). Blue circles: all hydrolysed proteins and PAPs; yellow centre: set B; red centre: PAPs. Dotted blue squares: deviating hydrolysed proteins. Green squares/red border: feather meals. Red line: HIs = 60%; see text. Red squares: three samples of which the SEC-UV profiles are shown in (from left to right: 512422, 512408 and 510652). The shaded area to the left indicates the situation that the share of the soluble part of the sample is too low to be indicative of characterising the total sample.
Identification of the source material by PCR
Current EU legislation includes a restriction on the use of ruminant source material for the production of HP. Only hides and skins of ruminants are authorised as source materials for HP and a limit of 10 kDa is compulsory (). Therefore, in case further identification of the source animal is required, identification by PCR is explored. Two of the poultry samples that did not respond to the poultry detection method contained ‘hydrolysed’ feather meal, which is known to contain little or no DNA. Two of the fish samples did not respond to an experimental ‘all-fish’ detection method, consisting of two sets of primers and an identifying probe. For the fish method, it was already known that flatfish do not respond to this method (unpublished results of EURL-AP and WFSR). Furthermore, since the purpose of these samples was to provide aromatic powder for pet food (by an enzymatic process), this could have influenced the detection as well. In general, a plausible explanation for the inability to detect the targets is DNA degradation caused by the method of protein hydrolysis, making it impossible to detect the targets for the donor species. Another possibility is that the material description was not correct.
Derivation of a criterion for classification of hydrolysed proteins
The first step for the classification of samples of HP is to approve the eligibility of a particular sample for the set of methods presented here. The sedimentation procedure will be proposed as verification of this eligibility. This is already a required step in the monitoring of PAPs (Regulation (EC) 152/2009, Annex VI). In case of the virtual absence of sediment (smaller than a threshold level, to be fixed), a decision needs to be made on the way to proceed.
Two techniques are available for collecting documentation on the size profile of the peptides in a sample. Based on the discussed results for SDS-PAGE and for SEC-UV and using parameters for applicability (Supplemental Material D), SEC-UV will be used for characterizing the share of peptides with a molecular mass below 10 kDa.
The proteins enclosed in the pellet are not available for analysis, with the consequence that the real percentage of proteins in the total sample cannot be observed, and the real percentage of protein with a molecular mass below 10 kDa in the pellet will therefore remain unknown as well. Alternative approaches could be the estimation of the maximum portion of protein with a molecular mass below 10 kDa, with a correction for the pellet mass, or the estimation of the minimum portion of protein with a molecular mass below 10 kDa with the same correction. Our goal is to assure a share of protein with a molecular mass below 10 kDa as high as reasonably achievable. This can be enforced with a legal restriction by setting a minimum percentage for the required share of protein with a molecular mass below 10 kDa. If the actual percentage, as based on the soluble fraction only, of a given sample matches exactly the legal minimum percentage, this can eventually be higher if a certain part of the pellet also consists of protein with a molecular mass below 10 kDa. A parameter should therefore indicate the portion of the sample that represents the minimum share of the proteins with molecular masses below 10 kDa in the total sample. The calculation of a Hydrolysation Index (HI) should be based on the fraction of protein with a molecular mass below 10 kDa of the total protein content of the soluble portion, adjusted for the protein content of the pellet. This can be calculated as follows:
[2]
[2]
With:
%<10kDa: the portion of protein with a molecular mass below 10 kDa in the soluble fraction; the result of SEC-UV analysis,
%pellet: the portion of the pellet in the total sample (w/w), results of the solubility experiment in water,
%pellet: the crude protein portion of the pellet (% w/w),
%total: the crude protein portion of the total analysis sample (% w/w).
The HI can be calculated after four different analyses:
The establishment of the solubility (production of the pellet) of laboratory sample A,
The establishment of the percentage of protein with a molecular mass below 10 kDa in the soluble fraction of sample A,
The establishment of the share of crude protein in the pellet from sample A,
The establishment of the share of crude protein in the total sample. Since laboratory sample A is used for the first three experiments, a second identical laboratory sample B is needed for this analysis.
This index ranges from 0% to 100%. It is a value indicating the minimum share of protein fragments with a molecular mass below 10 kDa adjusted for solubility. The individual values for HI per sample are presented in Supplemental Material C. There can be two sources of bias. At first, some insoluble HP (a part of the pellet) might exist with molecular masses below 10 kDa. This means that the index could be an underestimation. Secondly, some native proteins have molecular masses below 10 kDa. The number of these small proteins is limited (Darnall and Klotz Citation2018), which indicates a limited chance of overestimation. The underestimation of missing insoluble peptides smaller than 10 kDa can be assumed to be larger than the overestimating effect of the naturally existing small proteins, which assures that the Index is an indication of the minimum share of the targeted peptides.
This approach, requiring four different analyses, is elaborate due to the double analysis of crude protein and can be expected to become costly for routine analyses. Therefore, an alternative approach has been developed solely based on the solubility and the share of protein fraction with a molecular mass below 10 kDa in the soluble fraction:
[3]
[3]
With:
%<10kDa: the portion of protein with a molecular mass below 10 kDa in the soluble fraction; the result of SEC-UV analysis,
%pellet: the portion of the pellet in the total sample (% w/w); the result of the solubility experiment in water.
This equation can be described as a derived version of EquationEquation [2][2]
[2] leaving out the parameters of EquationEquation [1]
[1]
[1] and ignoring the part of the pellet that consists of non-protein material (e.g. salts, mineral: ash-content). The legal lower limit to decide upon the classification of the sample should be adjusted for the approach to be chosen. The index HI degrades to the index HIs when the crude protein content of the total sample equals the crude protein content of the pellet. The differences between these two indicators of protein content appeared to be limited for most samples in the tested set of 34 samples.
The correlation between HI and HIs for the sample set A is R = 0.997, and for the combined set A + B R = 0.993. Using a lower limit (LL) of 60%, the number of samples in the combined set A + B (n = 34) classifying as HP according to the approach HIs is n = 16. Using approach HI and the same lower limit, sample 512412 classifies additionally as an HP. Stratification of these counts and the effect of other lower limits are given in . The lower limit of 60% seems a reasonable threshold for classifying protein material subjected to a process of hydrolysation (acid, alkali or enzyme processing) as hydrolysed, since the term “hydrolysed” as used by expressing the degree of hydrolysation is varying from 5% to 40% in commercial samples (Chalamaiah et al. 2012).
Table 6. Numbers of samples is classified as hydrolysed proteins with five different thresholds.
The 16 samples passing the lower limit of 60% for both indices have a high percentage of (hydrolysed) proteins with a molecular mass below 10 kDa exceeding 79% and a solubility exceeding 67% (%pellet < 32.6%). In these samples, less than 29% of the crude protein content was locked up in the pellets. Sample 512413 (peptides < 10 kDa: 88.0%; %
pellet = 45.05%) showed a relatively high portion of 39.3% of the total crude protein content in the pellet. This share influenced the difference between the values for HI =53.4 and for HIs = 48.4, which would give a different classification when LL = 50%.
High levels of ash content (exceeding 15%) are co-occurring with high sediment amounts (exceeding 15%). These levels were found among the samples with PAP material. The causal relationships among these two parameters are based on the presence of bone material with a high content of calcium phosphate. There are two exceptions. Sample 568452 showed a value for HIs = 92 combined with an ash content of 24.5%. The entire protein content of sample 512415 (HI = 100) is shown to be smaller than 10 kDa, yet an ash content (41.4%) was found, which is higher than found in the PAP samples. Only trace amounts of sediment material were found in both samples. This indicates the presence of minerals with a specific density below 1.62 g/cm3, which will not concentrate in sediment. In general, samples could be mixtures of HP combined with other materials.
Five samples labelled as HP never meet the requirement of any LL of 50% or higher (; Supplemental Material C), caused by either a moderate or low solubility (samples 512414, 512416, 510658) or a combination of moderate shares of soluble protein and of peptides smaller than 10 kDa (samples 510653, 510659). The crude protein content of these five samples varies between 50% and 88%, with at least 21.5% locked in the pellet. It appears that samples with values above 60% for both indices have less than 23.9% (with one exception: 512411) of the total crude protein content hidden in the pellet and therefore unavailable for further analysis. These trends illustrate the minimum required amount of disclosed protein and indicate the value of the simplified index HIs for characterizing HP.
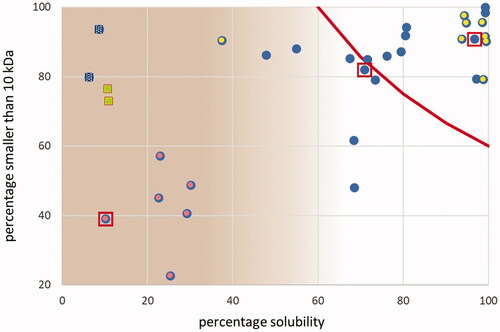
The behaviour of the two indices is simulated by using the values for three parameters (portion <10 kDa/%solubility/total crude protein content) for the three samples in plotted against the crude protein content of the pellet (x-axis) and the resultant of both indices at the y-axis. The results are shown in . The value for HIs acts independently from the crude protein share in the pellet since this parameter is not included in the equation for this index (EquationEquation [3][3]
[3] ). The index HI will solve to index HIs when the crude protein content of the total sample and of the pellet are identical, indicated by the intersection of the two lines of the indices per sample (
when the condition
is met). The shift from the situation where the crude protein content of the pellet equals the crude protein content of the total sample is shown in . Sample 512408 shows a small difference between the values for the two indices (difference between the crude protein content of the sample and the pellet δ = 4.4%), with a protein portion in the pellet close to the intersection. There is a large difference between the crude protein portions of the sample and the pellet (δ = 20.8%) for sample 510652, but this has a negligible influence due to the high solubility and high portion of proteins with a molecular mass below 10 kDa. In contrast, the difference in protein contents of the total sample and of the pellet is relatively low (δ = 7.8%) for sample 512422, which still has a large effect on the values for the indices, due to the low solubility and low portion of proteins with a molecular mass below 10 kDa. This PAP sample classifies clearly as non-hydrolysed according to both indices.
Figure 7. Simulation of three types of hydrolysed proteins based on four different parameters. Red lines: portion <10 kDa: 90.8% / total solubility: 96.7% / total crude protein content: 66.6%. Blue lines: portion <10 kDa: 82.1% / total solubility: 70.9% / total crude protein content: 79.4%. Yellow lines: portion <10 kDa: 39.2% / total solubility: 10.1% / total crude protein content: 45.4%. Straight lines: HI, dotted lines: HIs. Vertical lines: indication of percentage crude protein in pellet for sample 510652 (45.8%), sample 512408 (83.8%) and sample 512422 (37.6%). For further explanation, see the text.
Based on the current experimental results a legal LL of 60% for any of the two indices is proposed, to be controlled by means of the approach without adjustment for the crude protein content of the pellet (HIs). The area in the total diversity space covering all combinations resulting in values for HIs of 60% or higher is indicated in by a red line. The area in the upper right corner is a minor part of all possible combinations of solubility and molecular masses. A higher lower limit for the Hydrolysation Index would further restrict the opportunity to apply HP as the solution in circular agronomy.
Conclusions
The large diversity of animal by-products and the complicated structure of legal applications demand the availability of a family of different monitoring methods. Besides the legal category of processed animal products with their dedicated monitoring by means of microscopy and PCR inspection (European Commission Citation2009; amended version 2021), mass spectroscopy methods exist for blood meal and blood products (Lecrenier et al. Citation2016, Citation2018). One of the other types of animal by-products with their specific legal position is hydrolysed proteins. This paper has reviewed a set of different methods for characterization and the development of an index is presented focusing on two parameters:(a) the solubility and (b) the share of peptides with a molecular weight below 10 kDa. An initial selection of the appropriate monitoring method can be based on the presence of a fraction with a specific density exceeding 1.62 g/cm3. The separation of this fraction, usually consisting of minerals or bone fragments, is part of the already implemented microscopy method. With a share of this fraction below a certain threshold, the sample material can be assumed to consist of HPs and the procedure as presented in this paper can be applied. The current results provide a connection between the practice of using protein hydrolysates and the legal framework.
Supplemental Material
Download Zip (447.2 KB)Acknowledgement
This study was financed by the Dutch Ministry for Agriculture, Nature and Food Quality under contract number WOT-02-004-016. We will thank our colleagues M. Bremer, J. de Jong and A. Verschoor for helpful discussions on this study.
Disclosure statement
No potential conflict of interest was reported by the author(s).
References
- Acquah C, Chan YW, Pan S, Agyei D, Udenigwe CC. 2019. Structure-informed separation of bioactive peptides. J Food Biochem. 43(1):e12765. doi:10.1111/jfbc.12765
- Batista I, Ramos C, Coutinho J, Bandarra NM, Nunes ML. 2010. Characterization of protein hydrolysates and lipids obtained from black scabbardfish (Aphanopus carbo) by-products and antioxidative activity of the hydrolysates produced. Process Biochem. 45(1):18–24. doi:10.1016/j.procbio.2009.07.019
- Borrajo P, Pateiro M, Barba FJ, Mora L, Franco D, Toldrá F, Lorenzo JM. 2019. Antioxidant and antimicrobial activity of peptides extracted from meat by-products: a review. Food Anal Methods. 12(11):2401–2415. doi:10.1007/s12161-019-01595-4
- Chalamaiah M, Dinesh Kumar B, Hemalatha R, Jyothirmayi T. 2012. Fish protein hydrolysates: proximate composition, amino acid composition, antioxidant activities and applications: a review. Food Chem. 135(4):3020–3038. doi:10.1016/j.foodchem.2012.06.100
- Chen Y, Jiang S, Chen Q, Liu Q, Kong B. 2019. Antioxidant activities and emulsifying properties of porcine plasma protein hydrolysates modified by oxidized tannic acid and oxidized chlorogenic acid. Process Biochem. 79:105–113. doi:10.1016/j.procbio.2018.12.026
- Darnall DW, Klotz IM. 2018. Subunit constitution of proteins. In: GD Fasman, ed. CRC handbook of biochemistry and molecular biology, Third Edition, Volume II: proteins. Boca Raton, FL: CRC Press, Taylor & Francis. p. 325–371.
- Derouiche Ben Maiz H, Guadix EM, Guadix A, Gargouri M, Espejo-Carpio FJ. 2019. Valorisation of tuna viscera by endogenous enzymatic treatment. Int J Food Sci Technol. 54(4):1100–1108. doi:10.1111/ijfs.14009
- Eberhardt A, López EC, Ceruti RJ, Marino F, Mammarella EJ, Manzo RM, Sihufe GA. 2019. Influence of the degree of hydrolysis on the bioactive properties of whey protein hydrolysates using Alcalase®. Int J Dairy Technol. 72(4):573–584. doi:10.1111/1471-0307.12606
- European Commission 2009. Commission Regulation (EC) No 152/2009 of 27 January 2009 laying down the methods of sampling and analysis for the official control of feed. OJ L. 54:1–130. Luxembourg: The Publications Office of the European Union.
- European Commission 2011. Commission regulation (EU) No 142/2011 of 25 February 2011 implementing Regulation (EC) No 1069/2009 of the European Parliament and of the Council laying down health rules as regards animal by-products and derived products not intended for human consumption and implementing Council Directive 97/78/EC as regards certain samples and items exempt from veterinary checks at the border under that directive. OJ L. 54:1–254. Luxembourg: The Publications Office of the European Union.
- FAO 2019. Hazards associated with animal feed. FAO Animal production and health, report 14.
- Fumière O, Veys P, Marien A, Baeten V, Berben G. 2017. Combined microscopy-PCR EURL-AP proficiency test 2016. Final version. European union reference laboratory for animal proteins in feeding stuffs, Walloon Agricultural Research Centre, Gembloux, Belgium.
- Giles K, Woerman AL, Berry DB, Prusiner SB. 2017. Bioassays and inactivation of prions. Cold Spring Harb Perspect Biol. 9(8):a023499. doi:10.1101/cshperspect.a023499
- Hong P, Koza S, Bouvier ESP. 2012. A review size-exclusion chromatography for analysis of protein biotherapeutics and their aggregates. J Liq Chromatogr Relat Technol. 35(20):2923–2950. doi:10.1080/10826076.2012.743724
- Hosomi R, Fukunaga K, Arai H, Kanda S, Nishiyama T, Yoshida M. 2012. Fish protein hydrolysates affect cholesterol metabolism in rats fed non-cholesterol and high-cholesterol diets. J Med Food. 15(3):299–306. doi:10.1089/jmf.2011.1620
- Hughson AG, Race B, Kraus A, Sangaré LR, Robins L, Groveman BR, Saijo E, Phillips K, Contreras L, Dhaliwal V, et al. 2016. Inactivation of prions and amyloid seeds with hypochlorous acid. PLOS Pathog. 12(9):e1005914. doi:10.1371/journal.ppat.1005914
- Kotzamanis YP, Gisbert E, Gatesoupe Z, Infante J, Cahu C. 2007. Effects of different dietary levels of fish protein hydrolysates on growth, digestive enzymes, gut microbiota, and resistance to Vibrio anguillarum in European sea bass (Dicentrarchus labrax) larvae. Comp Biochem Phys A: Mol Integr Phys. 147(1):205–214. doi:10.1016/j.cbpa.2006.12.037
- Lecrenier MC, Marbaix H, Dieu M, Veys P, Saegerman C, Raes M, Baeten V. 2016. Identification of specific bovine blood biomarkers with a non-targeted approach using HPLC ESI tandem mass spectrometry. Food Chem. 213:417–424. doi:10.1016/j.foodchem.2016.06.113
- Lecrenier MC, Planque M, Dieu M, Veys P, Saegerman C, Gillard N, Baeten V. 2018. A mass spectrometry method for sensitive, specific and simultaneous detection of bovine blood meal, blood products and milk products in compound feed. Food Chem. 245:981–988. doi:10.1016/j.foodchem.2017.11.074
- Liu Q, Kong B, Xiong YL, Xia X. 2010. Antioxidant activity and functional properties of porcine plasma protein hydrolysate as influenced by the degree of hydrolysis. Food Chem. 118(2):403–410. doi:10.1016/j.foodchem.2009.05.013
- Mariotti F, Tomé D, Mirand PP. 2008. Converting nitrogen into protein—beyond 6.25 and jones' factors. Crit Rev Food Sci Nutr. 48(2):177–184. doi:10.1080/10408390701279749
- Nielsen PM, Petersen D, Dambmann C. 2001. Improved method for determining food protein degree of hydrolysis. J Food Science. 66(5):642–646. doi:10.1111/j.1365-2621.2001.tb04614.x
- Nilsang S, Lertsiri S, Suphantharika M, Assavanig A. 2005. Optimization of enzymatic hydrolysis of fish soluble concentrate by commercial proteases. J Food Engin. 70(4):571–578. doi:10.1016/j.jfoodeng.2004.10.011
- Nongonierma AB, FitzGerald RJ. 2017. Unlocking the biological potential of proteins from edible insects through enzymatic hydrolysis: a review. Inn Food Sci Emerging Techn. 43:239–252. doi:10.1016/j.ifset.2017.08.014
- Oterhals Å, Samuelsen TA. 2015. Plasticization effect of solubles in fishmeal. Food Res Intern. 69:313–321. doi:10.1016/j.foodres.2014.12.028
- Rocha GF, Kise F, Rosso AM, Parisi MG. 2017. Potential antioxidant peptides produced from whey hydrolysis with an immobilized aspartic protease from Salpicroa origanifolia fruits. Food Chem. 237:350–355. doi:10.1016/j.foodchem.2017.05.112
- Scholtens IMJ, Prins TW, Margry RJCF, Dahlmans H, van Raamsdonk LWD. 2019. Applicability of the poultry qPCR method to detect DNA of poultry processed animal protein materials. Food Control. 96:53–58. doi:10.1016/j.foodcont.2018.08.035
- Scholtens IMJ, Prins TW, van Raamsdonk LWD. 2017. Specificity of a novel TaqMan PCR method for detection of poultry DNA. Food Control. 73:532–539. doi:10.1016/j.foodcont.2016.08.045
- Shamloo M, Bakar J, Mat Hashim D, Khatib A. 2012. Biochemical properties of red tilapia (Oreochromis niloticus) protein hydrolysates. Intern Food Res. 19:183–188.
- Silva JFX, Ribeiro K, Silva JF, Cahú TB, Bezerra RS. 2014. Utilization of tilapia processing waste for the production of fish protein hydrolysate. Animal Feed Sci Techn. 196:96–106. doi:10.1016/j.anifeedsci.2014.06.010
- Tang H, Wu T, Zhao Z, Pan X. 2008. Effects of fish protein hydrolysate on growth performance and humoral immune response in large yellow croaker (Pseudosciaena crocea R.). J Zhejiang Univ Sci B. 9(9):684–690. doi:10.1631/jzus.B0820088
- Van Raamsdonk LWD, Prins TW, Meijer N, Scholtens IMJ, Bremer MGEG, De Jong J. 2019. Bridging legal requirements and analytical methods: a review of monitoring opportunities of animal proteins in feed. Food Addit Contam Part A Chem Anal Control Expo Risk Assess. 36(1):46–73. doi:10.1080/19440049.2018.1543956
- Veys P, Berben G, Baeten V. 2009. CRL-AP proficiency test 2008. Final Report. Community reference laboratory for animal proteins in feeding stuffs, Walloon Agricultural Research Centre, Gembloux, Belgium.
- Veys P, Planchon V, Colbert R, Cruz C, Frick G, Ioannou I, Marchis D, Nordkvist E, Paradies-Severin I, Pohto A, Weiss R, et al. 2017. Collaborative study on the effect of grinding on the detection of bones from processed animal proteins in feed by light microscopy. Food Addit Contam Part A Chem Anal Control Expo Risk Assess. 34(8):1451–1460. doi:10.1080/19440049.2017.1312558