
Abstract
This study focused on the investigation of cannabinoid profiles and contents of 23 different hemp teas and on the individual transfer of 16 cannabinoids from hemp teas into their tea infusions. The total cannabinoid content in the dry products averaged 14,960 mg kg−1, with CBD&CBDA (sum of cannabidiol (CBD) and cannabidiolic acid (CBDA)) being the major component, accounting for 87% of the total cannabinoid content. The Δ9-tetrahydrocannabinol (Δ9-THC) content ranged from 16 mg kg−1 to 935 mg kg−1 and was on average 221 mg kg−1. For each hemp tea, an infusion was prepared according to a standardized protocol issued by the German Standardisation body DIN and transfer rates per cannabinoid were estimated by comparing the contents in the dry material with the concentrations in the aqueous infusion. The limited water solubility of cannabinoids results in limited extraction efficiency for cannabinoids using boiling water to prepare a tea infusion and the average transfer rate of the psychoactive Δ9-THC was only 0.5%.
Keywords:
Introduction
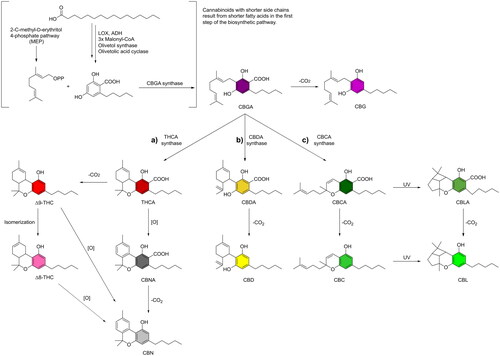
Cannabis sativa L. is a species of the genus Cannabis (family of Cannabeceae) and is considered to have two subspecies: Cannabis sativa L. subsp. sativa (fibre-type hemp) and Cannabis sativa L. subsp. indica (drug-type hemp) (Small and Cronquist Citation1976; Piluzza et al. Citation2013; Sawler et al. Citation2015; McPartland and Small Citation2020). The main cannabinoids formed during the growth of Cannabis sativa are cannabigerol (CBG)-type-, cannabidiol (CBD)-type-, tetrahydrocannabinol (THC)-type- and cannabichromene (CBC)-type compounds (Hanuš et al. Citation2016; Citti et al. Citation2018). Neutral phytocannabinoids are thought to result from the decarboxylation of their corresponding carboxylated form, which is considered a natural precursor and presents the major form in fresh plants (Citti et al. (Citation2019) and references therein). Early stages of the biosynthesis of cannabinoids involve olivetolic acid, which is formed from palmitic acid via the polyketide pathway (Hanuš et al. Citation2016). C-isoprenylation of olivetolic acid with geranyl diphosphate can form the product cannabigerolic acid (CBGA), which serves as a precursor for all other relevant cannabinoids, as shown in . A variety of cannabinoid acids can be formed from CBGA via diverse formation pathways such as (a) THCA synthase pathway (Taura et al. Citation2007; Hanuš et al. Citation2016), (b) CBDA synthase pathway (Taura et al. Citation2007), and (c) CBCA synthase pathway (Crombie et al. Citation1968; Morimoto et al. Citation1998; Hanuš et al. Citation2016). These pathways are followed by decarboxylation of the cannabinoid acids to form the corresponding neutral forms (). The alkyl residue at the C3 position of the resorcinyl moiety mostly is a five-carbon chain (olivetoids) or, less frequently, a three-carbon chain (viridinoids). Consequently, tetrahydrocannabivarin (THCV) and cannabidivarin (CBDV) are short-tailed propyl homologs of THC and CBD. Other cannabinoids, including cannabinol (CBN), Δ8-tetrahydrocannabinol (Δ8-THC) or cannabicyclol (CBC) and their acids, are considered not to be naturally occurring cannabinoids but rather to be auto-oxidation products (Turner et al. Citation1980; Hanuš et al. Citation2016).
Figure 1. Formation of cannabinoids within Cannabis sativa.
The classification of Cannabis (fibre-type hemp vs drug-type hemp) solely based on Δ9-THC content is widespread, as Δ9-THC is thought mainly to be responsible for the psychoactive effects of these plants. The ratio of total THC (Δ9-THC and Δ9-THCA) to total CBD (CBD and CBDA) is also applied for a classification of Cannabis as it was considered as a more conservative (stable) marker (Fetterman et al. Citation1971; de Meijer et al. Citation1992). In fibre-type hemp CBDA is the dominant cannabinoid while in drug-type hemp mainly THCA is produced (Flores-Sánchez and Verpoorte Citation2008; Andre et al. Citation2016). For classification, the total THC:CBD ratio was set to be above 1 for drug-type hemp (ratio > 1) compared to below 1 for fibre-type hemp (ratio <1). Since CBN can be converted to THC by oxidation (aging) and CBN can also bind, albeit to a lesser extent than THC, to the cannabinoid receptors CB1 and CB2 (Pertwee et al. (Citation2010) and references therein) the previously stated ratio was even extended to the sum of total THC and total CBN, relative to total CBD, (THC + CBN)/CBD (Fetterman et al. Citation1971; Small and Beckstead Citation1973).
When several countries allowed the resumption of hemp cultivation in the 1990s, the THC content criterion was included in the regulations for the cultivation of fibre-type (hemp) plants. In the European Union (EU), varieties of hemp that are cultivated must be listed in the EU’s ‘Common Catalogue of Varieties of Agricultural Plant Species’ and the maximum total Δ9-THC content must not exceed 0.2% w/w (EU-Regulation Citation2013). The use of hemp leaves and hemp flowers as foodstuffs, such as for tea infusions, is legally questionable, as misuse for intoxication purposes cannot be ruled out with the products concerned.
There is inadequate data regarding the possible transfer of cannabinoids from dry material into tea infusions, either in neutral or cannabinoid acid forms. Due to this lack of data, previous expert opinions and studies (BfR Citation2018; Dräger et al. Citation2022) have assumed that 100% of the Δ9-THC from the dry hemp tea is transferred to the tea infusion. However, due to the lipophilic nature of THC and its low water solubility, transfer rates significantly lower than 100% might be expected (BfR Citation2018). However, it is discussed in the literature that other components of the tea matrix may act as solubilizers enabling an elevated transfer rate (Dräger et al. (Citation2022) and references therein). Moreover, studies by Knezevic et al. (Citation2021) and Hazekamp et al. (Citation2007) reported that the Δ9-THC concentration in tea infusions can vary due to water temperature, amount of water, and boiling time during tea infusion preparation. In addition, the study of Δ9-THCA, which has no psychoactive effects, is necessary because this cannabinoid acid can be converted by heat to Δ9-THC. For risk assessment, it is essential to know the transfer rate of the individual cannabinoids, particularly Δ9-THC, into the hemp tea infusion in order to evaluate the potential impact on consumers. This important data on the transfer of cannabinoids, distinguishing between neutral cannabinoids and cannabinoid acids, into hemp tea is not yet available
To provide reliable data for risk assessment, an LC-MS method was applied to investigate the cannabinoid profile of hemp tea in dry material as well as the individual transfer of each cannabinoid into the tea infusion, focusing on Δ9-THC. To investigate the potential influences of thermally induced decarboxylation of cannabinoid acids in hemp tea infusion, the thermostability of the cannabinoid acids was investigated with a focus on Δ9-THCA. For each hemp tea, an infusion was prepared according to a standardized DIN protocol, and the quantified concentrations were related to the content in the dry hemp tea matter to determine the transfer rate for each cannabinoid. Moreover, for the psychoactive Δ9-THC, the amount of tea infusion was calculated that would result in an intake above the acute reference dose (ARfD) of 1 microgram of Δ9-THC per kilogram of body weight.
Materials and methods
Analysis of cannabinoids in dry hemp tea
The hemp tea samples were categorized as hemp flower tea (n = 5) and other hemp tea varieties (n = 18) according to the manufacturer’s specifications. The 23 commercial hemp tea samples, which were ordered from the internet and are listed in the supplemental information (SI) Table S1, were shredded and homogenized using a grinder (Cloer, Germany). To 1 ± 0.02 g of the homogenized hemp tea sample, 10 mL methanol (LiChrosolv® LC/MS Grade, Merck KGaA, Darmstadt, Germany) was added. The sample was extracted for 15 min in an ultrasonic bath (SONOREX, RK 514 H, Bandelin electronic GmbH Co. KG, Berlin, Germany) at room temperature. After centrifugation (10 min, 4000 rpm, room temperature; Heraeus Megafuge 16, Thermo Fisher Scientific, Waltham, Massachusetts, USA) the supernatant was filtered through a filter (Ahlstrom Munksjö, grade 3). To the residue, 10 mL of methanol (LiChrosolv LC/MS Grade, Merck KGaA, Darmstadt, Germany) was added, the extraction steps were repeated and both extracts were combined. Sample extracts were diluted with an acetonitrile/water mixture (50/50, v/v) and 10 µL of the internal standard mix (CBD-D3, CBN-D3, Δ9-THC-D3 and THCA-D3; c = 0.5 µg/mL, equivalent to 5 ng absolute in a vial) was added to obtain a volume in the vial of 1 mL. CBD-D3 and THCA-D3 were purchased from Sigma-Aldrich (St. Louis, Missouri, USA) and CBN-D3 and Δ9-THC-D3 were purchased from Th. Geyer (Berlin, Germany).
The analytical method described includes the following cannabinoids (SI Figure S1): cannabichromene (CBC), cannabichromenic acid (CBCA), cannabidiol (CBD), cannabidiolic acid (CBDA), cannabidivarin (CBDV), cannabidivarinic acid (CBDVA), cannabigerol (CBG), cannabigerolic acid (CBGA), cannabicyclol (CBL), cannabicyclolic acid (CBLA), cannabinol (CBN), cannabinolic acid (CBNA), Δ8-tetrahydrocannabinol (Δ8-THC), Δ9-tetrahydrocannabinol (Δ9-THC), Δ9-tetrahydrocannabinolic acid (Δ9-THCA), tetrahydrocannabivarin (THCV), tetrahydrocannabivarinic acid (THCVA) (purity ≥ 98%; Sigma-Aldrich, St. Louis, Missouri, USA). The Ultra High-Performance Liquid Chromatography System (1290 UHPLC system, Agilent, Santa Clara, California, USA) was coupled with a QTRAP mass spectrometer (6500 QTRAP, Sciex, Framingham, Massachusetts, USA) and used for the analytical measurements. An overview of the substance-specific parameters of the LC-MS/MS method is shown in SI, Table S2. The samples were separated on an ACQUITY UPLC C18 BEH column (Waters, Eschborn, Germany) with dimensions of 1.7 µm (particle size), 2.1 mm (inner diameter) and 150 mm (length) at a constant temperature of 30 °C and detection in positive mode. The eluent consisted of (A) 0.1 vol % formic acid (Sigma-Aldrich, St. Louis, Missouri, USA) in high-purity water (Millipore, Merck KGaA, Darmstadt, Germany) and (B) 0.1 vol % formic acid (Sigma-Aldrich, St. Louis, Missouri, USA) in acetonitrile (LiChrosolv® LC/MS Grade, Merck KGaA, Darmstadt, Germany). The flow rate of the eluent was 0.3 mL min−1. The eluent gradient program was 40% B for 0.5 min, from 40% B to 70% B in 1 min, from 70% B to 100% B in 14 min, from 100% B to 40% B in 0.5 min and 40% B was then kept constant for 4 min. The injection volume was 5 µL. The cannabinoid concentrations were determined via external calibration. Details of the analytical method are given in SI, SI Table S3.
Investigation of possible influences on the cannabinoid concentrations during tea infusion
To investigate the thermostability of cannabinoids, standards dissolved in acetonitrile (LiChrosolv® LC/MS Grade, Merck KGaA, Darmstadt, Germany), were heated at 40 °C, 60 °C, and 80 °C for 1 h in a vial using a heating block (ThermoMixer C, Sartorius AG, Göttingen, Germany). A temperature-untreated sample of the cannabinoid standards served as a reference to compare the measured concentrations and to determine the recovery rate. In addition, cannabinoid acids were heated in a boiling water bath (T = 100 °C) for 25 min to investigate the potential thermally-induced conversion of cannabinoid acids to their corresponding neutral cannabinoids. After cooling to room temperature, the samples were measured by LC-MS/MS as described in Section 2.1.
Analysis of cannabinoids in hemp tea infusion
Aliquots of 2 ± 0.02 g of each commercial hemp tea sample (SI Table S1) were shredded and homogenized using a grinder (Cloer, Germany) and weighed into a tea filter (paper tea filter size 2, Lebensbaum, Diepholz, Germany). The tea filter was placed in a beaker and 150 mL of boiling high-purity water (T ∼ 100 °C) was added. The beaker was covered with a watch glass and the brewing time of each hemp tea sample was 5 min. After removing the tea filter and cooling for 15 min, the aqueous extract was filtered (Ahlstrom Munksjö, grade 3). This brewing process was based on DIN10809 (Citation1988). The aqueous extract was measured both undiluted and diluted with an acetonitrile/water mixture (50/50, v/v) using LC-MS/MS. The determined cannabinoid concentrations were also converted into corresponding cannabinoid contents with reference to the weight of the tea sample (2 g) in the tea filter and the extraction volume (150 mL). These converted cannabinoid contents were used for comparison with the cannabinoid contents in dry hemp tea determined by methanolic extraction to calculate the transfer of individual cannabinoids into the hemp tea infusion.
Results and discussion
Cannabinoid contents and profiles in dry hemp tea
The total contents of individual cannabinoid pairs in dry hemp tea samples (including the dry-weight percentages of the arithmetic means), as well as ratios of neutral forms to carboxylated forms, are listed in . Results for individual tea samples are reported in the supporting information (SI Table S4).
Table 1. Total and individual cannabinoid contents in mg kg-1 (mean, min, max and 95th percentile) in dry hemp tea ordered from highest to lowest.
The mean total cannabinoid content, determined as the sum of Δ9-THC&Δ9-THCA, CBD&CBDA, CBC&CBCA, CBDV&CBDVA, CBG&CBGA, CBL&CBLA, CBN&CBNA and THCV&THCVA, was determined to be 17,713 mg kg−1 in hemp flower teas, compared with 14,190 mg kg−1 in other hemp tea varieties. This corresponds to a cannabinoid percentage by dry weight of 1.8% and 1.4%, respectively (). The relative composition of mean total cannabinoid content in dry hemp tea samples differentiated by hemp flower tea and other hemp teas is shown in . Considering the data for all dry hemp tea samples, the highest content was found for CBD&CBDA, with 1.3% of the dry weight () and 87% of the total cannabinoid content (). In terms of cannabinoid profile, the second highest percentage was found for CBC&CBCA with a content of 7.3% of the total cannabinoid content, followed by CBG&CBGA with 2.3%, Δ9-THC&Δ9-THCA with 1.4% and CBN&CBNA with 0.7% (). The remaining analytes examined, CBDV&CBDVA, CBL&CBLA, and THCV&THCVA, together accounted for approximately 1% of the total cannabinoid content. In this study, no Δ8-THC was detected in any of the hemp tea samples. The LOQ of ca 0.005 mg kg−1 indicates that the maximum content was below 0.0005%, dry weight. To compare the cannabinoid contents determined in this study, the results were compared with data from Hillig and Mahlberg (Citation2004), who examined 78 accessions of C. sativa subsp. sativa (Hemp Biotype and Feral Biotype). These authors reported higher dry-weight percentages for all cannabinoids studied. The variance in cannabinoid contents could be due to various reasons, such as different plant parts, plant species, and cultivars. Hillig and Mahlberg (Citation2004) analysed only certain hemp plant components, such as the visible resinous floral bracts and small subtending leaves, which are known to have higher cannabinoid content. It can be assumed that no such differentiation took place for hemp tea production, which makes the lower content of cannabinoids in dry-weight matter more conceivable. Pacifico et al. (Citation2008) studied the time course of cannabinoid accumulation in leaves of Cannabis accessions by gas chromatography, including one Cannabis type used for fibre production. Pacifico et al. (Citation2008) reported similar amounts as observed in the current study for the three cannabinoids investigated: CBD, Δ9-THC and CBG.
Figure 2. Percentage composition of mean total cannabinoid content in dry hemp tea samples, differentiated between hemp flower tea and other hemp tea varieties.
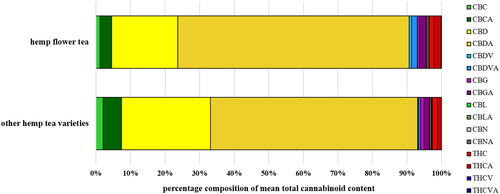
Although higher cannabinoid contents were found in hemp flower tea compared to other hemp varieties, shows that the two types have quite similar cannabinoid profiles, with hemp flower tea having a higher CBD and Δ9-THC content, as well as a higher CBDA and THCA proportion. Besides the question of whether the plant parts were correctly declared for each tea, the slightly higher mean total cannabinoid content in the hemp flower tea is presumably explained by the fact that the cannabinoid content correlates with the number of glandular hairs, which are mainly located in the flower region (Petri et al. Citation1988).
Regarding the classification between drug-type and fibre-type hemp, the high CBD content compared to a low Δ9-THC content resulting in an average ratio of 0.03% confirmed that these samples can be classified as fibre-type hemp. This is additionally supported by the (Δ9-THC + CBN)/CBD ratio (Fetterman et al. Citation1971; Small and Beckstead Citation1973). Here a value < 0.4 was found for this ratio, which also indicates the origin as fibre hemp. The Δ9-THC content determined in the commercial hemp tea samples ranged between 16 mg kg−1 and 935 mg kg−1 with a mean value of 221 mg kg−1 or 0.02% expressed as a dry mass percentage. The Δ9-THC&Δ9-THCA content (sum of Δ9-THC and Δ9-THCA) ranged between 25 and 1805 mg kg−1 with a mean value of 430 mg kg−1 (or 0.04%). The highest Δ9-THC&Δ9-THCA content detected in this study was 0.18% and thus all samples analysed contained Δ9-THC&Δ9-THCA contents below the legal EU-limit of 0.2% for cultivation of hemp (EU-Regulation Citation2013).
3.2 Investigation of thermostability of cannabinoid concentrations during tea infusion
Temperature-induced decarboxylation of cannabinoid acids to the corresponding neutral cannabinoids has been repeatedly described in the literature (Perrotin-Brunel et al. Citation2011; Wang et al. Citation2016; Citti et al. Citation2018; Moreno et al. Citation2020; Gigopulu et al. Citation2022; Seo et al. Citation2022). In this study, we investigated whether a conversion is possible at temperatures that prevail during infusion preparation and thus could influence individual transfer rates. Thermostability was assessed by heating the cannabinoid acid standards at 40 °C, 60 °C, 80 °C for 60 min, and at 100 °C for 25 min and comparing the measured areas at the respective temperature treatments with the areas of the reference standard at 20 °C ().
Figure 3. Cannabinoid acid concentrations [%] in standard solution heated to temperatures of 40 °C, 60 °C, 80 °C and 100 °C related to standard at 20 °C.
![Figure 3. Cannabinoid acid concentrations [%] in standard solution heated to temperatures of 40 °C, 60 °C, 80 °C and 100 °C related to standard at 20 °C.](/cms/asset/ea21a1f4-80c6-45c9-be4a-a3919e6f2cb9/tfac_a_2224455_f0003_c.jpg)
Within a period of at least 25 min and a temperature range between 40 and 100 °C, the cannabinoid acid standards were considered to be stable, as the analyte concentrations did not decrease significantly compared to the 20 °C standard (). The slight decrease of Δ9-THCA and THCVA to 95% at 100 °C was interpreted to be within the measurement uncertainty, but may also reflect minor degradation. Most previous studies on cannabinoid stability tended to examine storage conditions of cannabis products and did not consider short-term heating during tea infusion. In a short-term study, Coffman and Gentner (Citation1974) exposed C. sativa leaves to 65 °C, 85 °C and at 105 °C for 4 h, 16 h and 64 h and determined the content of cannabicyclol (CCC), CBD, Δ9-THC and CBN. Time-temperature treatments above 85 °C for at least 4 h resulted in significant decreases in CCC, CBD and Δ9-THC. However, within the first hour, which is more similar to infusion conditions, levels remained stable even at 105 °C, with the exception of a 10% decrease in Δ9-THC (Coffman and Gentner Citation1974). In addition, several long-term stability tests have been conducted with Cannabis, which showed that cannabinoids, especially Δ9-THCA and Δ9-THC, are not stable during prolonged storage (Turner et al. Citation1973; Lindholst Citation2010; Zamengo et al. Citation2019; Meija et al. Citation2022). At room temperature, the rates of decrease range between 2–5% per month. The qualitative and quantitative changes that occur were described in a study by Meija et al. (Citation2022) among others, and show that the mass fraction of cannabinoid acids decreases while the corresponding neutral cannabinoids increase. A similar study was conducted by Lindholst (Citation2010) on cannabis resin and cannabis extracts. The author showed that decarboxylation is the main reaction by which Δ9-THCA is degraded, but the formation of the neutral form does not quantitatively correspond to the degradation of the acid. All studies reported that an increase in CBN&CBNA was measurable in parallel with the degradation of Δ9-THC/Δ9-THCA, but it was pointed out that there is no direct correlation between CBN formation and Δ9-THC degradation and that other–unknown–reaction products are formed. For the present study, it can be summarized that during the preparation of hemp tea, where maximum temperatures of up to 100 °C occur for short periods, thermal degradation of cannabinoid acids is possible to a small extent, but the potential degradation is negligible for the determination of transfer rates to the infusion. The thermostability of the corresponding neutral cannabinoids was investigated under the same conditions, and the measured concentrations per temperature treatment ranged from 92 to 107% with respect to the 20 °C standard (SI Table S5).
Transfer of cannabinoids into hemp tea infusion
Transfer rates were determined by comparing the concentration in the infusion prepared by a standardized DIN protocol with the level in dry material. More specifically, the transfer rate calculated in this study is the ratio between the content obtained by the two-fold methanolic extraction compared to an aqueous extraction at 100 °C (taking into account the different ratios of sample to extraction volume for each sample preparation). The mean concentrations of cannabinoids in tea infusions of both tea categories and ratios of carboxylic to neutral forms are shown in . The individual cannabinoid concentrations in the tea infusions of the respective samples studied are listed in the SI in Table S6.
Table 2. Total and individual cannabinoid concentration in µg L-1 (mean, min, max and 95th percentile) in hemp tea infusion ordered from highest to lowest.
A mean total cannabinoid concentration determined as the sum of Δ9-THC&Δ9-THCA, CBD&CBDA, CBC&CBCA, CBDV&CBDVA, CBG&CBGA, CBL&CBLA, CBN&CBNA and THCV&THCVA of 44,581 µg L−1 was quantified in hemp flower tea compared to 29,422 µg L−1 in other hemp tea varieties. Comparing these concentrations to the dry material data, the overall extraction efficiency for cannabinoids in tea infusion is approximately 20%. Considering the cannabinoid profile in all infusion samples and expressing the neutral and respective acid forms as a sum, the highest content was found for CBD&CBDA representing 92.4% of the total cannabinoid content followed by CBDV&CBDVA at 3.4%, CBC&CBCA at 2.8%, CBG&CBGA at 0.8%, and Δ9-THC&Δ9-THCA at 0.3%. The remaining analytes studied, such as CBN&CBNA, CBL&CBLA, THCV&THCVA, together account for approximately 0.5% of the total cannabinoid concentration. The percentage composition in hemp infusions differs slightly from that of the dry material, which is due to different transfer rates of individual cannabinoids.
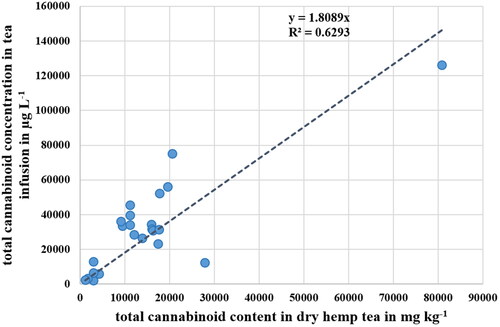
As reported for the dry material, the trend that the hemp flower teas had a higher cannabinoid concentration compared to the other hemp tea varieties was also observed for the cannabinoid content in the dry hemp tea and applied in principle to each sample. As shown in , there is a direct relationship between the total cannabinoid content in the dry hemp tea and the total cannabinoid concentration in the tea, i.e. the higher the total cannabinoid content in the dry hemp tea the higher the concentration in the infusion.
Figure 4. Correlation between the total cannabinoid concentration in hemp tea infusion and the total cannabinoid content in dry hemp tea.
The transfer rates of individual cannabinoids into hemp infusions are shown in and represent the mean value of all 23 hemp tea samples. Conversion of concentrations in infusions to mg kg−1 plant material was done according to the infusion preparation procedure described in the chapter described in Section 2.3.
Figure 5. Transfer rates of individual cannabinoids into hemp tea infusion (error bars denote the spread of individual results within the 23 hemp teas). The arrangement of cannabinoids from left to right was first ordered according to the carbon-to-oxygen ratio, followed by the hydrogen-to-carbon ratio of their respective chemical formulas.
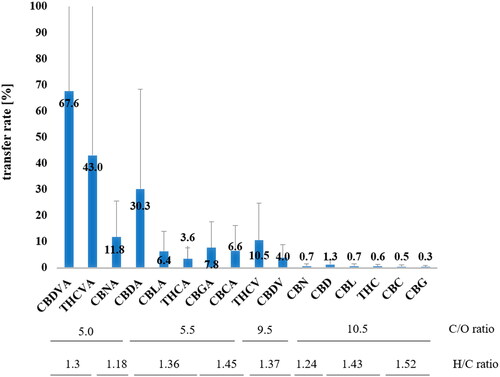
The transfer rates ranged from 68% for CBDVA to 0.3% for CBG. The transfer rate determined here reflects the solubility of a particular cannabinoid in water, which is significantly influenced by its molecular properties. The carbon-to-oxygen ratio and the hydrogen-to-carbon ratio, which are derived from the molecular composition of the individual compounds, are suitable for illustrating the different molecular properties within a group of substances. These ratios correlate with physicochemical properties such as solubility, where substances with comparatively low C/O ratios and low H/C ratios tend to be more hydrophilic and therefore more soluble in water. As shown in , this is also true for cannabinoids.
In summary, it is confirmed that the carboxyl group at the C2 position significantly increases the solubility, so that the carboxylated forms transfer to the tea infusion to a much greater extent. Comparing the transfer rates of the carboxylated forms with the respective neutral cannabinoid, a six-fold higher transfer rate was determined for Δ9-THCA than for Δ9-THC and a 23-fold higher transfer rate for CBDA than for CBD. Consequently, in infusions, the ratio of the acid to the neutral form is much higher than in dry hemp tea ( and ). While for total cannabinoids a mean ratio of 68 is observed in infusions a ratio of 2.5 was determined in the dry material. It should also be noted that, as expected, the propyl homologs such as CBDV or THCV show a higher transfer than their pentyl homologues such as CBD or Δ9-THC (). Differences in transfer were also noticed between constitutional isomers such as THC and CDB and their respective acid form ( and ). The much higher solubility of CBD compared to Δ9-THC can presumably be explained by the free hydroxyl group and the terminal C = C double bond.
Limited data on transfer rates have been published so far. In a study by Lachenmeier et al. (Citation2004), the concentrations of Δ9-THC, CBD and CBN were investigated in dry leaves and in infusions of five different hemp teas. The transfer rates of the neutral cannabinoids into the tea infusion ranged between 0.3 to 2% for Δ9-THC, between 0.7 and 6% for CBD and between 1 and 3% for CBN and are in agreement with this study. Here, transfer rates were observed between 0.1 to 1.4% for Δ9-THC, between 0.3 to 4.2% for CBD and 0.2 to 1.8% for CBN (). The Δ9-THC concentration in tea infusions ranged from 1.2 to 64 µg L−1 and for total Δ9-THC from 4.1 and 320 µg L−1. The Δ9-THCA/Δ9-THC ratio was on average 8 compared to 0.9 in the dry material ( and ). Based on the acute reference dose (ARfD) of 1 microgram Δ9-THC kg−1 body weight derived by the European Food Safety Authority (EFSA Citation2015) and the concentrations determined in hemp tea infusions, we calculated the consumption level for each tea that may lead to an ARfD exceedance. For a 60 kg person, these volumes ranged from 50 L infusion for the lowest and 0.9 L for the highest Δ9-THC level (mean = 14 L). The data from this study suggest that human exposure to Δ9-THC from hemp tea consumption is comparatively low due to the limited aqueous extractability of Δ9-THC and the associated low transfer rate of Δ9-THC into the infusion. Although no conversion of Δ9-THCA to Δ9-THC was observed at 100 °C preparation temperature (Section 3.2.1), we also calculated the consumption rate for total Δ9-THCäqu resulting in an ARfD exceedance. This scenario represents a precautionary assessment and includes the potential conversion of Δ9-THCA to Δ9-THC. This procedure results in a lower liquid uptake ranging between 16 and 0.2 L (mean = 3.0 L).
Conclusions
In this study, the cannabinoid contents and profiles of 23 commercial hemp tea samples were determined, both in the dry hemp tea and its corresponding hemp tea infusion. The total cannabinoid content was determined as the sum of amounts of Δ9-THC&Δ9-THCA, CBD&CBDA, CBC&CBCA, CBDV&CBDVA, CBG&CBGA, CBL&CBLA, CBN&CBNA and THCV&THCVA and was on average 14,960 mg kg−1 in the dry material, representing 1.4% of the dry weight. Regarding the cannabinoid profile, CBD&CBDA were the major cannabinoids, accounting for 87% of the total cannabinoid content, followed by CBC&CBCA with 7.3%, CBG&CBGA with 2.3%, and Δ9-THC& Δ9-THCA with 1.4%. The mean ratios of cannabinoid acid to neutral form differed between cannabinoids and were determined to be 72 for CBDA to CBA, 48 for the CBC forms, 76 for the CBG forms and 8 for Δ9-THCA to Δ9-THC.
The investigation of thermostability showed that during the preparation of tea, where maximum temperatures of 100 °C occur for short periods of time, thermal degradation of cannabinoid acids occurs only to a small extent, if at all. For each hemp tea an infusion was prepared according to a standardized DIN protocol and the determined mean total cannabinoid concentration was 32.7 mg L−1. The transfer rate for each cannabinoid was calculated by comparing the level in dry material obtained by the two-fold methanolic extraction to the concentration in the aqueous infusion. The individual transfer rates correlate with the molecular composition of each cannabinoid and are higher for the acidic form compared to the neutral form. Due to the limited water solubility of cannabinoids, the overall extraction efficiency for cannabinoids using boiling water to prepare a tea infusion is approximately 20%. It was 3.6% for Δ9-THCA and only 0.5% for Δ9-THC. It was calculated at what consumption level of the investigated hemp teas the EFSA-derived ARfD of one microgram Δ9-THC kg−1 body weight would be exceeded. For a 60 kg person, a mean volume of 14 L was calculated that ranged between 50 L for the lowest and 0.9 L for the highest Δ9-THC level. These data suggest that due to the low transfer rate of Δ9-THC into the infusion, human exposure to Δ9-THC from hemp tea is much lower than previously assumed in conservative risk assessment scenarios, where a 100% transfer into the tea was assumed used in a precautionary approach.
Supplemental Material
Download MS Word (125.5 KB)Acknowledgements
The authors thank Anja Gessele, Niklas Lindekamp and Sebastian Kemter for their support.
Disclosure statement
No potential conflict of interest was reported by the author(s).
References
- Andre CM, Hausman J-F, Guerriero G. 2016. Cannabis sativa: the plant of the thousand and one molecules. Front Plant Sci. 7:19 doi: 10.3389/fpls.2016.00019.
- BfR. 2018. Tetrahydrocannabinol levels are too high in many hemp-containing foods—health impairments are possible. BfR Opinion No 034/2018.
- Citti C, Linciano P, Russo F, Luongo L, Iannotta M, Maione S, Laganà A, Capriotti AL, Forni F, Vandelli MA, et al. 2019. A novel phytocannabinoid isolated from Cannabis sativa L. with an in vivo cannabimimetic activity higher than Δ(9)-tetrahydrocannabinol: Δ(9)-Tetrahydrocannabiphorol. Sci Rep. 9(1):20335. doi: 10.1038/s41598-019-56785-1.
- Citti C, Pacchetti B, Vandelli MA, Forni F, Cannazza G. 2018. Analysis of cannabinoids in commercial hemp seed oil and decarboxylation kinetics studies of cannabidiolic acid (CBDA). J Pharm Biomed Anal. 149:532–540. doi: 10.1016/j.jpba.2017.11.044.
- Coffman CB, Gentner WA. 1974. Cannabis sativa L.: Effect of drying time and temperature on cannabinoid profile of stored leaf tissue. Bulletin on Narcotics. 26:67–70.
- Crombie L, Ponsford R, Shani A, Yagnitinsky B, Mechoulam R. 1968. Hashish components. Photochemical production of cannabicyclol from cannabichromene. Tetrahedron Lett. No9 (55):5771–5772. doi: 10.1016/S0040-4039(00)76346-5.
- de Meijer EPM, van der Kamp HJ, van Eeuwijk FA. 1992. Characterisation of Cannabis accessions with regard to cannabinoid content in relation to other plant characters. Euphytica. 62(3):187–200. doi: 10.1007/BF00041753.
- DIN10809 1988. Bereitung eines Aufgusses für sensorische Prüfungen. Deutsches Institut für Normung. Berlin (Germany): Beuth-Verlag.
- Dräger H, Barthlott I, Golombek P, Walch SG, Lachenmeier DW. 2022. Time trends of tetrahydrocannabinol (THC) in a 2008–2021 German National Survey of Hemp Food Products. Foods. 11(3):486. doi: 10.3390/foods11030486.
- EFSA. 2015. Scientific Opinion on the risks for human health related to the presence of tetrahydrocannabinol (THC) in milk and other food of animal origin. Efsa J. 13(6)4141(European Food Safety Authority: scientific Panel on Contaminants in the Food Chain (CONTAM)):125. pp.
- EU-Regulation 2013. 1308/ Regulation (EU) No 1308/2013 of the European Parliament and of the Council of 17 December 2013 establishing a common organisation of the markets in agricultural products and repealing Council Regulations (EEC) No 922/72, (EEC) No 234/79, (EC) No 1037/2001 and (EC) No 1234/2007.L 347/608
- Fetterman PS, Keith ES, Waller CW, Guerrero O, Doorenbos NJ, Quimby MW. 1971. Mississippi-grown Cannabis sativa L: preliminary observation on chemical definition of phenotype and variations in tetrahydrocannabinol content versus age, sex, and plant part. J Pharm Sci. 60(8):1246–1249. doi: 10.1002/jps.2600600832.
- Flores-Sánchez IJ, Verpoorte R. 2008. Secondary metabolism in cannabis. Phytochem Rev. 7(3):615–639. doi: 10.1007/s11101-008-9094-4.
- Gigopulu O, Geskovski N, Stefkov G, Stoilkovska Gjorgievska V, Slaveska Spirevska I, Huck CW, Makreski P. 2022. A unique approach for in-situ monitoring of the THCA decarboxylation reaction in solid state. Spectrochim Acta A Mol Biomol Spectrosc. 267(Pt 2):120471. doi: 10.1016/j.saa.2021.120471.
- Hanuš LO, Meyer SM, Muñoz E, Taglialatela-Scafati O, Appendino G. 2016. Phytocannabinoids: a unified critical inventory. Nat Prod Rep. 33(12):1357–1392. doi: 10.1039/c6np00074f.
- Hazekamp A, Bastola K, Rashidi H, Bender J, Verpoorte R. 2007. Cannabis tea revisited: a systematic evaluation of the cannabinoid composition of cannabis tea. J Ethnopharmacol. 113(1):85–90. doi: 10.1016/j.jep.2007.05.019.
- Hillig KW, Mahlberg PG. 2004. A chemotaxonomic analysis of cannabinoid variation in Cannabis (Cannabaceae). Am J Bot. 91(6):966–975. doi: 10.3732/ajb.91.6.966.
- Knezevic F, Nikolai A, Marchart R, Sosa S, Tubaro A, Novak J. 2021. Residues of herbal hemp leaf teas–How much of the cannabinoids remain? Food Control. 127:108146. doi: 10.1016/j.foodcont.2021.108146.
- Lachenmeier DW, Kroener L, Musshoff F, Madea B. 2004. Determination of cannabinoids in hemp food products by use of headspace solid-phase microextraction and gas chromatography–mass spectrometry. Anal Bioanal Chem. 378(1):183–189. doi: 10.1007/s00216-003-2268-4.
- Lindholst C. 2010. Long term stability of cannabis resin and cannabis extracts. Aust J Forensic Sci. 42(3):181–190. doi: 10.1080/00450610903258144.
- McPartland JM, Small E. 2020. A classification of endangered high-THC cannabis (Cannabis sativa subsp. indica) domesticates and their wild relatives. PhytoKeys. 144:81–112. doi: 10.3897/phytokeys.144.46700.
- Meija J, McRae G, Miles CO, Melanson JE. 2022. Thermal stability of cannabinoids in dried cannabis: a kinetic study. Anal Bioanal Chem. 414(1):377–384. doi: 10.1007/s00216-020-03098-2.
- Moreno T, Dyer P, Tallon S. 2020. Cannabinoid decarboxylation: a comparative kinetic study. Ind Eng Chem Res. 59(46):20307–20315. doi: 10.1021/acs.iecr.0c03791.
- Morimoto S, Komatsu K, Taura F, Shoyama Y. 1998. Purification and characterization of cannabichromenic acid synthase from Cannabis sativa. Phytochemistry. 49(6):1525–1529. doi: 10.1016/s0031-9422(98)00278-7.
- Pacifico D, Miselli F, Carboni A, Moschella A, Mandolino G. 2008. Time course of cannabinoid accumulation and chemotype development during the growth of Cannabis sativa L. Euphytica. 160(2):231–240. doi: 10.1007/s10681-007-9543-y.
- Perrotin-Brunel H, Buijs W, Spronsen J, Roosmalen MJEv, Peters CJ, Verpoorte R, Witkamp G-J. 2011. Decarboxylation of Δ9-tetrahydrocannabinol: kinetics and molecular modeling. J Mol Struct. 987(1-3):67–73. doi: 10.1016/j.molstruc.2010.11.061.
- Pertwee RG, Howlett AC, Abood ME, Alexander SPH, Di Marzo V, Elphick MR, Greasley PJ, Hansen HS, Kunos G, Mackie K, et al. 2010. international union of basic and clinical pharmacology. LXXIX. Cannabinoid receptors and their ligands: beyond CB1 and CB2. Pharmacol Rev. 62(4):588–631. doi: 10.1124/pr.110.003004.
- Petri G, Oroszlán P, Fridvalszky L. 1988. Histochemical detection of hemp trichomes and their correlation with the THC content. Acta Biol Hung. 39(1):59–73.
- Piluzza G, Delogu G, Cabras A, Marceddu S, Bullitta S. 2013. Differentiation between fibre and drug types of hemp (Cannabis sativa L.) from a collection of wild and domesticated accessions. Genet Resour Crop Evol. 60(8):2331–2342. doi: 10.1007/s10722-013-0001-5.
- Sawler J, Stout JM, Gardner KM, Hudson D, Vidmar J, Butler L, Page JE, Myles S. 2015. The genetic structure of marijuana and hemp. PLoS One. 10(8):e0133292. doi: 10.1371/journal.pone.0133292.
- Seo C, Jeong M, Lee S, Kim EJ, Rho S, Cho M, Lee YS, Hong J. 2022. Thermal decarboxylation of acidic cannabinoids in Cannabis species: identification of transformed cannabinoids by UHPLC-Q/TOF–MS. J Anal Sci Technol. 13(1):42. doi: 10.1186/s40543-022-00351-4.
- Small E, Beckstead HD. 1973. Cannabinoid phenotypes in Cannabis sativa. Nature. 245(5421):147–148. doi: 10.1038/245147a0.
- Small E, Cronquist A. 1976. A practical and natural taxonomy for cannabis. TAXON. 25(4):405–435. doi: 10.2307/1220524.
- Taura F, Sirikantaramas S, Shoyama Y, Yoshikai K, Shoyama Y, Morimoto S. 2007. Cannabidiolic-acid synthase, the chemotype-determining enzyme in the fibre-type Cannabis sativa. FEBS Lett. 581(16):2929–2934. doi: 10.1016/j.febslet.2007.05.043.
- Turner CE, Elsohly MA, Boeren EG. 1980. Constituents of Cannabis sativa L. XVII. A review of the natural constituents. J Nat Prod. 43(2):169–234. doi: 10.1021/np50008a001.
- Turner CE, Hadley KW, Fetterman PS, Doorenbos NJ, Quimby MW, Waller C. 1973. Constituents of Cannabis sativa L. IV: stability of cannabinoids in stored plant material. J Pharm Sci. 62(10):1601–1605. doi: 10.1002/jps.2600621005.
- Wang M, Wang Y-H, Avula B, Radwan MM, Wanas AS, van Antwerp J, Parcher JF, ElSohly MA, Khan IA. 2016. Decarboxylation study of acidic cannabinoids: a novel approach using ultra-high-performance supercritical fluid chromatography/photodiode array-mass spectrometry. Cannabis Cannabinoid Res. 1(1):262–271. doi: 10.1089/can.2016.0020.
- Zamengo L, Bettin C, Badocco D, Di Marco V, Miolo G, Frison G. 2019. The role of time and storage conditions on the composition of hashish and marijuana samples: a four-year study. Forensic Sci Int. 298:131–137. doi: 10.1016/j.forsciint.2019.02.058.