
 ?Mathematical formulae have been encoded as MathML and are displayed in this HTML version using MathJax in order to improve their display. Uncheck the box to turn MathJax off. This feature requires Javascript. Click on a formula to zoom.
Abstract
To enable the monitoring of a wide scope of per- and polyfluoroalkyl substances (PFAS) in the ng/kg level in foodstuffs, an LC-MS/MS method comprising 57 analytes was developed and validated in seven different matrices (milk powder, milk-based infant formula, meat-based baby food puree, fish and fish oil, fresh egg, and soluble coffee). The analytical approach was based on an acetonitrile:water extraction followed by solid phase extraction clean-up with subsequent quantification of the extracted analytes either by isotope dilution (55 compounds) or by standard addition (2 compounds) mass spectrometry. The validation criteria followed the guidance document for the analysis of PFAS issued by the European Union Reference Laboratory for Halogenated Persistent Organic Pollutants. The lowest limits of quantification (LOQs) for the four recently regulated compounds (L-PFOS, PFOA, PFNA, L-PFHxS) were set at 0.010 µg/kg in baby and infant foods (as sold) but also in dairy ingredients. Exception was for PFOA in milk powder due to too large variability in the repeatability. Applicability of the method was further demonstrated in 37 commodity check matrices. Overall validation data demonstrated the robustness of the method for most of the compounds and the LOQs achieved were low enough to ensure compliance with Commission Regulation EU 2022/2388 but also to support future collection of occurrence data in ng/kg level in food.
Introduction
Per- and polyfluoroalkyl substances (PFAS) comprise a large group of man-made chemicals used in various applications (Buck et al. Citation2011). According to the Organization for Economic Co-operation and Development (OECD), PFAS are defined as compounds having a fully fluorinated methyl or methylene carbon moiety (OECD Citation2021). The diversity of molecular structures and physicochemical properties explain their usage in numerous applications, e.g. as firefighting aqueous film-forming foams (AFFFs), in non-stick cookware, as stain repellents, as well as in food packaging and textiles (Moody and Field Citation1999, Citation2000; Buck et al. Citation2011; Wang et al. Citation2015; Shoeib et al. Citation2016; Schaider et al. Citation2017; Boronow et al. Citation2019; Sunderland et al. Citation2019). Since the carbon – fluorine bond is extremely strong, degradation in the environment is impaired leading to accumulation in several environmental compartments (Wang et al. Citation2015). Thus, PFAS enter the food chain via water and soil also via plants, fish, vegetables, eggs, and feed contaminating milk and meat (UNEP Citation2019; EFSA Citation2020; Göckener et al. Citation2020). Other possible sources of food contamination comprise migration from food packaging materials or processing equipment (EFSA Citation2020). Since the 2000’s, PFAS gained a lot of attention and more specifically perfluorooctane sulfonic acid (PFOS) and perfluorooctanoic acid (PFOA), which are considered persistent organic pollutants (POPs) and listed in the Stockholm Convention on POPs (UNEP Citation2019). Despite the huge number of PFAS – around 14000 compounds cited by the US Environmental Protection Agency (USEPA Citation2021) with a potential interest based on environmental occurrence and manufacturing process data – the European Food Safety Authority (EFSA) set in 2020 a tolerable weekly intake (TWI) limit at 4.4 ng/kg body weight only for four PFAS (PFOS, PFOA, PFNA – perfluorononanoic acid and PFHxS – perfluorohexane sulfonic acid). EFSA also enumerated several food items that were ranked as major contributors to human dietary exposure, namely fish, meat, eggs, fruits and vegetables (EFSA Citation2020). The current industry practice is to discontinue the regulated compounds and replace them with structurally similar substances which currently are not monitored or present in regulated lists.
In August 2022, the European Union (EU) released the Recommendation EU 2022/1431 setting limits of quantification (LOQs) for PFOS, PFOA, PFNA, PFHxS in several food matrices, including fruits and vegetables, fish and meat, eggs, fish oil, milk and food for infants and young children as ready to eat (EU Citation2022a). The lowest targeted LOQs recommended for fruits, vegetables, foods for infants and young children ranged from 0.001 µg/kg to 0.004 µg/kg depending on the compound. In the Recommendation, the scope of analytes without required LOQs included thirty-two additional compounds. In December 2022, the Commission Regulation EU 2022/2388 established maximum levels (MLs) for PFOS, PFOA, PFNA, PFHxS, in eggs, fish and meat foodstuffs, with the lowest ML for PFOA and PFHxS set at 0.3 µg/kg in eggs and for PFOA, PFNA and PFHxS set at 0.2 µg/kg in fish meat and meat (beef, pork, poultry and sheep) intended for the production of food for infants and young children (EU Citation2022b). The maximum level applies to the sum of linear and branched stereoisomers, whether they are chromatographically separated or not.
In this context, the objective of our study was to develop and validate a method for the simultaneous determination of 57 PFAS in seven different matrices, namely baby food puree (beef), milk-based infant formula (as sold), full cream milk powder, fish, whole egg, soluble coffee and fish oil by LC-MS/MS. The analyte scope not only comprised compounds included in the Recommendation 2022/1431 (EU Citation2022a), but also those listed in the U.S. Food and Drug Administration method for PFAS analysis in processed food (US FDA Citation2021), as well as compounds already surveyed by several service laboratories in Europe or previously mentioned in the literature.
The LOQs were established by spiking PFAS-free food items at levels still showing reliable identification and quantification as per the EURL POPs guidance document (EURL Citation2022) criteria. Applicability of the method was further verified in twenty-seven commodity check matrices with different moisture content: six baby food purees and baby cereals (as sold), two milk-based products (whey protein and skim milk powder), four fish/meat matrices, four egg items (egg yolk powder, white egg powder, whole egg powder and processed liquid egg yolk), two roasted and ground coffee samples and finally nine fish oil, vegetable oil and fat matrices. The quantification of linear PFOS (L-PFOS), PFOA, PFNA, linear PFHxS (L-PFHxS) was carried out by the isotope dilution approach, which was also applied to the majority of the compounds in the scope. Only capstone A and capstone B were quantified by standard addition.
Materials and methods
Chemicals and reagents
The detailed list of PFAS comprising 57 targeted native analytes and 33 isotopically labelled internal standards is available in Tables S1 to S3 (Supplementary Material 1) along with suppliers’ information. Ammonium hydroxide solution (NH4OH 25%), ammonium acetate solution (BioUltra, 5 M in water), sodium phosphate monobasic dihydrate (99%), sodium phosphate dibasic (99%) and formic acid (98%) were obtained from Merck Group AG (Switzerland). The reagent N-methylpiperidine (99%) was supplied by Fisher Scientific AG (Switzerland). ULC-MS grade solvents from Biosolve which are methanol (MeOH), acetonitrile (ACN), water (H2O) and isopropanol, were purchased from Chemie Brunschwig AG (Switzerland). Solid phase extraction (SPE) Strata® PFAS WAX/GCB cartridges (6 mL, 200 mg/50 mg, weak anion exchange/graphitised carbon black) were obtained from Phenomenex® (Switzerland).
Table 1. Characteristic ions and identification criteria applied to PFOA, L-PFOS, PFNA, L-PFHxS and the respective internal standards (IS) across the validation range of the LC-MS/MS method in food.
Table 3. Summary of compounds with satisfactory and unsatisfactory data obtained during the full validation and the commodity check.
Standard solutions preparation
Individual stock standard solutions of both native and labelled analytes were procured as ready-to-use solutions except for four native analytes (perfluoro(3,7-bis(trifluoromethyl)) octanoic acid; 2H, 2H, 3H, 3H-perfluoroundecanoic acid; capstone product A (1-propanaminium, N,N-dimethyl-N-oxide-3-[[(3,3,4,4,5,5,6,6,7,7,8,8,8-tridecafluorooctyl)sulfonyl]amino]-, hydroxide.); capstone product B (1-propanaminium, N,N-dimethyl-N-oxide-3-[[(3,3,4,4,5,5,6,6,7,7,8,8,8-tridecafluorooctyl)sulfonyl]amino]-, hydroxide)) which were prepared at a 1000 µg/mL concentration in MeOH by weighing at least 10 mg of each individual powder taking into account purity, salt and water contents (available from the certificate of analysis). A complete solubility of the analytes in solution was ensured by vortexing and sonicating them for at least 5 min. The detailed concentration of each ready-to-use solution, CAS number and related supplier information are given in (Supplementary Material 1).
Intermediate stock standard solutions at a 50 µg/mL concentration were prepared from the 1000 µg/mL individual stock solutions, thus with a 20 times dilution in MeOH.
Three composite stock standard solutions were deemed necessary: MIX Methanol 1 and MIX Methanol 2 were prepared in MeOH, and MIX Isopropanol was prepared in isopropanol by diluting the individual stock standard solutions and the intermediate stock standard solutions in the related solvents. Two composite stock labelled internal standard solutions were prepared, firstly the MIX IS Methanol, which was prepared in MeOH and secondly, the MIX IS Isopropanol prepared in isopropanol. Detailed information about the analytes included in each mix are given in Table S4 (Supplementary Material 1).
Three composite working standard solutions and two composite working internal standard solutions were prepared by successive dilutions in MeOH (Table S5, Supplementary Material 1).
Composite working standard solutions for standard addition containing capstone A and capstone B were obtained at 10 ng/mL, 0.8 ng/mL, 0.4 ng/mL and 0.2 ng/mL by successive dilutions in MeOH.
All individual stock and composite stock standard solutions were stored at -20 °C. Solutions attained room temperature and were sonicated for 10 min before use. All composite working standard solutions were freshly prepared the day of use.
Samples
The samples were divided into two groups: Group A comprised food items intended for or used in infant nutrition whose analysis required a concentration step prior to LC-MS/MS analysis to reach as low as possible LOQs, and Group B consisted of food matrices, mainly those listed in Commission Regulation EU 2022/2388, for which such a concentration step was not needed to attain ML set in this regulation ().
Figure 1. Flowchart of the extraction/clean-up procedure for the analysis of PFAS in food by LC-MS/MS (Group A: infant cereals, baby food, milk and milk-based products; Group B: meat, fish, egg, coffee, fish oil, vegetable oil and fat).
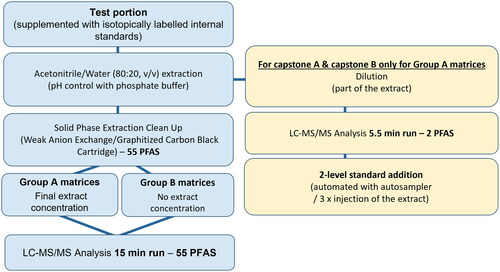
Matrix Group A
baby food purees (n = 7; baby food beef, baby food vegetable, baby food fruit and infant cereals) and milk-based products in powdered form (n = 4, infant formula, full cream milk, skim milk and whey protein).
Matrix Group B
fish and meat products (n = 5; yellow pollack fish, tuna fish, veal meat powder, chicken meat powder and anchovy powder), eggs (n = 5; whole egg, egg yolk powder, white egg powder, whole egg powder, egg yolk liquid), coffee (n = 3; soluble coffee, 2 samples of roast and ground coffee) and fish/vegetable oil and fats (n = 10; fish oil, tuna oil, palm oil, chicken fat, duck fat, poultry oil, vegetable fat mix containing coconut/rapeseed/oleic sunflower fat, vegetable oil mix containing coconut/soybean/sunflower oil and vegetable oil mix containing coconut/palm olein/rapeseed/sunflower oil).
A quality control material (fish sample, T06107QC, FAPAS) was also considered during validation to evaluate trueness of the method. Commercial end products were purchased from local supermarkets in Switzerland, whilst food ingredients were collected from internal facilities. The sampling was conducted during the year 2022.
Sample preparation
The overall principle of the method is given in . Before sub-sampling for analysis, powdered samples (infant formulae, milk-based ingredients, cereals, fish/meat products, coffee and eggs) and liquid oil were directly homogenised by mixing into their original container. Baby foods in jar, fresh fish and whole egg were minced using a domestic blender taking precautions to avoid cross contaminations by rinsing all materials with grade ULC-MS methanol before use. Finally, fats and oils which are solid at room temperature were melted at 50 °C in a water bath and then mixed directly into their original container.
Homogenised food (2.00 ± 0.05 g for Group A matrices or 1.00 ± 0.02 g for Group B matrices) was added into a 50-mL polypropylene centrifuge tube and spiked with a mixture of isotopically labelled standards (labelled composite working standard solutions, at concentrations 1 & 2, Table S5, Supplementary Material 1), then thoroughly mixed to ensure that the spiked volume was totally absorbed by the matrix.
Five mL of an ACN:H2O 80:20 (v/v) mixture were added to the sample, as well as one ceramic homogeniser (Agilent Technologies AG, Switzerland) and the sample was shaken at 1500 rpm for 3 min using a Geno/Grinder® homogeniser (SPEX® SamplePrep, NJ, USA). A centrifugation step was then applied for 10 min at 4000 g at room temperature (Multifuge Heraeus X1, Thermo Fisher Scientific, Switzerland) and the resulting whole supernatant was transferred into another 50-mL polypropylene centrifuge tube.
Analysis of capstone A and capstone B – Group A matrices
An aliquot (50 µL) of the latter supernatant was transferred into a 2-mL polypropylene microcentrifuge tube containing 450 µL of MeOH, well mixed, then centrifuged at 13000 g for 10 min at room temperature (Eppendorf 5424 microcentrifuge, Fisher Scientific AG, Switzerland). The supernatant was eventually transferred into a polypropylene injection vial for LC-MS/MS analysis.
Analysis of 55 PFAS – Group A and B matrices
Five mL of H2O were added and mixed into the remaining supernatant. The pH was adjusted to 7 with 1 mL of 1 M phosphate buffer pH 7. An SPE extraction was followed, making use of SPE Strata® PFAS WAX/GCB cartridges which were beforehand conditioned with 5 mL of MeOH containing 0.3% NH4OH, followed by 5 mL of MeOH, 1 mL of H2O and 5 mL of 1 M phosphate buffer pH 7. The whole sample was loaded into the cartridge and passed through at a rate of ca. 1 drop/s. After elution, the cartridge was further washed with 5 mL of formic acid 0.1% in H2O: MeOH (50:50, v/v), then dried for 2 min under vacuum and the PFAS were eluted by adding 4 mL of the elution solvent (0.3% NH4OH in MeOH) twice. PFAS were collected in 15-mL polypropylene tubes. At the end of elution, the cartridge was dried again by applying vacuum.
For Group A matrices, the resulting eluate was evaporated to dryness under a stream of nitrogen at 40 °C (Reacti-Therm triple block, ThermoFisher Scientific AG, Switzerland), then the residue was reconstituted in 1 mL of MeOH and sonicated for 10 min in an ultrasonic bath (Branson 3210, ThermoFisher Scientific AG, Switzerland). Finally, the sample was further transferred into a 2-mL polypropylene microcentrifuge tube, prior to centrifugation at 13000 g for 10 min at room temperature. The supernatant was finally transferred into a polypropylene injection vial for LC-MS/MS analysis.
For Group B matrices, 1 mL of the resulting eluate was further transferred into a 2-mL polypropylene microcentrifuge tube, then centrifuged at 13000 g for 10 min at room temperature prior to transfer into a polypropylene injection vial for LC-MS/MS analysis.
LC-MS/MS analysis
The instrumental analysis was conducted by using an ultrahigh performance liquid chromatograph Exion LC AD (AB Sciex LLC, USA) coupled with a Sciex 7500 triple stage mass spectrometer (AB Sciex LLC, USA). A delay column (XBridge BEH C18, 2.1 x 50 mm, 3.5 µm, Waters, Milford, USA) was used to delay the retention of any background PFAS contamination coming from the mobile phase, frits etc. This delay column was installed between the pump and the injector, outside the column oven. The chromatographic separation was achieved with an Acquity UPLC BEH C18 column (2.1 x 100 mm, 1.7 µm, Waters) fitted with an Acquity UPLC BEH C18 guard column (2.1 x 5 mm, 1.7 µm, Waters). The mobile phase A was 2 mM ammonium acetate solution buffered with ammonium hydroxide (pH adjusted at 10.4). The mobile phase B was 5 mM 1-methylpiperidine in 50:50 v/v MeOH:ACN. For the analysis of 55 PFAS (thus not comprising capstone A and capstone B), the gradient started with 1% mobile phase B and held for 3.4 min, then at 3.5 min the % of B increased to 55, and then to 90% at 9 min, followed by an increase to 100% at 9.5 min and held until 11.5 min. Finally, at 11.6 min the % of B decreased to 1 and held for 3.4 min (total runtime 15 min).
For the analysis of capstone A and capstone B in Group A matrices, the same chromatographic column and same mobile phases were used but with a shorter gradient, which started with 1% mobile phase B and held for 0.5 min and then the B % increased to 70% and held until 3.2 min. Finally, the % of B dropped to 1% at 4.2 min and held until 5.5 min (total runtime 5.5 min).
The column temperature was set at 50 °C and the flow rate at 0.4 mL/min. The flow was directed into the MS detector between 1.2 min and 15.0 min (1.2 min to 5.5 min for capstone A and capstone B gradient) using a diverter valve. The Sciex Triple QuadTM 7500 mass spectrometer was fitted with an electrospray OptiFlow® Pro Ion source and used for MS/MS detection. MS parameters were obtained in negative electrospray ionisation mode by separately infusing each individual standard solution at 1 µg/mL (syringe flow rate of 10 µL/min) along with the LC flow at 0.4 mL/min using a T connector. The LC flow was constituted of 50% aqueous mobile phase A and 50% of organic mobile phase B. The block source temperature was maintained at 350 °C and the gas values were set as follows: curtain gas 40 psi, GS1 gas 40 psi, GS2 gas 70 psi and collision-activated dissociation (CAD) gas pressure set at 12 psi. Other parameters were ion spray voltage (-1.75 kV), pause between mass range (2 ms), entrance potential (–10 V). Collision exit potential, collision energies and Q0 dissociation potential (V) are given in Table S6 and Table S7 (Supplementary Material 1). Multiple reaction monitoring (MRM) was used including 57 native analytes and 33 isotopically labelled compounds. The MRM transition reactions used for unlabelled and labelled compounds are listed in Supplementary Material 1 (Tables S6 and S7). displays the characteristic ions used and identification criteria applied for the quantification of the EU 2022/2388 regulated PFOA, L-PFOS, PFNA and L-PFHxS as well as for their ISs. Data acquisition and subsequent data processing were carried out using Sciex OS 1.2 software.
Identification criteria
Analytes were considered as positively identified when the following criteria were met simultaneously (EURL Citation2022): (1) a signal was visible of at least two diagnostic transition reactions selected for each compound; (2) the retention time of each analyte and its IS in the sample extract should correspond to the average of the calibration solutions measured in the same sequence with a tolerance of 1%; (3) the peak area ratio from the different transition reactions recorded for each analyte in the sample extract should correspond to that of the average of the calibration solutions measured in the same sequence with a tolerance of ± 30%. All identification criteria were systematically applied at the LOQ and at the 5-fold LOQ concentration levels.
Quantification
The 55 PFAS (excluding capstone A and capstone B) were quantified by isotope dilution using eight calibration levels in MeOH. The concentration range (in ng/mL) in solvent for each analyte and the related equivalent concentration in the sample (in µg/kg) are given in Table S8 (Supplementary Material 1).
A graph “analyte/IS area ratio” on the y axis versus “analyte/IS concentration ratio” on the x axis was plotted for each analyte. A 1/x2 weighing factor was used to improve precision at the lowest calibration points. Linearity of responses was ensured by checking that the regression coefficient R2 was higher than 0.98 and that the deviation of the back-calculated concentration of each calibrant from the true concentration was not more than ± 20% (EURL Citation2022).
Low levels of PFAS might be present in the blank reagent (test sample that has undergone the same treatment as the samples but without any food matrix added) due to various sources of contamination (e.g. internal standard, solvents, SPE cartridges, etc.). Such contribution was taken into consideration for precise calculation. Final equation to express concentration in µg/kg in the sample was thus as follows:
where Aa is the peak area of a given analyte (transition reaction used for quantification), AIS is the peak area of the corresponding IS (transition reaction used for quantification), Aa reagent blank is the peak area of a given analyte in the reagent blank (transition reaction used for quantification), AIS reagent blank is the peak area of the corresponding IS in the reagent blank (transition reaction used for quantification), I is the intercept of the regression line, S is the slope of the regression line, mIS is the mass of IS added to the test portion in ng and ma is the mass of the test portion in g.
As no labelled internal standards were commercially available for capstone A and capstone B, their quantification was performed by the two-level standard addition approach (i.e. food item analyzed as such, but also fortified at two different concentration levels, 5 µg/kg and 10 µg/kg).
Method validation
Validation was performed on one representative sample of each of the following commodity groups: baby food (baby food puree – beef), fish/meat products (yellow pollack fish), eggs (whole egg), coffee (soluble coffee) and fish oil/vegetable oil and fats (fish oil) and on two representative samples from the milk-based group (infant formula and full cream milk, both in powdered form) with performance evaluated in terms of selectivity, linearity, LOQ and accuracy. The selectivity of the method was assessed using PFAS-free samples and checking for the absence of any interfering peak at the retention time of each target analyte. Additionally, blank reagents were systematically analysed in order to determine any interference of the reagents at the retention time of each target analyte. Accuracy data were obtained by spiking each sample at two different levels for each individual analyte before the extraction procedure. The spiking levels for each analyte are given in Table S9 (Supplementary Material 1). Three operators were involved in these experiments, each performing duplicate analyses at the mentioned spiking levels over two different days, six data sets were collected (leading to a total of 12 separate experiments for each spiking level). Unfortified samples were analyzed as well to verify absence of the analytes before spiking trials. Trueness, repeatability (CV(r)) and intermediate reproducibility (CV(iR)) precision data were calculated according to the ISO 5725 document (ISO Citation1994).
The LOQ was defined as the lowest spiking level with acceptable criteria for trueness and CV(r) and CV(iR) values according to EURL POPs guidance document (EURL Citation2022). A fit-for-purpose criterion for linearity by isotopic calibration was set at R2 > 0.98 for the 55 PFAS and at R2 > 0.97 for linearity by the two-level standard addition approach for capstone A and capstone B.
The performance of the method was further demonstrated by analysing 27 matrices (Table S10, Supplementary Material 1). For this, each sample was spiked before the sample extraction at the LOQ for each analyte and analysed in duplicate. Unspiked samples were also analysed to check for any potential contamination. The trueness of each replicate as well as the repeatability, CV(r) were evaluated. Acceptance trueness criteria were between 60 – 140% for both replicates (EU Citation2019). For precision, the acceptance criteria was repeatability, estimated as relative absolute difference of the two replicates, that should be lower than the relative repeatability limit (precision limit) defined as for duplicate analysis at 95% probability level (ISO Citation1994) and considering a CV(r) of 20% (EU Citation2017).
Results
Background contamination
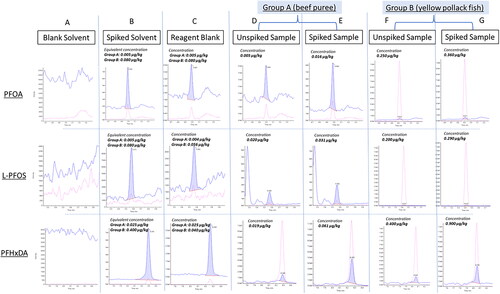
Several sources of PFAS in the laboratory can contribute to positive findings when analysing samples at low level concentrations, e.g. caps, solvents, SPE cartridges, tubing components or from fluorinated components present in the lab environment. To reduce this background contamination as much as possible, the use of polypropylene materials was favored for both sample preparation (volumetric cylinders, beakers, tubes etc.) and analysis (vials and caps). Additionally, ULC-MS grade solvents were systematically used during the whole process due to their high purity. All polytetrafluoroethylene (PTFE) liners of the SPE apparatus were replaced by stainless steel liners. For the LC mobile phases, polypropylene caps were installed on the top of the bottles and stainless-steel frit spargers were used. Moreover, polypropylene tubing components had replaced the already existing PTFE tubing for the mobile phases as well. Prior to LC-MS/MS injection, final extract solutions were centrifuged (at 13000 g) instead of being filtered to avoid any potential contamination originating from the filters or any adsorption on filter material (Lath et al. Citation2019; Berendsen et al. Citation2020). Additionally, a delay column was installed between the pump and the injector outside the column oven to delay the retention of any PFAS coming from the mobile phase or frits. Background contaminations were daily monitored via blank reagent analysis. Despite all these precautions, three compounds, PFOA, L-PFOS and PFHxDA, were always present in blank reagent extracts with a variability of 20% for each substance. For PFOA, a residual amount of 0.010 ng/mL was detected, which corresponds to an equivalent concentration at 0.005 µg/kg for the Group A matrices and 0.080 µg/kg for the Group B matrices. For L-PFOS an amount of 0.007 ng/mL was present, corresponding to 0.004 µg/kg and 0.056 µg/kg equivalent concentrations for Group A and B matrices, respectively. For PFHxDA, the level was of 0.050 ng/mL, equivalent concentrations at 0.025 µg/kg and 0.400 µg/kg for Groups A and B matrices, respectively. The typical chromatograms showing such cross contamination for these three compounds in representative items belonging to Group matrices A and B are presented in . According to the Recommendation EU 2022/1431 (EU Citation2022a), the requested target LOQ in food for infants for PFOA is at 0.001 µg/kg and for PFOS at 0.002 µg/kg, in fish and meat samples for both PFOA and PFOS at 0.100 µg/kg, in egg samples for both PFOA and PFOS at 0.300 µg/kg and in fish oil at 0.500 µg/kg for both compounds. Considering this, the requested target LOQs for PFOA and L-PFOS in food for infants could not be achieved due to the 5- and 2-times higher background contamination in the reagent blank for PFOA and L-PFOS respectively. According to the EURL POPs guidance document (EURL Citation2022), the contribution of the reagent blank concentration should be ≤30% of the levels in the sample analysed within the same batch of analysis. In the case of PFOA, the contribution of the reagent blank concentration to the spiked LOQ level in beef puree was at 31%, slightly exceeding the 30% limit. For PFHxDA the contribution was at 41% for the same matrix and level. Subtracting blank reagent concentrations from the fortified sample ones was essential for reliable data reporting, and consequently the LOQ level for PFHxDA had to be increased from 0.050 to 0.070 µg/kg.
Figure 2. Typical chromatograms of PFOA, L-PFOS and PFHxDA comparing contamination peaks in reagent blank versus signals of either unspiked or spiked samples for both Group A and B matrix representatives (Spiking levels: PFOA and L-PFOS at 0.010 µg/kg in Group A and 0.100 µg/kg in Group B; PFHxDA at 0.050 µg/kg in Group A and 0.500 µg/kg in Group B). Column A refers to blank solvents, column B refers to standard in solvent for Group A and Group B matrices, column C refers to reagent blanks for Group A and Group B matrices, columns D and F refer to unspiked matrices and columns E and G to spiked matrices. Red line corresponds to transition reactions used for analyte confirmation.
Similar findings were obtained by Zhou et al. (Zhou et al. Citation2019) with background contamination for PFPeA, PFOA, L-PFOS and PFNA equal or less than 0.035 µg/kg (equivalent in sample concentration for the vegetables tested) for the single substances with a recurrent background contamination of PFOA. In the study of Rawn et al. (Rawn et al. Citation2022), the instrumental LOQs for PFOA were increased from 0.303 to 1.500 µg/kg and from 0.097 to 0.654 µg/kg for L-PFOS because of related background contamination. The analysis of some other compounds, namely PFBA, PFPeA, PFHxA, L-PFHxS, PFDA, PFUdA, PFODA, PAPs and diPAPs, was also impacted by recurrent background contaminations, evidencing the challenge to reliably quantify PFAS at low levels. Since fluoropolymers are largely present in the environment, from both parts of analytical instruments and laboratory consumables, the analysis of several reagent blanks is essential for setting proper LOQs in food matrices.
Method optimisation
The targeted PFAS have different acid dissociation constants (pKa), requiring a good control of the pH in the mobile phase to ensure a stable retention time of each compound and achieve adequate chromatographic separation. The UHPLC gradient selected enabled the separation of the 57 PFAS using a C18 column. Due to the inclusion of some PFAS with di-anionic character (8:2 PAP, 8:2 diPAP and capstones) in the analyte scope, a high pH in the mobile phase was indeed required to increase their ionic intensity and allow both the single-charged and double-charged analytes to be eluted at the same time (Liu et al. Citation2020). The pH of the aqueous mobile phase was thus set at 10.4, which resulted in an adequate peak resolution and signal response. A mixture of MeOH and ACN (1:1, v/v) was chosen as the organic mobile phase as done previously (Yu et al. Citation2017) but with the addition of 1-methylpiperidine for improving peak shape and ionic intensity (Ullah et al. Citation2011).
Extraction was performed using a solid-liquid extraction comprising a mixture of ACN and water followed by a weak anion exchange/graphitised carbon black SPE cleanup as already cited in several studies (Haug et al. Citation2010). However, for the analysis of capstone A and capstone B in Group A matrices, a dilute-and-shoot approach had to be considered as these zwitterion compounds were not efficiently retained on the SPE cartridge.
For reliable quantification by mass spectrometry, the use of labelled isotopomers as internal standards is recognised as the golden way to compensate for both loss of the compounds during sample extraction and matrix effects generated during ionisation. For the compounds without a commercially available labelled isotopomer, quantification was performed using the best resembling structure internal standard. The attribution list of the labelled compounds to unlabelled species is given in Table S11 (Supplementary Material 1).
Method performance
Validation on seven food matrices
The performance obtained at two fortification levels (LOQ and 5xLOQ) on the seven food matrices that consisted of fish oil, whole egg, fish (yellow pollack), full cream milk powder, powdered infant formula, baby food (meat-based puree) and soluble coffee are discussed hereafter. For PFOA, L-PFOS, PFNA and L-PFHxS, the LOQ was set at 0.01 µg/kg in full cream milk powder, powdered infant formula and baby food, while at 0.1 and 0.3 µg/kg in fish and soluble coffee, respectively. For the other analytes, LOQs were ranging from 0.05 to 5 µg/kg depending on the compound and the matrix. Details of LOQs and performance are available in Supplementary Material 2. It should be emphasised that performance obtained for PFBA, PFPeA, HPFHpA, PF4OPeA, PF5OHxA, N-EtFOSE-M and N-MeFOSE-M are only indicative as these compounds exhibit a single MS transition reaction only, thus they cannot be confirmed according to the EURL POPs guidelines (EURL Citation2022).
The performance obtained for PFOA, L-PFOS, PFNA and L-PFHxS, shown in , indicates the suitability of the method when the criterion of CV(iR) ≤25% is applied. With a criterion was defined at CV(iR) ≤20%, performance passed at 5xLOQ whatever the matrix, while two matrices did not at the LOQ level due to slightly lower performance obtained in fish (L-PFOS) and full cream milk powder (PFOA, L-PFOS and PFNA). A quality control material (fish sample, FAPAS T06107QC) with assigned values for PFOA, PFOS, PFNA and PFHxS (concentration range 0.485 – 4.580 µg/kg) was used to gain further confidence in the performance of the method for the four compounds regulated by the EU. Results demonstrated satisfactory z-score values ranging from – 0.98 to 0.04 for each of the compounds, and at – 0.69 for the sum of the four ().
Figure 3. LC-MS/MS method performance at LOQ and 5xLOQ for PFOA, L-PFOS, PFNA and L-PFHxS in food against criteria defined by the EU POPs criteria (EURL Citation2022).
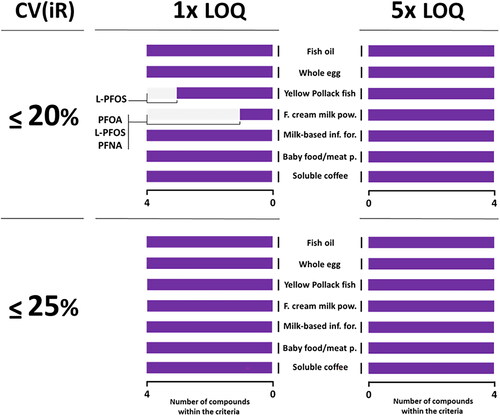
Table 2. Overview of assigned values, obtained z-scores and trueness values for the FAPAS T06107QC fish sample analysed during validation.
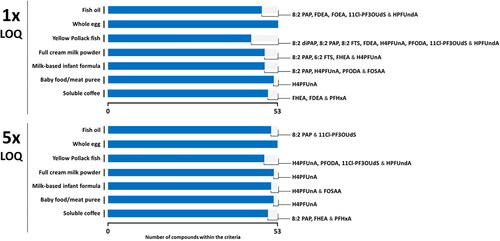
The method demonstrated adequate performance for the quantitative determination of the other analytes included in the scope, with only a few of them that exhibit indicators out of the criteria (). Based on our set of data, whole egg presents no difficulty in the analysis of PFAS as regard to the compounds and analytical conditions selected. In contrast, a few analytes show performance characteristics that do not fit with the criteria in other matrices. Fish appears as the most challenging ingredient with eight and four compounds whose performance are out of the criteria at the LOQ and 5xLOQ, respectively. It is worth mentioning that the performance did not exhibit significant differences between the group of analytes quantified with an isotopomer as internal standard (25 compounds) and those determined based upon a derivative used as stable isotope-labelled internal standard (19 compounds).
Figure 4. LC-MS/MS method performance at LOQ and 5xLOQ for the PFAS (PFOA, L-PFOS, PFNA and L-PFHxS are excluded) in food matrices by LC-MS/MS against criteria defined by the EU POPs criteria (EURL Citation2022).
It is pointing out that the recoveries of the different isotope-labelled standards in the food matrices compared to the solvent varied from 60 – 110% for all samples with some exceptions. In coffee, lower recoveries were observed for all compounds and ranged between 40 – 70%, except for M2-4:2FTS (15%) and M2-8:2PAP (170%). Lower recoveries were observed for the isotopic labelled standards of the telomers acids (MFHEA, MFUEA, MFDEA), 30 – 40% and the unsaturated telomer acids (MFHUEA, MFOUEA, MFDUEA) 40 – 70% for all matrices. Furthermore, the following isotope-labelled standards, d-N-MeFOSA-M, d-N-EtFOSA-N, d7-N-MeFOSE-M and d9-N-EtFOSE-M had a recovery ranging from 15 – 40% in Group A matrices while in Group B matrices the recovery was in a higher range 60 – 90%.
Commodity check on a broader range of materials
The applicability of the method was further investigated on a broader set of foodstuffs, detailed in the section Materials and Methods. Each sample was fortified at the LOQ, prior to being analyzed in duplicates. For PFOA, L-PFOS, PFNA and L-PFHxS, the LOQs were set at 0.01 µg/kg for infant foods and milk-based ingredients, 0.1 µg/kg for fish and meat, 0.3 µg/kg for egg fractions and roast & ground coffee, and 0.5 µg/kg for fats and oils. The target requirements for PFOA, L-PFOS, PFNA and L-PFHxS were achieved with some exceptions summarised hereafter (see Supplementary Material 2 for details). PFNA in poultry oil was found with a recovery at 59%, slightly below the lower limit defined at 60% (CV(r) at 7%) and with a repeatability at 21% in white egg powder. In chicken powder, it was recovered at 20% with a repeatability measured at 71%. A few performance indicators were also found out of criteria for PFOA in skim milk powder (CV(r) at 40%) and coffee (CV(r) at 26%). In anchovy powder, the trueness could not be assessed with sufficient confidence for L-PFOS due to the presence of a contamination estimated at 0.82 µg/kg. The performance obtained for PFOA, L-PFOS, PFNA and L-PFHxS were within the criteria in infant foods whatever product it was, fruit-, vegetable-based puree or infant cereal. It is interesting to mention that the PFAS that were not fulfilling the criteria during the full validation step had the same behavior during the commodity check exercise. Some exceptions were still observed in milk-based products, meat, fish matrices and coffee samples. A summary of these observations is presented in .
Discussion
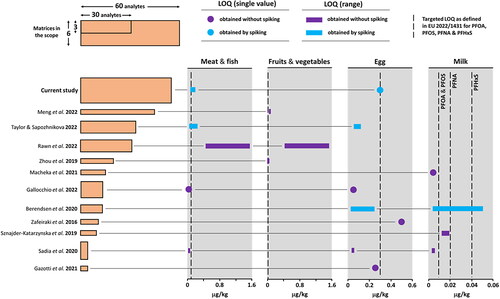
Over the past years, several methods dedicated to the quantitative determination of PFAS in food were published in the literature, most of them based upon LC-MS/MS even if liquid chromatography-high resolution mass spectrometry (LC-HRMS) appears as an attractive alternative to consider for improving the sensitivity (Taylor and Sapozhnikova Citation2022). Some of these methods exhibit a restricted scope in terms of matrices with a single one validated, such as milk (Sznajder-Katarzyńska et al. Citation2019; Macheka et al. Citation2021), egg (Zafeiraki et al. Citation2016; Gazzotti et al. Citation2021), vegetables (Zhou et al. Citation2019; Meng et al. Citation2022) or infant food (Ullah et al. Citation2012), while others offered more diversity in the application with two matrices in the scope at least (Berendsen et al. Citation2020) up to three materials that consist of meat and fish in combination with either vegetables (Rawn et al. Citation2022) or egg (Taylor and Sapozhnikova Citation2022). As regard to the number of compounds, method scopes differ significantly from 3 (Sadia et al. Citation2020) to 45 substances (Meng et al. Citation2022). The current study is an advance in the field with 57 substances included in the scope. This scope results from pulling the lists of targets established by US FDA (Citation2021), EU (Citation2022a) plus a few more compounds that were believed of interest.
Given the Recommendation and Regulation released by the European Commission in 2022 for PFOS, PFOA, PFNA and PFHxS, the method by Sadia & co-workers (Sadia et al. Citation2020) appear as non-suitable without further adaptation due to the absence of PFNA in the scope. On the other hand, the four substances are in the scope of the other methods. Our method was developed for being applied to six matrices, namely fish oil, egg (as powder), meat & fish (as powder), milk powder, infant products (infant formula & baby food as sold) and soluble coffee. The later, not included in the EU Recommendation (EU Citation2022a), was part of the study due to obvious risks of contamination through water used at manufacturing.
As regard to the performance of the published methods, some conspicuous differences in the LOQs appear across those (). Different strategies in the sample preparation in combination with different chromatographic separations and instruments can explain the diversity in the LOQ. Nevertheless, we want to draw attention to the fact that the definition applied to the LOQ can further impact the apparent performance of the method. Particularly, when the claimed LOQ is based solely on a criterion applied to the signal-to-noise ratio, without subsequent control and validation by spiking in the matrix, the risk of erroneous or misleading results is significant, especially at low levels (Delatour, Theurillat, Eriksen, et al. Citation2023). Some interferences have been reported (Benskin et al. Citation2007; Sadia et al. Citation2020) and extreme care must be paid to contaminations in the laboratory; this may disrupt the detection capability of the method if it is not properly assessed. Of note, the concept of limit of confirmation was applied by Berendsen et al. (Citation2020) for preventing the risk of false detection. A recent interlaboratory study has shown how challenging is PFAS analysis by LC-MS/MS (Delatour et al. Citation2023). Under such circumstances, we applied the European identification criteria (EU Citation2021; EURL Citation2022) and validated the LOQ by fortification in the food matrix prior to analysis followed by precision and accuracy assessment, for making sure the results are as reliable as possible with the current technology available.
Figure 5. Performance of methods demonstrating the differences in the number of analytes, matrix scope and LOQ for PFOA, PFOS, PFNA and PFHxS.
Conclusion
The present study describes an analytical approach for the determination of 57 PFAS in various food commodities to ensure compliance with the recent EU Regulation (EU Citation2022b) and EU Recommendation (EU Citation2022a) but also for investigation purposes. Several issues were faced during this analytical development: a) seven compounds out of the fifty-seven could not fulfill the confirmatory criteria set by EURL POPs as only one MS transition reaction is available; b) the zwitterion compounds capstone A and capstone B, listed as emerging analytes in EU 2022/1431 (EU Citation2022a) were validated only for baby food and milk-based products, asking thus for more work to include them for monitoring other foodstuffs; c) as many isotopically labelled PFAS are not commercially available yet, method performances for the related unlabelled species are impacted; d) the systemic background contamination is a limiting factor to achieve the LOQs requested by the EU (EU Citation2022a) for some commodities, often requiring reporting at higher levels to fulfill the EURL POPs requirements (EURL Citation2022).
Overall, our validation data demonstrated the robustness of the method for most of the compounds and the LOQs achieved were low enough to ensure future collection of occurrence data at ng/kg level in several food matrices.
Author contributions
Xanthippe Theurillat: Conceptualisation, Methodology, Investigation, Validation, Formal analysis, Resources, Visualisation, Roles/Writing – original draft; Writing – review & editing. Claudia Mujahid: Conceptualisation, Methodology, Investigation, Validation, Formal analysis, Resources, Roles/Writing – original draft; Writing – review, Visualisation; Bjorn Eriksen: Conceptualisation, Methodology, Investigation, Validation, Formal analysis, Resources, Roles/Writing – original draft; Writing – review, Visualisation; Ashley Griffin: Methodology, Validation, Formal analysis, Resources, Writing – review & editing, Visualisation; Andrew Savage: Methodology, Validation, Formal analysis, Resources, Writing – review & editing, Visualisation; Thierry Delatour: Conceptualisation, Investigation, Resources, Writing – review & editing; Pascal Mottier: Conceptualisation, Investigation, Resources, Writing – review & editing, Project administration.
Supplemental Material
Download Zip (295 KB)Disclosure statement
The authors are employees of the Société des Produits Nestlé SA – Nestlé Research Lausanne.
References
- Benskin JP, Bataineh M, Martin JW. 2007. Simultaneous Characterization of Perfluoroalkyl Carboxylate, Sulfonate, and Sulfonamide Isomers by Liquid Chromatography − Tandem Mass Spectrometry. Anal Chem. 79(17):6455–6464. doi: 10.1021/ac070802d.
- Berendsen BJA, Lakraoui F, Leenders L, van Leeuwen SPJ. 2020. The analysis of perfluoroalkyl substances at ppt level in milk and egg using UHPLC-MS/MS. Food Addit Contam Part A Chem Anal Control Expo Risk Assess. 37(10):1707–1718. doi: 10.1080/19440049.2020.1794053.
- Boronow KE, Brody JG, Schaider LA, Peaslee GF, Havas L, Cohn BA. 2019. Serum concentrations of PFASs and exposure-related behaviors in African American and non-Hispanic white women. J Expo Sci Environ Epidemiol. 29(2):206–217. doi: 10.1038/s41370-018-0109-y.
- Buck RC, Franklin J, Berger U, Conder JM, Cousins IT, de Voogt P, Jensen AA, Kannan K, Mabury SA, van Leeuwen SPJ. 2011. Perfluoroalkyl and polyfluoroalkyl substances in the environment: terminology, classification, and origins [. Integr Environ Assess Manag. 7(4):513–541. doi: 10.1002/ieam.258].
- Delatour T, Theurillat X, Eriksen B, Mujahid C, Mottier P. 2023. Inadequate Definition of the Limit of Quantification Applied for the Quantification of Perfluoroalkyl Substances in Food by LC-MS/MS May Compromise the Reliability of the Data Requested by the European Regulation. Rapid Comm Mass Spectrometry. 37(11):e9507. doi: 10.1002/rcm.9507.
- Delatour T, Theurillat X, Mujahid C, Eriksen B, Mottier P. 2023. Determination of Poly- and Perfluoroalkylated Substances in Food: how Consistent Are Results across Laboratories? J Agric Food Chem. 71(12):4767–4768. doi: 10.1021/acs.jafc.3c01306.
- EFSA 2020. European Food Safety Authority – Risk to human health related to the presence of perfluoroalkyl substances in food. https://www.efsa.europa.eu/fr/efsajournal/pub/6223.
- EU 2017. SANTE/11813/2017: guidance document on analytical quality and method validation procedures for pesticide residues and analysis in food and feed.
- EU 2019. Analytical Quality Control and method validation procedures for pesticide residues analysis in food and feed.
- EU 2021. Commission Implementing Regulation (EU) 2021/808 of 22 March 2021 on the performance of analytical methods for residue of pharmacologically active substances used in food-producing animals and on the interpretation of results as well as on the methods the be used for sampling and repealing Decisions 2002/657/EC and 98/179/EC.
- EU 2022a. Commission Recommendation (EU) 2022/1431 of August 2022 on the monitoring of perfluoroalkyl substances in food. Official Journal of the European Union.
- EU 2022b. Commission Regulation (EU) 2022/2388 of 7 December 2022 amending Regulation (EC) No 1881/2006 as regards maximum levels of perfluoroalkyl substances in certain foodstuffs.
- EURL 2022. European Union Reference Laboratory for halogenated POPs in feed and food: guidance Document on Analytical Parameters for the Determination of Per- and Polyfluoroalkyl Substances (PFAS) in Food and Feed. https://eurl-pops.eu/core-working-groups#_pfas.
- Gazzotti T, Sirri F, Ghelli E, Zironi E, Zampiga M, Pagliuca G. 2021. Perfluoroalkyl contaminants in eggs from backyard chickens reared in Italy. Food Chem. 362:130178. doi: 10.1016/j.foodchem.2021.130178.
- Göckener B, Eichhorn M, Lämmer R, Kotthoff M, Kowalczyk J, Numata J, Schafft H, Lahrssen-Wiederholt M, Bücking M. 2020. Transfer of Per- and Polyfluoroalkyl Substances (PFAS) from Feed into the Eggs of Laying Hens. Part 1: analytical Results Including a Modified Total Oxidizable Precursor Assay. J Agric Food Chem. 68(45):12527–12538. doi: 10.1021/acs.jafc.0c04456.
- Haug LS, Salihovic S, Jogsten IE, Thomsen C, van Bavel B, Lindström G, Becher G. 2010. Levels in food and beverages and daily intake of perfluorinated compounds in Norway. Chemosphere. 80(10):1137–1143. doi: 10.1016/j.chemosphere.2010.06.023.
- ISO. 1994. ISO 5725 – Accuracy (trueness and precision) of measurement methods and results.
- Lath S, Knight ER, Navarro DA, Kookana RS, McLaughlin MJ. 2019. Sorption of PFOA onto different laboratory materials: filter membranes and centrifuge tubes. Chemosphere. 222:671–678. doi: 10.1016/j.chemosphere.2019.01.096.
- Liu S, Junaid M, Zhong W, Zhu Y, Xu N. 2020. A sensitive method for simultaneous determination of 12 classes of per- and polyfluoroalkyl substances (PFASs) in groundwater by ultrahigh performance liquid chromatography coupled with quadrupole orbitrap high resolution mass spectrometry. Chemosphere. 251:126327. doi: 10.1016/j.chemosphere.2020.126327.
- Macheka LR, Olowoyo JO, Mugivhisa LL, Abafe OA. 2021. Determination and assessment of human dietary intake of per and polyfluoroalkyl substances in retail dairy milk and infant formula from South Africa. Sci Total Environ. 755(Pt 2):142697. doi: 10.1016/j.scitotenv.2020.142697.
- Meng P, DeStefano NJ, Knappe DRU. 2022. Extraction and Matrix Cleanup Method for Analyzing Novel Per- and Polyfluoroalkyl Ether Acids and Other Per- and Polyfluoroalkyl Substances in Fruits and Vegetables. J Agric Food Chem. 70(16):4792–4804. doi: 10.1021/acs.jafc.1c07665.
- Moody CA, Field JA. 1999. Determination of Perfluorocarboxylates in Groundwater Impacted by Fire-Fighting Activity. Environ. Sci. Technol. 33(16):2800–2806. doi: 10.1021/es981355+.
- Moody CA, Field JA. 2000. Perfluorinated Surfactants and the Environmental Implications of Their Use in Fire-Fighting Foams. Environ Sci Technol. 34(18):3864–3870. doi: 10.1021/es991359u.
- OECD. 2021. Reconciling Terminology of the Universe of Per- and Polyfluoroalkyl Substances: recommendations and Practical Guidance. Series on Risk Management. 61
- Rawn DFK, Ménard C, Feng SY. 2022. Method development and evaluation for the determination of perfluoroalkyl and polyfluoroalkyl substances in multiple food matrices. Food Addit Contam Part A Chem Anal Control Expo Risk Assess. 39(4):752–776. doi: 10.1080/19440049.2021.2020913.
- Sadia M, Yeung LWY, Fiedler H. 2020. Trace level analyses of selected perfluoroalkyl acids in food: method development and data generation. Environ Pollut. 263(Pt A):113721. doi: 10.1016/j.envpol.2019.113721.
- Schaider LA, Balan SA, Blum A, Andrews DQ, Strynar MJ, Dickinson ME, Lunderberg DM, Lang JR, Peaslee GF. 2017. Fluorinated Compounds in U.S. Fast Food Packaging. Environ Sci Technol Lett. 4(3):105–111. doi: 10.1021/acs.estlett.6b00435.
- Shoeib T, Hassan Y, Rauert C, Harner T. 2016. Poly- and perfluoroalkyl substances (PFASs) in indoor dust and food packaging materials in Egypt: trends in developed and developing countries. Chemosphere. 144:1573–1581. doi: 10.1016/j.chemosphere.2015.08.066.
- Sunderland EM, Hu XC, Dassuncao C, Tokranov AK, Wagner CC, Allen JG. 2019. A review of the pathways of human exposure to poly- and perfluoroalkyl substances (PFASs) and present understanding of health effects. J Expo Sci Environ Epidemiol. 29(2):131–147. doi: 10.1038/s41370-018-0094-1.
- Sznajder-Katarzyńska K, Surma M, Wiczkowski W, Cieślik E. 2019. The perfluoroalkyl substance (PFAS) contamination level in milk and milk products in Poland. Int Dairy J. 96:73–84. doi: 10.1016/j.idairyj.2019.04.008.
- Taylor RB, Sapozhnikova Y. 2022. Comparison and validation of the QuEChERSER mega-method for determination of per- and polyfluoroalkyl substances in foods by liquid chromatography with high-resolution and triple quadrupole mass spectrometry. Anal Chim Acta. 1230:340400. doi: 10.1016/j.aca.2022.340400.
- Ullah S, Alsberg T, Berger U. 2011. Simultaneous determination of perfluoroalkyl phosphonates, carboxylates, and sulfonates in drinking water. J Chromatogr A. 1218(37):6388–6395. doi: 10.1016/j.chroma.2011.07.005.
- Ullah S, Alsberg T, Vestergren R, Berger U. 2012. Determination of perfluoroalkyl carboxylic, sulfonic, and phosphonic acids in food. Anal Bioanal Chem. 404(8):2193–2201. doi: 10.1007/s00216-012-6374-z.
- UNEP 2019. Stockholm convention on peristent organic pollutants (POPs). http://chm.pops.int/TheConvention/Overview/TextoftheConvention/tabid/2232/Default.aspx.
- US FDA 2021. C-010.02: Determination of 16 Per and Polyfluoroalkyl Substances (PFAS) in Processed Food using Liquid Chromatography-Tandem Mass Spectrometry (LC-MS/MS).
- USEPA 2021. PFAS Master List of PFAS Substances. https://comptox.epa.gov/dashboard/chemical-lists/pfasmaster.
- Wang Z, Cousins IT, Scheringer M, Hungerbuehler K. 2015. Hazard assessment of fluorinated alternatives to long-chain perfluoroalkyl acids (PFAAs) and their precursors: status quo, ongoing challenges and possible solutions. Environ Int. 75:172–179. doi: 10.1016/j.envint.2014.11.013.
- Yu CH, Patel B, Palencia M, Fan ZT. 2017. A sensitive and accurate method for the determination of perfluoroalkyl and polyfluoroalkyl substances in human serum using a high performance liquid chromatography-online solid phase extraction-tandem mass spectrometry. J Chromatogr A. 1480:1–10. doi: 10.1016/j.chroma.2016.11.063.
- Zafeiraki E, Costopoulou D, Vassiliadou I, Leondiadis L, Dassenakis E, Hoogenboom RL, van Leeuwen SP. 2016. Perfluoroalkylated substances (PFASs) in home and commercially produced chicken eggs from the Netherlands and Greece. Chemosphere. 144:2106–2112. doi: 10.1016/j.chemosphere.2015.10.105.
- Zhou Y, Lian Y, Sun X, Fu L, Duan S, Shang C, Jia X, Wu Y, Wang M. 2019. Determination of 20 perfluoroalkyl substances in greenhouse vegetables with a modified one-step pretreatment approach coupled with ultra performance liquid chromatography tandem mass spectrometry(UPLC-MS-MS). Chemosphere. 227:470–479. doi: 10.1016/j.chemosphere.2019.04.034.