
Abstract
In this study, direct analysis in real time high resolution mass spectrometry (DART-HRMS) was used to investigate the accurate characterisation of feed additive formulations containing coccidiostats or carotenoids. The study demonstrates the efficacy of DART-HRMS in identifying the active substances in these formulations and distinguishing between feed additives with the same active substance. The protocol for this method involves two simple steps that are extracting samples with organic solvents and measuring the extracts with DART-HRMS. The study also employs various statistical tools, including a factorial design approach, to optimise the DART-HRMS settings, and multivariate statistics, to establish classification models for feed additive formulations using nominal mass spectra. Our study demonstrates the potential of DART-HRMS in ensuring the correct identification of feed additives containing various coccidiostats or carotenoids and proposes this tool as an additional means for compliance checks with EU regulations.
Introduction
Feed additives are important ingredients of compound feed, improving, for instance, the properties of feed or the performance of animals in good health (EU Citation2003). Therefore, they are widely used in modern animal nutrition. When employed within the European Union, these products need a pre-market authorisation applying a procedure specified by European Legislation (EU Citation2003). This Regulation classifies feed additives according to their action into five categories, namely (a) technological additives, (b) sensory additives, (c) nutritional additives, (d) zootechnical additives and (e) coccidiostats and histomonostats. The procedure foresees that the EFSA conducts a scientific evaluation of the dossier submitted by the applicant, containing all relevant details of the product, for which authorisation is sought. The dossier specifies for instance the composition of the product and the results of studies on the safety and efficacy, when applying the feed additive under real-world condition. To obtain authorisation, it is also necessary to involve the European Union Reference Laboratory for Feed Additives (EURL-FA), which is hosted by the European Commission’s Joint Research Centre. This includes the obligation for the applicant to submit feed additive samples to the EURL-FA, which maintains a sample bank of such additives. Additionally, the applicant is required to propose analytical methods for the determination of feed additives, which is essential to ensure the enforcement of the conditions of use for these products within the framework of official control. These conditions are specified by EU Regulations and include, e.g. criteria for the composition of the feed additives or their minimum and/or maximum levels in compound feed. More details of the operation of the EURL are given in EU legislation (EC Citation2005) and further explained in a previous publication (von Holst et al. Citation2016). Based on the opinion of EFSA and the report of the EURL-FA, the EC, assisted by the Member States within the Standing Committee on Plants, Animals, Food and Feed, decides on the approval or denial of the authorisation, individually for each feed additive. If the feed additive is found to have demonstrated efficacy and safety in terms of animal and human health as well as on the environment, it can be authorised for a maximum of 10 years. The manufacturers must apply for renewal of authorisation, if they wish to keep the feed additive on the market. The authorisation of feed additives is published by Commission Implementing Regulations allocating a unique identification number to each product. These Regulations can easily be retrieved via the feed additive register, which is a very handy tool and can be assessed online (EC Citation2023).
The safe use of feed additives requires that products placed on the EU market comply with the criteria specified by the Regulation. For instance, for the feed additive with the commercial name Clinacox, the following details are given in the Regulation (EC Citation2010): This product has been attributed the unique identification number 5 1 771, specifying diclazuril as the active substance and other ingredients such as protein-poor soybean meal. It is important to highlight that under this identification number exclusively this product can be marketed. This restriction of the authorisation conditions is based on the principle that exclusively products previously evaluated by EFSA can be used in animal nutrition, thus requiring full traceability of feed additives present on the EU market. One important measure is the legal obligation (EU Citation2009) to label these products with a whole set of information including the name of the feed additive, identification number and other details. While analytical methods for the quantification of the active substance are specified in the corresponding Regulations, easy-to-use methods for the characterisation of the products are often missing. Such a method would support the investigation, whether a specific additive is labelled with the correct identification number. In previous studies, vibrational spectroscopy (Omar et al. Citation2015) and direct analysis in real time coupled to high resolution mass spectrometry (DART-HRMS) (von Holst et al. Citation2022) have been applied successfully to distinguish between products that differ in terms of most ingredients but contain the same coccidiostat. Both techniques demonstrated that the corresponding spectra show sufficient fingerprint information of the feed additives analysed as supported by the results from the application of multivariate statistics. However, the unique advantage of DART-HRMS compared to vibrational spectroscopy is the additional capacity to identify unequivocally the active substance in the product under investigation.
The DART technology has been introduced by Cody et al. (Citation2005) as a new ion source that can be mounted on different MSs allowing for very rapid analysis of samples by generating instantaneously mass spectra suitable for further investigation. There are quite different configurations regarding the way how samples are measured. For instance, the sample such as tablets or leaves can be presented directly to the DART beam via a sample holder (Gross Citation2014) to measure molecules that can be desorbed and ionised under the specific DART-HRMS conditions applied. However, in many applications, the sample is first extracted with organic solvents and the extracts are subsequently measured with DART-HRMS. In general, the mass spectra obtained with DART-HRMS are used for two different purposes, namely identification or even quantification of specific substances or fingerprinting for the characterisation of different groups of samples and the distinction between these groups. In a recent study, Tsagkaris et al. (Citation2022) applied DART-high resolution mass spectrometry (DART-HRMS) to the analysis of mycotoxins in cereals after extraction with an organic solvent and subsequent clean-up of the extract, demonstrating that acceptable values for the trueness and precision could be achieved. While this mycotoxin study focused on the determination of natural contaminants, DART-HRMS is also applied to the determination of active substances in plant materials (Chambers and Musah Citation2022), analysing salvia products for the content of salvinorin A, which is its major psychoactive component. Chambers and Musah (Citation2022) detected cannabinoids in cannabis products by directly presenting the sample to the DART-HRMS system, thus omitting the extraction step prior to analysis. With respect to feed analysis, Martínez-Villalba et al. (Citation2013) presented a method that allows for the quantitative determination of different coccidiostats in compound feed at levels of 0.25–0.5 mg kg−1. The applied protocol required after extraction of the feed samples a clean-up step prior to measurement with DART-HRMS. A widespread application DART-HRMS covers the evaluation of whole MS spectra to achieve classification of samples into different groups of interest. In general, such an objective requires the extensive use of multivariate statistics. Applications are reported on studies to distinguish between different insect species (Tata et al. Citation2022), differentiate between authentic and adulterated oregano samples (Massaro et al. Citation2021) or on the authenticity of farmed and wild-type salmon (Fiorino et al. Citation2019). This technique has also been applied for the authenticity of cacao products (Rýdlová et al. Citation2020).
In the present project, we have pursued several goals. At first, we optimised the settings of the new generation of DART-HRMS instruments. We then compared the spectra obtained with two different generations of DART-HRMS instrument configurations to investigate their impact on the fingerprint information of the MS spectra. This evaluation was done by comparing the results from the former study (von Holst et al. Citation2022), where an old DART-HRMS configuration was applied with the experimental results received with the new configuration utilised in the present study. This comparison was considered important for situations where the samples were used to create a statistical model and the samples used for predictions were measured on different DART-HRMS configurations. Moreover, the study was extended to another group of coccidiostats to corroborate the separation power of DART-HRMS requiring the application of PCA and partial least squares discriminant analysis (PLS-DA) to the measured MS spectra. In this study, we also used DART-HRMS to measure carotenoid-containing feed additives for the first time and optimised the corresponding settings using a factorial design approach. In all cases, the spectra were used for two purposes, namely (1) the identification of the active substances by evaluating the accurate mass of the target ions and (2) the distinction of similar feed additives by subjecting the generated mass spectra to multivariate statistics.
Materials and methods
Test material
The study was conducted on different feed additives containing specific coccidiostats or specific carotenoids. An overview of the feed additives with their specific characteristics used in this study is given in . The test material used in this study was taken from the sample bank maintained by the EURL-FA.
Table 1. Feed additives used in this study and information on the identification and composition of these products including the unique identification number as specified in the corresponding legal acts available via the European Union Register of Feed Additives (EC Citation2023), qs: quantum satis.
The group of coccidiostats containing feed additives covered the following products: (1) Coxiril and Clinacox with diclazuril as the common active substance and (2) Coxidin (CaCO3), Coxidin (wheat) and (3) Elancoban with monensin sodium as common active substance. For the comparison between the two DART-HRMS configurations, all analyses were performed on the same Coxiril and Clinacox sample extracts that were already measured in the former study (von Holst et al. Citation2022). The extracts were kept at –20 °C for the period between the two studies. In short, from each set of calibration samples, independent measurements were done on 90 samples per feed additive covering three different batches, respectively. Moreover, validation samples belonging to different batches were analysed, which were 45 for Clinacox and 60 for Coxiril. The samples from Clinacox belonged to a single batch, while the samples from Coxiril covered two different batches. More details on the samples are given in the publication of the former study (von Holst et al. Citation2022). The purpose of the validation samples was to assess the prediction capability of the established statistical models.
The following samples were used for the experiments with Coxidin (CaCO3), Coxidin (wheat) and Elancoban. The calibration samples used for creating the PLS-DA models were from 2018, while samples for validating the model were sent to the EURL-FA between 2013 and 2014. For the calibration of the models, 90 samples from three batches of each of three feed additives were used and the validation was done with 30 samples of one batch of Elancoban and 60 samples from two batches of each of the two Coxidin forms. In general, samples were taken from freshly opened sealed sachets, while a set of sachets of one batch of each Coxidin form was already opened in 2014 for another study.
We also analysed a set of 15 samples from an unauthorised diclazuril containing product, to establish, whether the active substance could be identified in this product and whether the fingerprinting analysis allowed for separation from the corresponding authorised feed additives Coxiril and Clinacox.
The group of carotenoids includes two types of products, which are either from natural origin or produced by chemical synthesis. The approximate content of the target carotenoids in these products is given in . Phaffia rhodozyma is an inactivated dried yeast and Paracoccus carotinifaciens (Panaferd-AX) is a dried sterilised bacterium. Both products are rich in astaxanthin, while the latter product also contains canthaxanthin and adonirubin at a lower mass fraction. Carotenoids produced by chemical synthesis cannot be placed on the market as such, but exclusively via encapsulated preparations stabilised with antioxidants. The need for encapsulation reflects the known instability of carotenoids towards oxygen, light and high temperatures, thus rendering these products more stable. In detail, the current feed additive register contains three different products containing carotenoids from chemical synthesis, namely one preparation of astaxanthin with the identification number 2a161j and two different preparations containing canthaxanthin with the identification numbers 2a161g and 4d161g, respectively.
All samples were taken as delivered from the applicants and subjected to extraction and measurement, with the exception of the comparative study of the two DART-HRMS configurations, in which extracts prepared from the former study were used. These extracts measured in 2019 were kept in the freezer.
Sample preparation
For the extraction of the coccidiostats and carotenoids, the procedure of the previous publication (von Holst et al. Citation2022) was applied. In short, an aliquot of 100 mg coccidiostat feed additive preparation was weighed in a 2 ml polypropylene tube and extracted with 1 ml extraction solvent. The extraction solvent of choice was acetonitrile:methanol:water (80:10:10, v/v/v) mixture. When processing carotenoids, the solvent was substituted by acetone. After addition of the extraction solvent, the mixture was ultrasonicated (Branson 5510, Branson Ultrasonics Cooperation, Danbury, CT) for 5 min at room temperature. Subsequently, it was shaken at room temperature for 15 min in a thermomixer (MixMate®, Eppendorf AG, Hamburg, Germany) at 1500 rpm. After the extraction steps, the solution was centrifuged (2-15KC, Sigma Laborzentrifugen™, Osterode am Harz, Germany) at 18,894 × g for 5 min. Finally, the supernatant was transferred into a sealable glass vial and stored at –20 °C until use.
Measurement and settings of the DART-HRMS
The new DART-HRMS configuration utilised in this study was DART ion source (Ion Sense JumpShot SVP, JS300) coupled with a Thermo Q-exactive Plus (Thermo Fisher Scientific, Waltham, MA) MS. The DART ion source was operated in pulse gas mode, minimising environmental background peaks and reducing helium consumption. Five microlitres extract was pipetted into the DART QuickStrip sample card. After solvent evaporation, the QuickStrip card was placed into the holder on the automated linear rail of the DART instrument. The linear rail with sample card moves through the opening of the DART ionisation source and the inlet of MS once prompted. The details of the old DART-HRMS configuration are given in the previous publication (von Holst et al. Citation2022).
Data for both positive and negative spectral profile were obtained for coccidiostat feed additive preparations using the same QuickStrip card, where monensin was identified in positive MS mode and diclazuril in negative MS mode (). The carotenoid containing feed additives was exclusively measured in positive MS mode, given the physicochemical characteristics of these substances. Masses were recorded in a range from m/z 100 to m/z 1000. The system was regularly calibrated externally by infusion of a calibration mixture in positive (MSCAL5 Cal Mix, Merck, Kenilworth, NJ) and negative mode (MSCAL6 Cal Mix, Merck, Kenilworth, NJ) at a flow rate of 5 µl/min. The accurate masses of the coccidiostats were compared against the exact masses calculated with the software package Mass Frontier 6.0 (ThermoScientific, San Jose, CA).
The following settings of the DART-HRMS for the measurements of the coccidiostats and carotenoids were selected.
Coccidiostats: DART settings: helium and nitrogen pressure in run and standby mode, respectively: 5 bar; run temperature: 375 °C; standby temperature: 365 °C; grid voltage: 350 V; pulse time: 1 s for diclazuril containing feed additives and 2 s for the monensin sodium containing feed additives. HRMS settings: spray voltage: 1 kV; capillary temperature: 325 °C; S-lens RF level: 100; resolution: 35 K; automatic gain control (AGC): 1e6; maximum injection time: 250 ms; scan range: 100–1000 m/z.
Carotenoids: DART settings: helium and nitrogen pressure in run and standby mode, respectively: 5 bar; run temperature: 450 °C; standby temperature: 450 °C; grid voltage: 250 V, pulse time: 2 s; HRMS settings: spray voltage: 1 kV; capillary temperature: 250 °C; S-lens RF level: 100; resolution: 35 K; AGC: 1e6; maximum injection time: 250 ms; scan range: 100–1000 m/z.
The spectra obtained from each measurement were manually taken by averaging across the area of each peak at the bottom of the peaks.
Data treatment and multivariate statistics
Prior to conducting the multivariate analysis, the raw data were exported from the mass spectrum with Xcalibur™ software (Thermo Fisher Scientific, Waltham, MA) and transferred into Microsoft Excel file. Subsequently, the data comprised of the nominal masses and their absolute intensities were treated with an Excel formula for noise cancellation purposes. The mass with the highest intensity in each spectrum was used as reference (base peak) and all masses with an intensity below 1% related to base peak were considered noise. The formula used looks for the base peak and removes peaks that are 1% or lower than the intensity of the base peak. For the fingerprinting study of the coccidiostat and carotenoid samples, the mass spectra of the nominal masses were processed in the same way as explained in the previous publication (von Holst et al. Citation2022). In short, the data from the Excel file were read into MATLAB® R2018a (MathWorks, Natick, MA) followed by alignment and constant-sum-normalisation that was individually done for each sample with an in-house developed MATLAB® script. The file was subsequently uploaded in PLS_Toolbox (Eigenvector Research, Inc., Wenatchee, WA), which is used to carry out the calculations of all multivariate statistics applied in this study. At first, the data were pre-processed by median centring and Pareto scaling, separately for each mass and across all samples. Subsequently, the pre-processed data were either subjected to PCA or PLS-DA, depending on the actual purpose of the statistical assessment. When establishing PLS-DA models to distinguish between two feed additives of different origin, the class variable Y was set at 1 and 0 for the two groups. Moreover, permutation tests (Westerhuis et al. Citation2008) were applied to check the significance of the established PLS-DA models and to indicate if they were potentially over-fit. In short, when applying permutation tests, class affiliations in terms of 1 or 0 for Y are randomly changed of the samples and PLS-DA models are established with the ‘incorrect’ Y attributions. This exercise is repeated many times and in this study the number of iterations was set at 200. The separation power of these models is estimated and the performance of the model with the correct Y attributions is compared against the corresponding values of the 200 iterations. The original PLS-DA model is considered significant and not over-fit if it performs better at a confidence level of at least 95%.
The format of the experimental designs and corresponding statistical evaluation was done with the commercial software package Statistica 10 (StatSoft Inc., Tulsa, OK).
Results and discussion
Optimisation of the DART-HRMS settings
Since the DART-HRMS settings from the former study delivered good results, we used the same configuration also in the present study. However, some new parameters of both the DART and the MS had to be optimised due to the different types and generations instruments utilised in the current study. First, experiments were carried out to establish, at which position of the DART peaks the spectra should be taken. Three positions were tested with a Coxiril extract, namely at the maximum intensity of the peak, averaging the peak at half of the maximum intensity and averaging the peak at the bottom of the peak. The comparison of the replicates of the normalised intensities for diclazuril showed that the scattering was very high when taking the spectra at the maximum intensity, whereas the variation of the normalised intensities was much lower obtained at half of the maximum intensity and the bottom of the peak. In all experiments, we took subsequently the spectra at the bottom of the peaks.
Settings for coccidiostats
The DART system was operated in the pulse mode and therefore experiments were done, to evaluate the impact of the pulse time set at 1 s, 5 s and 10 s on the obtained spectra. For this comparison, Coxiril extracts were used and the MS was operated in negative mode given the characteristics of diclazuril as the active substance of this product. Both, the visual inspection of the obtained spectra as well as the score plot from PCA revealed significant differences. While the main peaks of the products including from diclazuril were present in spectra of all the pulse times, the spectra generated with 5 s and 10 s showed a higher portion of background peaks. Therefore, all measurements of the diclazuril containing feed additives were done with 1 s. When applying this setting to the feed additives containing monensin sodium, we observed that the intensities of the measured spectra were very low. Therefore, pulse time was increased to 2 s, thus obtaining spectra with higher peak intensities, but still keeping the impact of potentially interfering peaks from the background low. A new parameter of the MS used in this study compared to the instrument from the former study was the S-lens RF level and measurements were done at different levels from 25 to 100. The highest intensity for the diclazuril peak was observed at the RF level of 100 and therefore this value was selected for all measurements.
Settings for carotenoids
Since until now, we had no experience with the measurement of carotenoid containing feed additives, all DART-HRMS settings had to be optimised and experiments were done applying a factorial design. The target response variables were (1) the absolute intensity of the m/z peaks of the active substances canthaxanthin and astaxanthin and (2) the total number of peaks counted in the spectra from the measured extract of each product. For both response variables, the optimal settings of the DART-HRMS would maximise these response variables for two reasons, namely to (1) facilitate the identification of the peak of the active substance in the spectra and (2) generate rich spectra suitable for subsequent fingerprinting analysis. The experimental design was comprised of four factors of the DART-HRMS adjusted at two levels and an additional level at the centre point of the factors as specified in . The factors selected for the optimisation experiments were: run temperature (°C), grid voltage (V), capillary temperature (°C) and S-lens RF level.
Table 2. Levels of the factors in the experimental design.
The lower and high levels of the factors were selected considering the minimum and maximum settings possible with the DART-HRMS instrument. The design was implemented via a half fraction factorial design with eight experiments at different combinations of the lower and high levels of the factors and six experiments at the central point of all factors, thus leading to a total number of 14 experiments. The experiments at the central point were used to estimate the pure error of the experiments, which in turn allows to establish the statistical significance of the calculated effects. In addition, these results from the central point were used to check, whether optimal conditions passed an optimum when switching from the low to high level of the factors, thus indicating the presence of curvilinear effects. All experiments were conducted in a random order. The measured absolute intensities of the exact mass of the [M + H]+ ions from canthaxanthin and astaxanthin present in different feed additives and the number of peaks from each product were subjected separately to statistical analysis of the results from the factorial design. An overview of the evaluation for (1) the peak intensity measured on the different active substance/product combinations and (2) the number of peaks obtained from the measurements of the different products are shown in .
Table 3. Effects of DART-HRMS settings on (1) the intensity of the peak of the active substance and (2) the number of peaks. In brackets are the references to the feed additives as specified in .
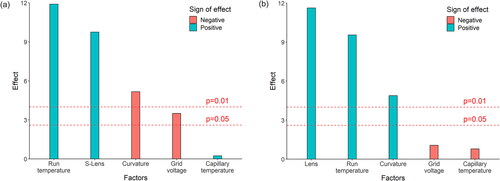
The results of the statistical assessment are expressed as effects of each factor on the target response variable and are determined by the difference between the means of experiments conducted at the respective low and high levels of the factor. For instance, the statistical assessment of the peak intensity of astaxanthin from Phaffia rhodozyma revealed that the mean of the experiments conducted at 450 °C (high level) of the run temperature was about 7,100,000 Units and the corresponding mean of the experiments conducted at 250 °C (low level) was about 700,000 Units. The difference of both values was +6,400,000 and by considering the analytical error of the measurements obtained from the replicate analyses of the experiments at the central point of all factors, the run temperature turned out to have a strong positive effect (p = .01). The standardised effects of all factors for this analyte/sample combination are shown in , revealing that in addition to the run temperature also the S-lens RF level had a strong positive effect on the intensity of the astaxanthin peak. This means that the highest values for the intensity were achieved when having these two factors at their higher level. The grid voltage had a negative effect, because higher peak intensities were observed, when the grid voltage was set at 250 V, i.e. at the low level of the design. In addition, the corresponding effect was less strong, because it was significant at the confidence level of 95%, but not at the confidence level of 99%. In contrast to these factors, the capillary temperature did not have a significant effect on the peak intensity. A strong negative value for the curvature means that the peak intensities measured at the central point of all factors were significantly lower compared to the estimated peak intensities assuming that there was a strict linear dependency of the peak intensity on the factors across all levels. However, this observation was not relevant to the aim of this study, because the focus was on identifying optimal DART-HRMS settings at which the peak intensity was maximised. Pareto chart in Figure 1(b) shows as an example the statistical assessment of the number of peaks obtained on the analysis of the Canthaxanthin product 2a161g. The results are similar to the previous evaluation, because the S-lens RF level and the run temperature had a strong positive effect on the number of peaks (p = .01). The curvature had a positive effect, because the number of peaks was much higher at the central point compared to the estimated number of peaks when assuming only a linear relationship. Since the number of peaks at the high levels of the S-lens RF level and the run temperature were not lower than the corresponding number at the central point, the probability of an optimum below the high levels of the factors was considered negligible. Therefore, the observed curvature did not influence the selection of optimal DART-HRMS settings. shows a summary of all results from the factorial design for the peak intensities and the number of peaks, indicating the strength of the effect depending on whether the statistical significance was p = .05 or p = .01. For all 12 different test materials, the effect of the S-lens RF level was strongly positive, while the same was the case for the run-temperature in nine test materials. The effect of the grid voltage was either negative or not significant and the effect of the capillary temperature was in 10 test materials not significant. Overall, the effects of the different factors were similar in all test materials, thus facilitating the selection of the optimal experimental settings: The run temperature and the S-lens RF level were set to the high levels and the grid voltage and the capillary temperature were set to the low levels.
Figure 1. Pareto chart of the effects of the four factors on the target responses, including the curvature. In addition, the lines of statistical significance for p = .05 and p = .01 are shown. The results of the statistical assessment for the following target responses are presented as examples: (a) the intensity of the active substance astaxanthin from Phaffia rhodozyma and (b) the number of peaks of the spectra from canthaxanthin preparation 2a161g. The factors ‘run temperature’ and ‘s-lens’ showed a strong positive effect on the target responses.
All optimised settings of the DART-HRMS are summarised in the experimental chapter of this paper and are applied for the identification of the active substances and the fingerprinting study of this group of feed additives.
Selection of extraction conditions for carotenoids
For the extraction of the carotenoids from the samples, three different extraction solvents were tested, namely (1) a mixture of acetonitrile:methanol:water:acetone (80:10:10, v/v/v), (2) a mixture of acetone:water (80:20, v/v) and (3) acetone. Since samples extracted with acetone provided the highest intensity of the target carotenoids and greater number of peaks in the spectrum, it was selected as the extraction solvent for carotenoids feed additive preparations. Given the observed intensity of the carotenoids that were sufficient to check for their identification by HRMS, we were also able to skip the enzymatic step, which is in general required to release quantitatively the carotenoids from the encapsulated products (Vincent et al. Citation2017). Therefore, all carotenoid containing products were extracted in this study with acetone.
Identification of the active substances
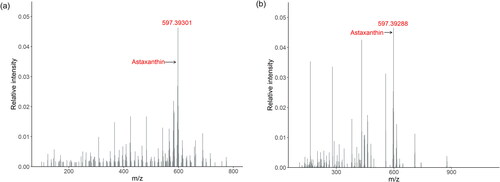
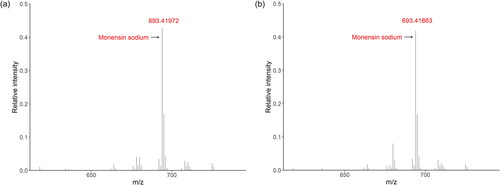
When analysing feed additives by DART-HRMS, the obtained spectrum needs to be checked for the presence of the target active substance and the subsequent identification by evaluating the corresponding accurate masses. Sufficient mass error values (ppm) were received for all ions of coccidiostats containing feed additives, because they ranged from –2.9 to –1.1 and therefore below the threshold limit of 5 ppm. Very low values for the mass error ranging from –3.6 to 2.9 were also received for astaxanthin, adonirubin and canthaxanthin present at low levels between 1 and about 20 g kg−1 in the complex extract of the natural product Paracoccus carotinifaciens. The evaluation of the mass spectra revealed that for the natural products, the peaks of astaxanthin showed the highest intensity compared with the other peaks in the spectra. In contrast, the relative intensities of the peaks of canthaxanthin and astaxanthin measured in the synthetic products were low compared to the expected relative intensity considering the very high mass fraction of these substances in the products as specified in . However, we omitted the enzymatic digestion step in this study to simplify sample preparation and the low intensities observed for carotenoids in synthetic products are likely related to this decision. shows the spectra obtained from the products Phaffia rhodozyma and astaxanthin, 2a161j with indication of the protonated mass of astaxanthin.
Figure 2. Mass spectra measured in positive MS mode of the natural feed additive Phaffia rhodozyma (a) and the synthetic feed additives astaxanthin, 2a161j (b), showing the peak of the active substance astaxanthin.
Fingerprinting of feed additive preparations
Former DART-HRMS versus new DART-HRMS configuration: impact on fingerprint evaluation
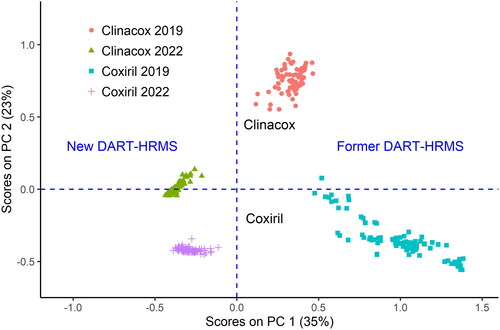
The classification of samples by fingerprint analysis of spectra is based on the principle that a multivariate model is established with samples of known class affiliation. Subsequently, the measured DART-HRMS of the validation samples are projected on this model to check the performance of the established multivariate model. In the present case, the PLS-DA models differentiating between Clinacox and Coxiril were previously created with measurements done in the former study employing a DART-HRMS comprised of a DART SVP100 model (2013) mounted on ThermoFisher Scientific Orbitrap Exactive HCD MS (2007) abbreviated here as former DART-HRMS configuration. To establish, whether the different instruments used in the former and the current study have an impact on the fingerprints of the MS spectra from these products, extracts from the same sample sets were measured with the new DART-HRMS. In a first attempt, the spectra of the validation samples from the measurements with the new configuration were projected on the PLS-DA models created from the extracts measured in positive and negative mode with the former configuration. However, the results were not satisfactory because in both measurements modes, the Clinacox samples were misclassified. In the next step, the spectra from these samples acquired with the former and the new DART configuration in positive mod were merged and a PCA model was established from all spectra to check, whether PCA could reveal a clustering of the samples according to the measurement configurations. In detail, 90 extracts from validation samples of each feed additive were measured with the new configuration, thus obtaining spectra from 180 measurements. These spectra were subsequently pooled with the corresponding 180 measurements of the same extract with the former configuration followed by pre-processing of the combined data set as described in section ‘Data treatment and multivariate statistics’ of this paper. The data were then subjected to PCA and the results are shown in , where the scores of the samples on the principal component 2 (PC) are plotted against the corresponding scores on PC 1. Different colours are used, to distinguish between the four different classes, namely the clinacox and coxiril samples measured with the former and the new DART-HRMS configuration, respectively. The score plot shows four different groups according to these classes. Visual evaluation of this score distribution revealed that the samples measured with the new configuration were in the negative range of PC 1 and the samples measured with the former configuration were in the positive range of PC 1. In a similar way, the Coxiril samples were in the negative range of PC 2 and the majority of the Clinacox samples were in the positive range of PC 2. This means that PC 1 is strongly linked to the measurement configuration, whereas PC 2 is linked to the type of feed additive. The outcome from the PCA analysis demonstrated that the specific DART-HRMS configuration may have a significant impact on the results from the application of multivariate statistics, indicating that spectra measured with different DART-HRMS configurations should not be merged, when aiming at the correct classification of different samples.
Figure 3. Mass spectra measured in positive MS mode of the natural feed additive Phaffia rhodozyma (a) and the synthetic feed additives astaxanthin, 2a161j (b), showing the peak of the active substance astaxanthin.
Based on these results, an updated PLS-DA model was established, where both the calibration and validations samples were measured with the new DART-HRMS in positive MS mode. As shown in , sufficient separation of the predictions samples was obtained when measuring in positive MS mode, while higher scattering was observed when measuring in negative MS (). However, in any case, sufficient classification was also observed in negative MS mode. also shows that the two batches of Coxiril validations created two sub-groups, but this had no impact on the accurate classification of all Coxiril validations. It is also worth mentioning that the distinction between the validations of both products was clearer when measuring with the new DART-HRMS configuration compared to the separation of the identical extract using the former DART-HRMS configuration as shown in the previous publication (von Holst et al. Citation2022).
Figure 4. Classification of Coxiril and Clinacox samples using the new DART-HRMS configuration measured in positive (a) and negative (b) MS mode. The PLS-DA model was established with the calibration samples and tested with the validation samples, obtaining very good results for the prediction. In the negative MS mode, the two batches from the Coxiril prediction samples from two different sub-groups, but this is not relevant for the correct classification of all prediction samples.
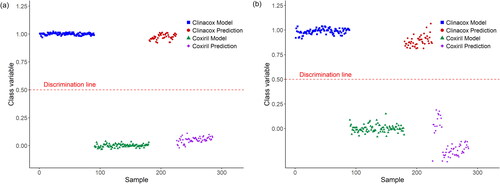
The results from the permutation tests confirmed that both models were significant at the 99% confidence level.
Finally, the comparison showed that the scores from the new DART-HRMS configuration scattered much less compared to the scores from the former configuration, which confirmed the findings from other measurements done in our laboratory with both systems.
Classification of an unauthorised product
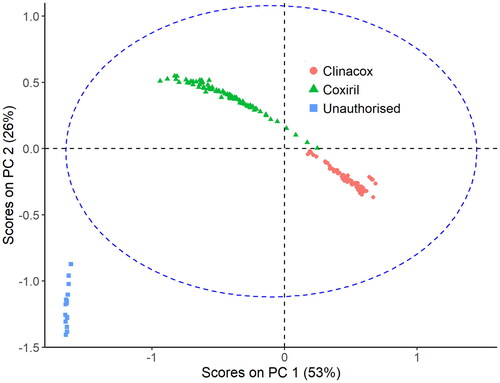
While there are currently exclusively two specific feed additives authorised containing diclazuril as active substance (Coxiril, and Clinacox 0.5%, ), there is another diclazuril containing product, which is not authorised on the EU market. A sample of this product was analysed in negative mode to establish, whether the obtained spectrum would allow for a distinction between the authorised and the unauthorised product. The inspection of the spectra revealed the presence of the active substance with the corresponding accurate mass of 404.97299 and a mass error of 2.9 ppm (). Spectra measured on the samples set of the unauthorised product were subsequently merged with the spectra from the validation samples and subjected to PCA. shows the score plot of PC 2 versus PC 1, confirming that the samples of the unauthorised product form a group in this score plot even outside the 95% confidence level and are therefore well separated from the samples of the authorised feed additives.
Figure 5. Score plot of PC 2 versus PC 1 of the PCA established from the spectra of two authorised feed additives and one unauthorised product. The samples of the unauthorised product are clearly separated from the samples of Clinacox and Coxiril. The dashed ellipse indicates the 95% confidence interval.
Feed additives containing monensin sodium
The coccidiostat monensin sodium is marketed in the EU via three feed additives, namely two forms of Coxidin with the carriers wheat and CaCO3, registered under the same identification number (5 1 701) and Elancoban, registered under a different identification number (E 757). The feed additives contain the active substance at a high level of 25% w/w for the two Coxidin forms and 20% w/w for Elancoban. Given the fact that the two Coxidin forms are marketed under the same identification number, all spectra from the two forms were merged to form one class of feed additives and tested against Elancoban. First, mass spectra in positive MS mode were measured because the active substance is registered in the MS via its protonated molecule ion. The spectra of both feed additives look similar as shown in , indicating that the peaks with the highest relative intensity in both spectra were from the protonated molecular ion and specific isotopologues of monensin sodium. The spectra also showed additional peaks that originate from other ingredients of the different preparation.
Figure 6. Mass spectra measured in positive MS mode of the feed additives Coxidin (a) and Elancoban (b) containing monensin sodium as active substance at high level of 25% m/m and 20% m/m, respectively. In both spectra, the protonated molecular ion of monensin sodium showed the highest relative intensity.
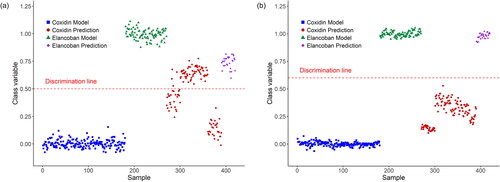
Two PLS-DA models were then created from the spectra measured in positive and negative MS mode respectively and the results from the permutation tests indicated that the established models were significant at the 99% confidence level. However, the PLS-DA plot from the spectra measured in positive MS mode as shown in revealed that a sub-group of the Coxidin validation samples was wrongly classified. Further investigations revealed that all these samples were taken from sachets belonging to batches that were opened in 2014 as specified in the materials and methods chapter of this paper and also belonged to a different batch. This observation may therefore be explained by different physicochemical characteristics of the validation samples belonging to different batches. On the other hand, a batch effect on the grouping of calibration or validations in PLS-DA plots has never been observed before. Moreover, the PLS-DA models discussed in this chapter were established using calibration samples, in which the samples from each feed additive belonged to three different batches and no separation of the samples according to the specific batch could be observed. The improper storage conditions caused by the unsealed sachets may have resulted in partial degradation of the test material. This, in turn, could have led to the misclassification of the sub-group of samples. Additionally, the proximity of the Elancoban validations to the discrimination line suggests the limited discriminatory capability of the PLS-DA model based on spectra obtained in positive MS mode. This conclusion also reflects the similarity of the spectra obtained on both feed additives as shown in . In contrast, the spectra obtained in negative MS mode showed more differences corresponding to a sufficient prediction capability of the PLS-DA model as shown in . Interestingly, also in the corresponding PLS-DA plot, the samples from the unsealed sachets formed a separated sub-group, which is closer to the discrimination line, thus indicating that the test material in the unsealed sachets is different compared to the test material from the same batch in the sealed sachets. We concluded that monitoring the physicochemical characteristics of products in terms of stability could be another application of DART-HRMS and deserves further investigation.
Figure 7. PLS-DA models and prediction for Elancoban versus Coxidin measured in (a) positive and (b) negative MS mode. In positive MS mode, a group of Coxidin samples were wrongly classified as Elancoban. These wrongly classified samples belonged to a batch, where the sachets were already opened for a former study in 2014. The other samples were in sealed sachets and opened prior to the experiments of this study. The prediction of the model from the spectra obtained in negative MS mode showed better results, because correct classification of all prediction samples was achieved. The subgroup of the Coxidin samples closer to the discrimination line was from the already opened sachets used in the former study.
Carotenoids
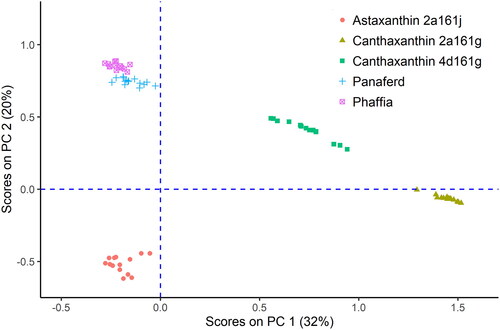
While the selected extraction conditions and optimised DART-HRMS conditions allowed for an unequivocal identification of the active substances, it was also important to check if the five feed additives could be separated by their corresponding identification numbers after the application of multivariate statistics on the MS-spectra. For this purpose, the spectra of all samples from the five different feed additives were subjected to PCA. The score plot of PC 2 versus PC 1 () showed a distinct clustering of the different products, where the samples from astaxanthin 2a161j and the natural products Panaferd and Phaffia rhodozyma where in the negative range of PC 1 and the samples from canthaxanthin 2a161g and canthaxanthin 4d161g were in the positive range of PC 1. The evaluation of the loadings of PC 1 revealed that one of the key m/z values contributing significantly to PC 1 belonged to astaxanthin. This finding corresponds very well with the composition of these products, because Panaferd, Phaffia rhodozyma and astaxanthin 2a161j are rich in astaxanthin, whereas the feed additives in the positive range of PC 1 contain canthaxanthin as the active substance. Furthermore, the scores of the natural products were closer to each other, but both products could still be distinguished by PC 2. These experiments showed that DART-HRMS is also applicable to the characterisation of carotenoid feed additives.
Figure 8. Results from PCA performed on all five carotenoid containing feed additives. The natural products are marked with their names, while the name of synthetic products contains in addition their feed additive identification number. Comparing the loadings of PC 1 with the mass fractions of astaxanthin and canthaxanthin in the products indicates that the allocation of the samples in the plot is due to the higher content of astaxanthin in the natural products and astaxanthin 2a161j.
Conclusions
The safe use of feed additives is based on the principle that only feed additives that have been previously evaluated by EFSA and subsequently authorised by the EC can be placed on the EU market. To enforce this principle effectively, reliable analytical methods are needed for the characterisation of the feed additives and identification of corresponding active substances. In this study, we assessed the applicability of direct analysis in real time mass spectrometry (DART-HRMS) to complex feed additive products containing various coccidiostats or carotenoids. We demonstrated that by combining DART-HRMS with multivariate statistics, it is possible to differentiate between different formulations containing the same active substance. Furthermore, our results suggest that the technique may also be useful in quality control applications, as it can identify samples that have been stored under suboptimal conditions.
Given the deviating physicochemical properties of different feed additives, specific settings for the DART-HRMS system need to be optimised for each group of products. We showed that factorial design is an effective approach for achieving this goal. Moreover, by comparing samples measured with an older DART-HRMS instrument to those measured with our current system, we found that specific experimental conditions can significantly affect the predictive power of statistical models. This finding underscores the need for careful consideration of instrumental parameters when applying statistical models to samples measured with different DART-HRMS systems.
Our study demonstrates that DART-HRMS is a practical and effective tool for characterising authorised feed additives in the EU. By providing additional information on the composition of these products, DART-HRMS can complement the existing repository of feed additive samples maintained by the EU Reference Laboratory for Feed Additives. Future work will aim to expand the scope of this project by analysing feed additives that have not been measured yet with the final objective to create a mass spectrometry database of feed additives authorised in the EU.
Acknowledgements
We are grateful to Mostafa Chedin and Federica Serano for technical support.
Disclosure statement
No potential conflict of interest was reported by the authors.
References
- Chambers MI, Musah RA. 2022. DART-HRMS as a triage approach for the rapid analysis of cannabinoid-infused edible matrices, personal-care products and Cannabis sativa hemp plant material. Forensic Chem. 27:100382. doi: 10.1016/j.forc.2021.100382.
- Cody RB, Laramée JA, Dupont DH. 2005. Versatile new ion source for the analysis of materials in open air under ambient conditions. Anal Chem. 77(8):2297–2302. doi: 10.1021/ac050162j.
- [EC] European Commission. 2005. Commission Regulation (EC) No. 378/2005 of 4 March 2005 on detailed rules for the implementation of Regulation (EC) No. 1831/2003 of the European Parliament and of the Council as regards the duties and tasks of the Community Reference Laboratory concerning applications for authorisations of feed additives. Off J Eur Union. L59:8–15.
- [EC] European Commission. 2010. Commission Regulation (EU) 1118/2010 of 2 December 2010 concerning the authorisation of diclazuril as a feed additive for chickens for fattening. Off J Eur Union. L317:5–8.
- [EC] EURL-FA Feed Additives. 2014. Evaluation report on astaxanthin-rich Phaffia rhodozyma KBW 10061 (AJ 14971) [Internet] [assessed 2023 Jan 31]. https://joint-research-centre.ec.europa.eu/publications/fad-2013-0032_en.
- [EC] European Commission. 2023. European Union Register of feed additives [Internet] [assessed 2023 Apr 23]. https://ec.europa.eu/food/food-feed-portal/screen/feed-additives/search.
- [EU] European Union. 2003. Regulation (EC) No. 1831/2003 of the European Parliament and the Council of 22 September 2003 on additives for use in animal nutrition. Off J Eur Union. L268:29–43 as last amended by Commission Regulation (EU) 2015/2294.
- [EU] European Union. 2009. Regulation (EC) No. 767/2009 of the European Parliament and the Council of 13 July 2009 on the placing on the market and use of feed, amending European Parliament and Council Regulation (EC) No. 1831/2003 and repealing Council Directive 79/373/EEC, Commission Directive 80/511/EEC, Council Directives 82/471/EEC, 83/228/EEC, 93/74/EEC, 93/113/EC and 96/25/EC and Commission Decision 2004/217/EC. Off J Eur Union. L229:1–28 as last amended by Commission Regulation (EU) 2015/2294. Off J Eur Union. L220:1–28.
- Fiorino GM, Losito I, De Angelis E, Arlorio M, Logrieco AF, Monaci L. 2019. Assessing fish authenticity by direct analysis in real time-high resolution mass spectrometry and multivariate analysis: discrimination between wild-type and farmed salmon. Food Res Int. 116:1258–1265. doi: 10.1016/j.foodres.2018.10.013.
- Gross H. 2014. Direct analysis in real time – a critical review on DART-HRMS. Anal Bioanal Chem. 406(1):63–80. doi: 10.1007/s00216-013-7316-0.
- Martínez-Villalba A, Vaclavik L, Moyano E, Galceran MT, Hajslova J. 2013. Direct analysis in real time high-resolution mass spectrometry for high-throughput analysis of antiparasitic veterinary drugs in feed and food. Rapid Commun Mass Spectrom. 27(3):467–475. doi: 10.1002/rcm.6466.
- Massaro A, Negro A, Bragolusi M, Brunella M, Tata A, Suman M, Piro R. 2021. Oregano authentication by mid-level data fusion of chemical fingerprint signatures acquired by ambient mass spectrometry. Food Control. 126(2021):108058. doi: 10.1016/j.foodcont.2021.108058.
- Omar J, Boix A, von Holst C. 2015. Differentiation of coccidiostats-containing feed additives by mid and near infrared microscopy. Food Addit Contam Part A Chem Anal Control Expo Risk Assess. 32(9):1464–1474. doi: 10.1080/19440049.2015.1075177.
- Rýdlová L, Prchalová J, Škorpilová T, Rohlík B-A, Čížková H, Rajchl A. 2020. Evaluation of cocoa products quality and authenticity by DART/TOFMS. Int J Mol Sci. 454:116358. doi: 10.1016/j.ijms.2020.116358.
- Tata A, Massaro A, Marzoli F, Miano B, Bragolusi M, Piro R, Belluco S. 2022. Authentication of edible insects’ powders by the combination of DART-HRMS signatures: the first application of ambient mass spectrometry to screening of novel food. Foods. 11:5–11. doi: 10.3390/foods11152264.
- Tsagkaris AS, Hrbek V, Dzuman Z, Hajslova J. 2022. Critical comparison of direct analysis in real time orbitrap mass spectrometry (DART-Orbitrap MS) towards liquid chromatography mass spectrometry (LC–MS) for mycotoxin detection in cereal matrices. Food Control. 132:108548. doi: 10.1016/j.foodcont.2021.108548.
- Vincent U, Serano F, von Holst C. 2017. Development and validation of a multi-analyte method for the regulatory control of carotenoids used as feed additives in fish and poultry feed. Food Addit Contam Part A Chem Anal Control Expo Risk Assess. 34(8):1285–1297. doi: 10.1080/19440049.2017.1315651.
- von Holst C, Chedin M, Kaklamanos G, Alonso Albarracín D, Vincent U. 2022. DART mass spectrometry: a rapid tool for the identification of feed additives containing coccidiostats as active substances. Food Addit Contam Part A Chem Anal Control Expo Risk Assess. 39(3):475–487. doi: 10.1080/19440049.2021.2012598.
- von Holst C, Robouch P, Bellorini S, González de la Huebra MJ, Ezerskis Z. 2016. A review of the work of the EU Reference Laboratory supporting the authorisation process of feed additives in the EU. Food Addit Contam Part A. 33:66–77.
- Westerhuis JA, Hoefsloot HCJ, Smit S, Vis DJ, Smilde AK, van Velzen EJJ, van Duijnhoven JPM, van Dorsten FA. 2008. Assessment of PLSDA cross validation. Metabolomics. 4(1):81–89. doi: 10.1007/s11306-007-0099-6.