Abstract
Dietary exposure assessments have been performed for nitrites, phosphates, erythorbic acid, and sodium erythorbate in processed meat in Poland. The exposure has been estimated based on the maximum level of use of additives contained in Regulation - tier 2 and the concentration of additives in processed meat - tier 3, additionally for nitrites. Daily intake was estimated using 24-h recall, repeated three times. Exposure analyses were correlated with the frequency of occurrence of food additives based on label analysis (tiers 2a and 3a). The mean nitrite intake from processed meat at tier 2 was 0.1 mg/kg bw (143% ADI), 0.08 mg/kg bw (118% - ADI) at tier 2a, 0.03 mg/kg bw (43% - ADI) at tier 3, and 0.026 mg/kg bw (37% - ADI) at tier 3a. The mean intakes of phosphate and erythorbic acid/sodium erythorbate from processed meat were 3.26 and 0.54 mg/kg bw (8.2% and 9% - ADI), respectively at tier 2. None of the respondents exceeded the ADIs for phosphates or erythorbic acid/sodium erythorbate. In contrast, nitrite consumption is of great concern because of significant ADI exceedances, particularly among young children.
Introduction
Analyses of global data show that meat consumption has continuously increased from approximately 30 kg per capita per year in 1980 to 41 kg per capita per year in 2005 (Rohrmann and Linseisen Citation2016), and to approximately 47 kg per capita per year in 2013 ([FAO] Food and Agriculture Organization of the United Nation 2013). Then there was a decrease in its consumption and in 2020 ([FF] FoodFakty 2021), the average global meat consumption was 33.7 kg per capita. However, according to FAO forecasts, global meat consumption per capita is projected to increase to 35.4 kg in 2030 (FAO Citation2021). This is due to both the steady increase in the production and consumption of meat and processed meat products in developing countries and stagnation in this respect observed in developed countries (Speedy Citation2003; Thornton Citation2010; Godfray et al. Citation2018).
Meat is processed to extend the shelf life of food, as well as to improve its organoleptic characteristics such as taste, colour, texture, and consistency (Rohrmann and Linseisen Citation2016). From 1990–2010, the mean global consumption of processed meat remained stable at 13.7 grams per capita per day. The amounts of consumption differed considerably depending on the region of the world, ranging from 4.1 g per capita per day in East Asian countries and 4.4 g per capita per day in North African and Middle Eastern countries to 32.2 g per capita per day in Central European countries, 36.4 g per person per day in North America, and 44.4 g per person per day in Central Latin American countries. Among the countries with the highest levels of processed meat consumption, Poland was in third position, after Panama and Latin American countries, with consumption reaching 48.8 g per capita per day (Micha et al. Citation2015). This is influenced by consumer preferences that result from cultural, social, and economic differences and habits (Speedy Citation2003; Godfray et al. Citation2018).
Additives play an important role in meat processing, and are used in processed meats for safety, technological reasons as well as for increasing the shelf life of the products. This study estimated the intake of three groups of food additives (nitrites, phosphates, and sodium erythorbate and erythorbic) used in meat products and meat preparations, i.e. processed meat, consumed by adults and children in Poland.
Materials and methods
The assessment of risk to nitrites, phosphates, and sodium erythorbate and erythorbic acid from meat products and meat preparations (division according to the definitions provided in Regulation No. 853/2004 (EC) ([EC] European Commission Citation2004)) in Poland was carried out comparing the acceptable daily intake (ADI) (established by the European Food Safety Authority (EFSA) Panel) with the exposure calculated as the maximum levels of food additives that can be used in food categories 8.2 (Meat preparations) and 8.3 (Meat products) (EU 2008) and multiplied by the mean intake of the food representing the abovementioned categories over three days and divided by body weight (tier 2). In the case of nitrites, these values were then correlated based on the frequency of occurrence of a particular food additive in specific assortment groups (tier 2a). Additional calculations were made for tier 3, including the actual concentrations of nitrites found in cured meat products reported in the literature, along with their occurrence frequencies (tier 3a) and considering 5% and 20% conversion (tiers 3b and 3b’, respectively).
Occurrence frequency
The assortments belonging to food categories 8.2 and 8.3 (EU 2008) were found in selected stores, and the food additives used in their production were identified based on the labels.
Sampling was carried out in the following retail chain stores: Biedronka (Jerónimo Martins Polska), Lidl (FRF Beteiligungs GmbH), Eurocash (a group of associated stores such as Lewiatan, Groszek, and Delikatesy Centrum), and Auchan and Kaufland chain stores, i.e. those for which the total revenues for 2018 represented the largest market share ([MF] Ministry of Finance and Poland Citation2019). The Tesco chain store was excluded from the analysis in favour of the Kaufland chain store when the company announced the closing of its retail markets and withdrawal from Poland.
Seventeen Polish cities were selected for the study, including 11 with the largest populations, i.e. more than 250,000 inhabitants (Statistics Poland Citation2018), as well as six smaller cities.
The material for the analysis comprised photos of item labels of meat preparations and meat products taken in randomly selected supermarkets as representative of the above chain stores in each of the above-mentioned cities, provided that the chain stores that qualified for the study had their branches there. The analysis included 12,333 product labels available on the shelves of 75 stores in 17 Polish cities on the survey days.
Based on the definition in Regulation No. 853/2004 and assortment descriptions on the labels and images of the products, the assortments were divided into two categories: meat preparations and meat products ([EC] European Commission Citation2004). The analysis identified 1967 unique assortments that belonged to these two categories.
Due to the many products with different characteristics classified into the second category, meat products were further divided into four groups (smoked meats, sausages, offal meat, and other meat products) due to the different nature of the products and the production technology. Thus, these four groups and the meat preparations category allowed us to create five main groups for the analysis. To better assess consumption, the five main groups were further divided into 20 assortment groups consisting of products with similar images and characteristics. A detailed breakdown of selected products is presented in .
Figure 1. Division of selected processed meat products into groups.
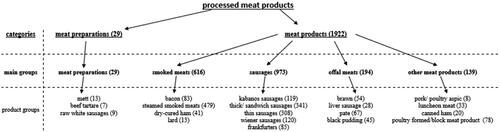
The products were assigned to 20 assortment groups. Owing to the impossibility of assigning 16 products to specific assortment groups, they were excluded from further analyses. The frequency of occurrence of food additives was calculated in each group (Diouf et al. Citation2014). Because of the wide variety of products in the assortment groups, some were divided into subgroups, and the division criterion was the product’s name. Thus, a total of 55 subgroups were established for the analysis.
Consumption amount
Information on the consumption of products belonging to each of the 55 subgroups was collected based on data obtained from a 24-h recall. The respondents reported the amounts and types of processed meat they had consumed throughout the previous day by answering 78 questions included in a dietary questionnaire, which was repeated three times to obtain information on inter-individual variability (Löwik Citation1996; Salvador Castell et al. Citation2015). The survey was prepared specifically for research purposes in the electronic version through Microsoft Forms, so it was available online. According to the survey instructions, data entry for groups of children and the elderly was entered by their parents or other household members. To ensure anonymity in the first question, the respondents were asked to provide a self-created login that allowed them to link subsequent answers. The next six questions referred to the sociodemographic characteristics of the respondents, i.e. their weight, sex, age, educational level, place of residence,. Each respondent was asked to answer 20 questions regarding the selected assortment groups. In the case of an affirmative answer indicating the consumption of an item from a particular group, the respondent was asked one to three questions detailing the amount consumed in grams and, in selected cases, the subgroup. The questionnaire also included an open-ended question with the option to provide information on the consumption of assortments that were not classified into any of the above 20 groups. The portion size was estimated based on photos showing examples of products belonging to each of the surveyed groups, including a certain weight, considering several variants of the serving portion size. The presentation of the products and 13 of the 21 photos included in the survey were taken from the Szponar et al. (Citation2020) publication ‘Album fotografii produktów i potraw’ (a photo album presenting products and dishes). The authors took the remaining eight photographs.
The adult respondents invited to participate in the survey were students, friends, or families of students and academic staff; employees of local veterinary inspectorates and agricultural cooperatives; and persons actively engaged in sports, i.e. participants of two running events. Young people were recruited through non-government organisations for children aged 7–18 years. Those in the oldest age group were recruited from among the household members of adults participating in the survey and from those meeting at a local senior’s club. Answers to questions referring to younger children were provided by their parents, participants in the survey, or parents of children belonging to two sports clubs. Information regarding participation in the survey was also posted on social media. The analyses included only respondents who completed three full 24-h recalls, i.e. 632 out of the 847 who took part in the survey.
Exposure to nitrites, phosphates, and sodium erythorbate and/or erythorbic acid
Based on data on meat product supply, combined with values for the maximum levels of use of food additives in correlation with their occurrence frequency in the assortment groups (tier 2a) (Diouf et al. Citation2014) or absence (tier 2) ([EC] European Commission Citation2001), we were able to estimate the dietary exposure to nitrites, phosphates, and sodium erythorbate and/or erythorbic acid for mean and high-level consumers by age and gender.
Dietary exposure to food additives at tier 2 was calculated by multiplying the permitted levels for nitrite, phosphates, and sodium erythorbate and/or erythorbic acid, respectively, for each assortment group by the amount of food consumed from each assortment group. The values from all the groups were then summed and further divided by each person’s body weight to obtain the individual total daily exposure. The daily exposure estimates were averaged over a period of three days (i.e. the duration of the study), which allowed us to determine the individual mean exposure. The calculations were based on the individual weight of each respondent, meaning that for those who did not report their weight, the weight estimation was based on the mean weight of individuals of the same sex belonging to the same age group.
For tier 2, it was assumed that a food additive was used for all assortments in the group. In subsequent analyses, it was considered that not all manufacturers apply every food additive approved for use in food category 8. Therefore, based on the analyses, the calculations were adjusted for the frequency of food additive occurrence in specific assortment groups (tier 2a). However, in the case of phosphates, and sodium erythorbate and/or erythorbic acid, the analysis of tier 2 showed that exposure to them is significantly below the ADI; therefore, the tier 2a analysis was waived for those food additives.
Considering the numerous ADI exceedances for nitrites at tiers 2 and 2a, to properly estimate the exposure, it was necessary to analyse their concentrations based on the available literature data on nitrite levels in processed meat (Michalski Citation1996a, Citation1996b, Citation1997a, Citation1997b, Citation1997c, Citation1998; Skrajnowska et al. Citation2004). Details on nitrite content in meat products are provided in Appendix 1. The concentration was expressed in milligrams per kilogram of product, which was multiplied by each respondent’s mean intake in grams per day and divided by their body weight in kg (tier 3). In further analyses, these values were adjusted for the frequency of occurrence of the food additive in specific assortment groups (tier 3a). The analysis also included the conversion of nitrates into nitrites, which mainly occurs in the oral cavity. It is estimated that typically 5%–7% of ingested nitrates are converted to nitrites by bacteria normally found in the oral cavity. However, this percentage can increase significantly to 20% in individuals with high conversion rates ([FAO.WHO] Food and Agriculture Organisation of the United Nations. World Health Organization 2003; [EFSA] European Food Safety Authority 2008). In order to calculate the conversion value of nitrates to nitrites, dietary exposure to nitrates from meat products had to be estimated. It was done by multiplying the permitted levels of nitrate for each assortment group by individual consumption data. The values from all the groups were then summed and further divided by body weight. These exposure estimates were then averaged over three days. Nitrate to nitrite conversion factors of 5% and 20% were applied in the calculations for tiers 3b and 3b’, respectively.
Factors that may affect exposure to a) nitrites, b) phosphates, and c) sodium erythorbate and erythorbic acid were also statistically assessed. The exposure to all three additives was calculated for tier 2 and analysed separately. In addition, the exposure of nitrites to the tiers 2a, 3 and 3a was analysed.
Eight generalised linear models were planned to be built, and in each of them, the dependent variable was exposure to a given food additive calculated as tier 2, tier 2a, and additionally on tier 3 and tier 3a for nitrites, expressed in mg/kg of the respondent’s body weight per day. Finally, four generalised linear models were built only for nitrites on tier 2, 2a, and tier 3, 3a. Because the exposure to phosphates and, sodium erythorbate, and erythorbic acid were far below the ADI, building models for them was abandoned.
Four explanatory variables were included in each model: sex, age (age group), place of residence, and education. In addition, the models included the interaction of sex and age with the other variables: sex × age, sex × education, sex ×place of residence, age × education, and age ×place of residence. The composition of the final model was determined by model selection based on the value of the AIC (Akaike Information Criterion), where all variants of the model (including the null model) were considered (Burnham and Anderson Citation2002). The model with the lowest AIC value was selected.
For nitrites, we developed two binary models in which the dependent variable was a comparison of the additive consumed to a reference value, that is, each case where consumed additive exceeded the norm was marked as 1 and each case where consumed additive did not exceed the norm was marked as 0. All the explanatory variables mentioned above (and interaction variants) were included. Because of the number of positive cases, the models were developed only for tiers 2 and 2a. Model selection was performed in the same manner.
Results
Occurrence frequency
More than 83.4% of the processed meat products contained nitrites (1628 products), over 36.1% contained phosphoric acid or phosphates (704 products), and approximately 39.8% contained erythorbic acid and/or sodium erythorbate (777 assortments). The most common food additive found in processed meat products available on the Polish market is sodium nitrite (E250). The frequency of nitrite occurrence in each group was estimated based on an analysis of the labels collected for the study. Significant differences were observed between the individual groups, and 100% of the assortments belonging to the groups of aspic and mett (raw-meat sausage) contained nitrites. A very high level of occurrence frequency of nitrites was also observed for bacon, brawns, and luncheon meat. However, the results also showed that it is possible to produce meat products without nitrites. The abovementioned food additives were least frequently used in raw white sausages (only one from nine products identified on the market contained nitrites), as well as black puddings, pâtés, and lard.
Phosphates, i.e. phosphoric acid (E 338), sodium phosphates (E 339), potassium phosphates (E 340), calcium phosphates (E 341), magnesium phosphates (E 343), diphosphates (E 450), triphosphates (E 451), and polyphosphates (E 452), are approved for use in food category 8.3 – meat products, whereas it is forbidden to use them in meat preparations, apart from certain exceptions. None of the assortments identified during the analysis were among the exceptions specified in Regulation 1333/2008 ([EC] European Commission Citation2008). Food additives are most often used in the production of canned ham, aspics, and luncheon meat. In contrast, none of the manufacturers used them to produce lard or dry-cured ham.
Erythorbic acid and sodium erythorbate are permitted for use in food category 8.3, i.e. meat products; however, they are not authorised for use in food category 8.2, i.e. meat preparation. An analysis of the data presented on the allowed to estimate the frequency of occurrence of E315 and/or E316 in particular assortment groups. They were found to occur far less frequently in meat products than nitrites, and in the case of 627 assortments, the use of erythorbic acid and/or sodium erythorbate in production was associated with the use of nitrites approximately 80.7% of processed meats containing E315 and E316 also contained sodium or potassium nitrite. The highest frequencies of sodium erythorbate and/or erythorbic acid were found in steamed smoked meat, luncheon meat, and aspics. The lowest frequency of their use was observed in the black pudding, lard, and dry-cured ham groups.
The detailed data on the occurrence frequency of the three groups of additives discussed are presented in .
Table 1. Occurrence frequency of nitrites (E249-E250), phosphates (E 338–341, E 343, and E 450–452), erythorbic acid (E315) and sodium erythorbate (E316) in different processed meat assortment groups from Polish market.
Consumption
Of the 632 respondents who completed the questionnaire three times, 50 declared that they were vegetarians or did not eat meat during the survey period. The mean daily consumption of meat products and meat preparations per capita in Poland ranges from 3 to 615 g/day, and these values vary by age group ().
Table 2. Processed meat consumption by gender and age groups.
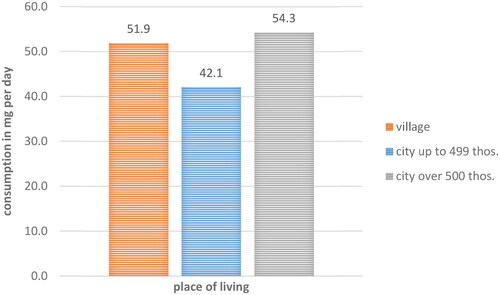
Higher consumption of processed meat was found in all male age groups, with the exception of the group of children under the age of six, for which it was higher among females. The group of adolescents aged 12–17 years was characterised by higher consumption than that of younger children and adults up to 65 years of age. The group with the highest mean consumption of processed meat was adults aged >65 years. The survey indicated that, compared to other groups, Polish people with a high school education consumed less meat, as did those living in cities with up to 500,000 residents. The detailed data are shown in and .
Figure 2. Consumption of processed meat by the level of education.
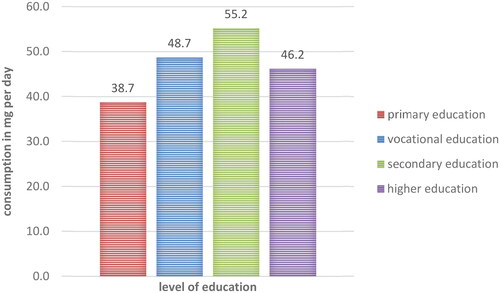
Figure 3. Consumption of processed meat by place of residence.
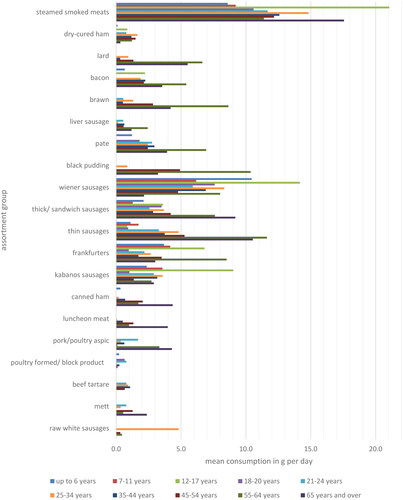
The group that included steamed smoked meat was the most commonly consumed type of cold cut, accounting for approximately 26.5% of total processed meat consumption. Wiener sausages accounted for approximately 14.5% of processed meat consumption, whereas thin and thick sausages accounted for 9.3% and 7.7%, respectively. Meat preparations were consumed the least frequently, and their share ranged from 0.15%–1.5%, and together, they did not exceed 3% of the total processed meat consumption. The results are summarised in .
Figure 4. Mean consumption of assortments in particular groups by age.
Exposure to nitrites
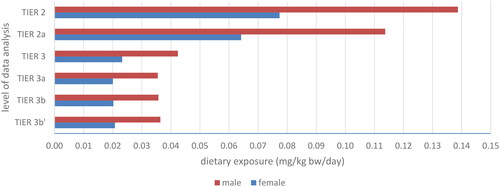
Based on the collected data, the mean intake of nitrites from processed meat was estimated to be 0.1 mg/kg body weight (i.e. 143% of the ADI) for tier 2 and 0.08 mg/kg body weight (i.e. 118% of the ADI) for tier 2a. After taking into account historical data on nitrite concentrations in each assortment group, the exposure was 0.03 mg/kg bw (i.e. 43% of the ADI) at tier 3 and 0.026 mg/kg bw (i.e. 37% of the ADI) at tier 3a. A 5% conversion of nitrates in processed meat did not result in any changes in the level of exposure. For consumers with high conversion (20%), the mean nitrite consumption increased by less than 1%. Therefore, the effect of converting nitrates from processed meat to nitrites was considered insignificant and omitted from further analyses. The study showed marked differences in nitrite consumption between men and women, with the former consuming nearly twice as much nitrite as the latter, regardless of the assessment level. The detailed data are shown in . A higher percentage of ADI exceedance was observed in men.
Figure 5. Dietary exposure to nitrites from processed meat products by gender.
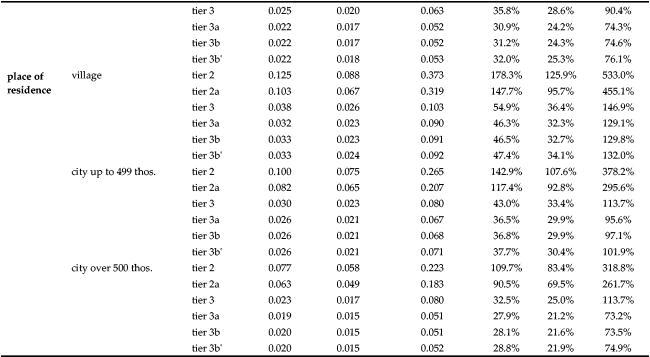
present a summary of the results of the mean daily consumption, the median of intake (p50) and nitrite consumption for high-level consumers (p95) in mg/kg bw/day, and the percentage of the ADI by age group, educational level, and place of residence.
Table 3. Dietary exposure to nitrites from processed meat products by age groups, education level and place of residence.
In total, 53.48% of consumers exceeded the ADI of nitrites after consuming only processed meat products at tier 2 and 41.3% at tier 2a; however, at tiers 3, 3a, and 3b, the exceedances were lower, ranging from 4.9% to 8.2%. Among those exceeding the ADI at tier 3, the highest percentages were found in children aged 0–6 years (43.3%). This group was followed by the elderly in advanced old age over 65 years (12.9%), older adults aged 55–64 years (21.6%), and children aged 7–11 years (10%). Additionally, more individuals with primary and vocational education than those with secondary or higher education exceeded the ADI score.
Irrespective of the tier (tier 3, or 3a), sex, age, education, and place of residence had a significant impact on the exposure to nitrites per kg of body weight. Regarding interactions, education in connection with age and sex also significantly affected exposure to nitrite. However, the place of residence or level of education did not significantly affect the exceedance of the nitrite ADI. Sex and age were the main factors influencing ADI exceedance.
The detailed data on dietary exposure to nitrites from processed meat products at tiers 2, 2a, 3b, 3b’ and participant variables by the level of intake at tiers 2 and 2a are presented in Appendix 2, while for tiers 3 and 3a in .
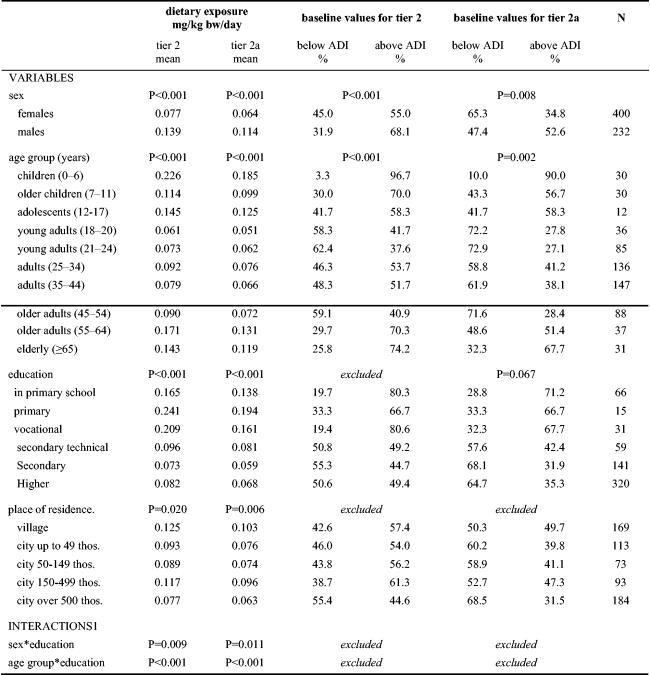
Table 4. Dietary exposure to nitrites from processed meat products (in mg/kg body weight/day) and participant variables by the level of intake (above and below the ADI) at tiers 3 and 3a. The p-values indicate the significance level of a given variable (or interaction) in the model, Excluded – variable excluded as a result of selection (only interactions included in at least one of the highest ranked models are presented).
Exposure to phosphates
Based on individual consumption data and maximum levels of use specified in the regulations ([EC] European Commission Citation2008), the mean intake of phosphates from processed meat at tier 2 was estimated to be 3.26 mg/kg bw (8.2% of the ADI). Furthermore, none of the respondents exceeded the ADI levels for phosphate based on their individual consumption. The differences in dietary exposure to phosphates according to age, educational level, and place of residence are shown in .
Table 5. Dietary exposure to phosphates from meat products by age group, educational level and place of residence.
Exposure to sodium erythorbate and/or erythorbic acid
Based on the collected data on individual consumption and maximum permitted levels of use, the mean exposure of sodium erythorbate and/or erythorbic acid from processed meat at tier 2 was estimated to be 0.54 mg/kg body weight (9% of the ADI). Moreover, none of the respondents exceeded the ADI levels for sodium erythorbate or erythorbic acid, based on their individual consumption. The differences in dietary exposure to the aforementioned antioxidants that depended on age, educational level, and place of residence are presented in .
Table 6. Dietary exposure to erythorbic acid and/or sodium erythorbate from meat products by age group, educational level and place of residence on tier 2.
Discussion
Consumption
The approach using a 24-h recall repeated three times provides a more accurate estimate of the intake of individual assortments than the frequently applied budget method (De Keyzer et al. Citation2011). This is because the budget method is based on assumptions about physiological demand for energy and fluids as well as the energy density of food products, rather than examining individual consumption, which results in inflated estimates of the theoretical maximum daily intake (TMDI) (Douglass et al. Citation1997). Moreover, the 24 h recall can be considered as the best method to get estimating usual dietary intakes at the population level (Biró et al. Citation2002).
The mean intake of processed meat among all respondents estimated in this study was 48.2 g/day, which is similar to the values reported by Micha et al. (Citation2015) based on 2010 data. The estimated mean food intake among adult respondents in Poland was approximately 47.8 g per day, which is approximately 48% higher than the estimated food intake of the Belgian population aged > 15 years. Among high levels consumers of processed meat, Polish respondents were characterised by nearly 2.5 times higher consumption than Belgians (Temme et al. Citation2011). Based on these findings, it can be concluded that despite the stated intention to reduce the amount of processed meat consumption expressed by the Polish population (Szczebyło et al. Citation2022), Poland’s mean intake remains consistently high. This is related, among other factors, to the particular cultural tradition of eating meat and its processed meat products among the Polish people (Szczebyło et al. Citation2022). The survey also showed that consumption depended on socioeconomic factors such as age, sex, and educational level, as well as the size of the city of residence. However, the latter factor played a minor role. It should also be emphasised that the differences in the estimated level of intake may depend not only on the methods used to assess the consumption amount but also on the timing of the survey (Lee Citation2018). In our study, we used averaged data on consumption over three days, similar to studies conducted in Finland among children (Suomi et al. Citation2016). Shorter studies (based on a one-day period) have been conducted in Fiji (Chetty et al. Citation2019), and Belgium, Greece, and Serbia (two-day study period studies) (Temme et al. Citation2011; Kotopoulou et al. Citation2022; Milešević et al. Citation2022). Studies covering longer periods have been conducted in Sweden (four days) (Larsson et al. Citation2011) and in Estonia, Denmark, and France (seven days) (Reinik et al. Citation2005; Leth et al. Citation2008; Menard et al. Citation2008). These differences in survey durations may make it difficult to directly compare the mean intakes reported in particular countries.
This study estimates the dietary exposure to three groups of food additives in meat preparations and meat products sold on the Polish market.
Exposure to nitrites
The results of this study show that a part of the Polish population may be at risk of exceeding the ADI for nitrites from processed meat products alone. Approximately 43.3% of children aged 1–6 years exceeded the ADI at tier 3 and 23.3% at tier 3a, i.e. considering the occurrence frequency of nitrites in particular assortment groups, while in Serbia exceedances were found in 9.3% of children aged 1–9 years (Milešević et al. Citation2022). However, in Sweden, after considering the conversion of nitrates to nitrites, only 12% of 4-year-olds exceeded the ADI for nitrites (Larsson et al. Citation2011). This shows that Polish children, excluding exposure related to the conversion of nitrates to nitrites, had 2–3.5 times more frequent exceedance of the ADI.
Studies conducted in Estonia revealed exceedances of the ADI in 40% of children aged 1–16 years in 2000–2001, in 29% of children in 2003–2004 (Reinik et al. Citation2005), and only 3% of children in 2013 and 2014 (Elias et al. Citation2020), whereas this study found exceedances in 23.6% of children aged up to 17 years at tier 3 and 11.1% of children at tier 3a. It should be noted, however, that in this experiment, for calculations on tier 3, the nitrite concentration was assumed for each assortment group based on data available in the literature (Michalski Citation1996a, Citation1996b, Citation1997a, Citation1997b, Citation1997c, Citation1998; Skrajnowska et al. Citation2004). The mean nitrite concentration in processed meat for all assortment groups was 42.4 mg/kg (for the years 1993–2004), which is over two times higher than the level of nitrite used at a similar time in Estonia, i.e. approximately 20 mg/kg of product (Reinik et al. Citation2005). They were also significantly higher than the levels found in Denmark, which ranged from 6 to 20 mg/kg of the product (Leth et al. Citation2008).
Based on the present study, the mean exposure to nitrites from meat products alone among children aged 1–6 years was 95% of the ADI (tier 3) and 81% (tier 3a). In the United States, it ranged between 0.1 to 30% of the ADI in the group of children aged 2 years and 0.1 to 86% of the ADI in the group of children aged 2–5 years (Lee Citation2018), Whereas, in Sweden, nitrite intake from cured meat in a group of 4-year-olds accounted for about 18% of the ADI (Larsson et al. Citation2011), and in Serbia, less than 30% of the ADI (Milešević et al. Citation2022). In contrast, nitrite exposure in Estonian children aged 1–6 years in 2004 was approximately 50% of the ADI (Reinik et al. Citation2005), and in 2014, it was approximately 25% (Elias et al. Citation2020). In Denmark, the mean intake is even lower, i.e. 16%–19% of the ADI (Leth et al. Citation2008). In a previous Polish study, total exposure to nitrites from all food categories was 88% (Wawrzyniak et al. Citation2003), In Sweden, exposure to nitrites, after including conversion, increased from 18% to 63% (Larsson et al. Citation2011). The results of this study indicate that exposure to nitrites from meat products and meat preparations alone in children aged < 6 years remains at very high levels, which, combined with exposure from other food categories and the conversion of nitrates to nitrites from water and vegetables, can lead to very high ADI exceedances. These data are alarming because the exposure at tiers 3 and 3a from 175% and 146%, respectively. Additionally, the obtained results were compared with the findings on dietary exposure to nitrites provided by the European Food Safety Authority (EFSA) (Mortensen et al. Citation2017). The average data from 15 European Union countries indicated that the mean exposures in the two groups of children (aged 1–3 and 3–9 years) were approximately 21.5% and 22.9%, respectively, which is approximately four times lower than that in Poland.
In Poland, in a group of children aged under 6 years of age, the assortment group that contributed the most to nitrite exposure was sausages (54%) and smoked meats (43%). Offal meat and other meat products accounted for the remaining 3%. Among the sausage groups, the highest values were observed for the subgroups of frankfurters and wiener sausages (11% and 28.5%, respectively), and kabanos sausages (8.2%). These figures are consistent with studies conducted in the United States, Estonia, and Denmark, where sausages were the main source of nitrites, accounting for 64%, 49%, and 42% of the exposures, respectively (Leth et al. Citation2008; Lee Citation2018; Elias et al. Citation2020). In Estonia (Reinik et al. Citation2005; Elias et al. Citation2020), and Finland (Suomi et al. Citation2016), similar to Poland, frankfurters and wiener sausages were important sources of nitrites among young children. In Serbia, the products that contributed the most to nitrite exposure were sausages and luncheon meat (Milešević et al. Citation2022), while exposure from luncheon meat among children in Poland was close to zero.
In the general population of children, similar to young children, the products that accounted for the highest exposure were sausages (53%) and smoked meats (45%). However, a decline in exposure to sausages (45%) in favour of smoked meats (54%) (Lee Citation2018), which occurred among American children, was not observed. However, such a distribution was identified among Polish adults, where exposure to nitrites from the consumption of meat products hovered at 46% (smoked meats), 37% (sausages), 7.5% (formed/block meat products), 6.5% (offal), and 3% (meat preparations).
In Belgium, in a group aged 15 years or older, nitrite exposure from processed meat accounted for approximately 6% of the ADI (Temme et al. Citation2011) compared with the mean intake among Polish adults, which was as much as 40% of the ADI at tier 3 and 34% at tier 3 A. By contrast, among adults in New Zealand, the mean daily intake of exogenous nitrites, including food and water, has been reported to be approximately 13% of the ADI (Thomson et al. Citation2007), whereas in Denmark it is even lower, at approximately 5% of the ADI (Leth et al. Citation2008). A study in Fiji showed that the country’s adult population is characterised by a very high level of meat and processed meat consumption, which results in a high mean nitrite exposure of 385% of the ADI (Chetty et al. Citation2019). This means that it is approximately ten times higher than that in Poland, with the consumption of meat and processed meat that is two times higher. These findings also suggest that nitrite concentrations in processed meat in Fiji are significantly higher than those observed in Poland.
Details of exposure to nitrites from processed meat products for tiers 2 and 2a and also the relationship between the amount of exposure at tiers 2 and 3 in Poland and other European countries are provided in Appendix 2.
In France, there was a decrease in the estimated dietary exposure to nitrites in studies over several years, which initially ranged from 0.02 to 0.05 mg/kg/day in adults and from 0.04 to 0.09 mg/kg/day in children and 0.0008 mg/kg/day (Menard et al. Citation2008), then was lowered to 0.002 mg/kg/day in adults and 0.0014 mg/kg/day to 0.004 mg/kg/day in children (Bemrah et al. Citation2012). A similar trend was observed in studies conducted in Estonia, where exposure among children over a 10-year period nearly doubled (Reinik et al. Citation2005; Elias et al. Citation2020). This decrease can be explained by a decline in the consumption of meat products combined with a reduced level of nitrites in these products (Elias et al. Citation2020).
It is difficult to compare studies on exposure to nitrites conducted in Poland and other countries because the methodologies used to estimate consumption, exposure, and target groups are different. Moreover, some analyses estimated exposure to nitrites as food additives only, whereas others focused on total dietary exposure to these substances (Menard et al. Citation2008). The contrasts in exposure observed in particular countries reflect cultural differences in dietary preferences, meat processing methods, and the level of use of nitrites per kilogram of meat, which may consequently lead to significant differences in the exposures to nitrites between these countries (Lee Citation2018). An earlier study conducted in Poland by Anyzewska and Wawrzyniak (Citation2014) estimated the exposure to nitrites and nitrates to be half of the ADI for these food additives, whereas the present study has revealed considerable ADI exceedances. These discrepancies may have been caused by the different survey methodologies used in the two experiments. The previous study was based on the amount of consumption estimated involving mean statistical data for the years 2006–2012 rather than data obtained from individual respondents.
It can be presumed that such a high exposure to nitrites from processed meats, and thus the high frequency of their use in food, is related to their antibacterial and food-preserving effects. Nitrites inhibit the growth of bacteria such as Clostridium botulinum, and thus the production of toxins ([EFSA] European Food Safety Authority Citation2003, 2010; Sebranek and Bacus Citation2007; King et al. Citation2015), as well as reduction of the growth of other foodborne microorganisms, including Salmonella spp. and Listeria monocytogenes, which are important in the context of public health (Hospital et al. Citation2012, Citation2014; Citation2017; Christieans et al. Citation2018). Additionally, nitrites inhibit lipid peroxidation and the process of fat rancidity and thus increase the shelf life of cured meat (Andrée et al. Citation2010). The addition of nitrites to meat initiates numerous chemical reactions that result in the preservation of colour and the development of other characteristics of cured meat products. Nitrites are thought to improve the sensory quality of products and change the taste and aroma of meat (Sebranek and Bacus Citation2007; Andrée et al. Citation2010; Hospital et al. Citation2012, Zhang et al. Citation2023). However, high dietary nitrite exposure can lead to adverse health effects. Nitrites are precursors of nitrosamines ([EFSA] European Food Safety Authority 2010), which form as a result of the nitration of secondary amines. These substances, rather than the nitrites themselves, have been found to increase the risk of adverse health effects, and they are classified as carcinogens as they contribute to an increased risk of gastric cancer. Moreover, like with other compounds found in processed meat, these compounds can cause colon cancer (Mortensen et al. Citation2017). The consumption of nitrites at high concentrations can contribute to cyanosis (methemoglobinemia) or anaemic hypoxaemia resulting from impaired oxygen transport in the blood. This is due to the association of nitrites with haemoglobin, which causes iron oxidation and thus the formation of methaemoglobin (Lee et al. Citation2021).
However, nitrites also exert beneficial effects on human health. They are reduced to nitric oxide, which is essential to the human body (Lee et al. Citation2021). They also play an important role in the proper functioning of the cardiovascular, immune, metabolic, as well as the nervous and reproductive systems (Lee et al. Citation2021; Milešević et al. Citation2022).
Exposure to phosphates
According to a report by the European Food Safety Authority (EFSA), the main food categories contributing to total phosphate exposure when using the regulatory maximum level exposure assessment scenario were fine bakery wares, unflavoured pasteurised and sterilised (including UHT) milk among children and infants, and bread rolls and fine bakery wares for other age groups. If the refined exposure assessment scenario is applied, the food categories contributing the most to phosphate exposure are bread and rolls, fine baked goods in all age groups; processed cheese in young children; and meat products, sugars, and syrups in children, adults, and the elderly (Younes et al. Citation2019). Processed meat products accounted for 6.1%–14.0% of the total dietary phosphorus exposure in toddlers, 5.2%–17.8% in children, 5.4%–19.3% in adolescents, 5.1%–21.8% in adults, and 7.1%–18.6% in the elderly (Younes et al. Citation2019). In our study, the mean exposure to phosphates from meat products in children was 13.8% of the ADI at tier 2, whereas the exposure for high-level consumers (95p) was 28.1% at tier 2. The exposure estimates for high-level consumers at tier 2 were higher than those estimated by the EFSA, but still below the ADI.
In the case of a study conducted in Serbia involving a group of children aged 1–9 years, the mean phosphate exposure at tier 3, i.e. taking into account the phosphate concentrations in the products, ranged between 4.93% and 5.26% of the ADI in girls and between 4.97% and 5.40% of the ADI in boys (Milešević et al. Citation2022). In this experiment, the evaluation was performed for tier 2, i.e. based on the maximum levels of use of food additives as specified in Regulation 1333/2008 ([EC] European Commission Citation2008). Therefore, it was not possible to compare the study results conclusively.
Despite the fact that phosphorus exposure from meat products is well below the ADI, it should not be forgotten that, in this case, it is not the main food category responsible for dietary exposure. Therefore, the total ADI from all food categories can be exceeded, as observed in a study conducted in a group of children in the UK (Vin et al. Citation2013), where phosphate exposure from meat products was estimated to be 16%–41% of the total exposure. Additionally, the panel concluded that an ADI level of 40 mg/kg body weight/day, expressed as phosphorus, is safe for healthy adult humans and does not apply to individuals with moderate-to-severe renal impairment, which can affect up to 10% of the population (Younes et al. Citation2019).
Although phosphorus is essential to the human diet, excessive amounts can be associated with adverse health effects. These conditions include nephrocalcinosis and nephropathy (Younes et al. Citation2019). Moreover, excessive phosphorus intake is also suspected of affecting the activation of fibroblast growth factor-23 (FGF-23), which in turn is directly linked to the development of disorders such as left ventricular hypertrophy, vascular calcification, atrial fibrillation, heart failure, and cardiovascular mortality, as well as the development of bone disorders including bone demineralisation, osteoporosis and bone fractures (Milešević et al. Citation2022).
Exposure to erythorbic acid (E 315) and/or sodium erythorbate (E 316)
Based on the EFSA report, the main food categories contributing to the total exposure to erythorbic acid (E 315) and sodium erythorbate (E 316), according to the regulatory maximum level exposure scenario, were heat- and non-heat-treated meat products, meat products, processed fish and fishery products, preserved and semi-preserved fish products, and fish roe. In all the analysed age groups, meat products accounted for 50%–100% of the exposure to the abovementioned food additives. In the case of the refined exposure assessment scenario, the food categories contributing the most to the exposure to erythorbic acid and sodium erythorbate were meat products (heat-and non-heat-treated meat products), which accounted for approximately 96%–100% of exposure to the said food additives (EFSA 2016). In our study, the mean exposure to erythorbic acid and/or sodium erythorbate from meat products was 5.23% of the ADI at tier 2, whereas the exposure for high-level consumers (95p) was 18.7% at tier 2. The results of the present analysis could not be compared with those of similar studies from European and non-European countries because exposure to erythorbic acid and/or sodium erythorbate from meat products has not yet been the subject of other publications. However, considering that when applying tier 2 calculations, the food categories responsible for exposure are mainly meat products, it can be assumed that the consumption of erythorbic acid and/or sodium erythorbate in Poland is well below the ADI. A study conducted in Italy (also at tier 2), which assessed exposure to the above food additives from all categories, found that the ADI was not exceeded, with exposure being 20% of the ADI, and in the case of high-level consumers (95p), 50% of the ADI (Leclercq et al. Citation2000).
Limitations of the study
Our study has some limitations. First of all, due to limited access to the appropriate type or geographic scope of study participants, respondents during the food consumption data collection were not randomly selected, which may have resulted in bias in the study population. However, during the survey, responses were obtained from respondents that varied in gender, age group, level of education and place of residence. Due to the high dietary exposure to nitrites from processed meat, especially in the group of children, further research, including a random sample, should focus on this age group.
Second,the data on nitrite concentrations in the meat products used in the above analysis were based on literature data from the years 1993–2004. The lack of current studies, combined with the trend to reduce the levels of nitrites used during processed meat production observed in other countries (e.g. Estonia and France), may lead to an overestimation of the results. Additionally, the lack of a direct relationship between the amount of nitrites added to the production process and their concentration in the final product (EFSA, 2003) can lead to errors in the results. Nitrites added to meat during the production process are degraded, and their residue levels in the final product are dependent on the heat-treatment temperature; storage time; product pH; and the use of antioxidants such as ascorbic acid, sodium ascorbate, erythorbic acid, and sodium erythorbate (Honikel Citation2008; EFSA 2003). Therefore, when conducting tests, it is more appropriate to rely on the amount of added substances rather than on the concentration of residual nitrites in the final product.
Conclusions
Our studies have shown that dietary exposure to nitrites from processed meats is very high and, in many cases, exceeds the ADI, especially in children. Moreover, it should be noted that apart from processed meat products, there are other dietary sources of nitrites and that a large amount of nitrates (from vegetables, water, etc.) is endogenously converted to nitrites.
The alarming results regarding the level of nitrite exposure (obtained from individual consumption questionnaires in correlation with nitrite concentrations in processed meat reported in the literature and adjusted for their occurrence frequency) show that it may be necessary to perform analyses of nitrite exposure at tier 3, as well as tiers 3a and 3b, based on the actual concentrations used by manufacturers.
In the case of phosphates, dietary exposure to phosphorus from meat products was found to be well below the ADI. However, the above-mentioned food category is not the only one responsible for dietary exposure, which may mean that the ADI is exceeded if all food categories are added together.
This study showed that dietary exposure to erythorbic acid and/or sodium erythorbate in meat products is well below the ADI. It also appears that the total exposure from all food categories should not lead to an exceedance of the ADI, because meat products constitute the main category contributing to exposure to the abovementioned food additives.
Authors’ contribution
Conceptualisation: K. Cz-Z. and K. A.; Methodology, K. Cz-Z. and D. K.; validation, K. Cz-Z. and J.Z.; formal analysis, K. Cz.-Z. and A.D.; investigation, K. Cz-Z.; resources, K. Cz-Z. Data curation: K. Cz-Z. Writing, original draft preparation: K. Cz-Z. and D.K.; writing, review, and editing, A.D., J.Z., A.J-T., and K.A.; Visualisation, K. Cz.-Z. and D. K.; supervision, K. A.; and project administration, K. Cz.-Z. All the authors have read and agreed to the published version of the manuscript.
Disclosure statement
No potential conflict of interest was reported by the author(s).
References
- Andrée S, Jira W, Schwind KH, Wagner H, Schwägele F. 2010. Chemical safety of meat and meat products. Meat Sci. 86(1):38–48. doi:10.1016/j.meatsci.2010.04.020.
- Anyzewska A, Wawrzyniak A. 2014. Evaluating adult dietary intakes of nitrate and nitrite in Polish households during 2006–2012. Rocz Panstw Zakl Hig. 65(2):107–111.
- Bemrah N, Vin K, Sirot V, Aguilar F, Ladrat AC, Ducasse C, Gey JL, Rétho C, Nougadere A, Leblanc JC. 2012. Assessment of dietary exposure to annatto (E160b), nitrites (E249-250), sulphites (E220-228) and tartaric acid (E334) in the French population: the second French total diet study. Food Addit Contam Part A Chem Anal Control Expo Risk Assess. 29(6):875–885. doi:10.1080/19440049.2012.658525.
- Biró G, Hulshof KF, Ovesen L, Amorim Cruz JA,. 2002. Selection of methodology to assess food intake. Eur J Clin Nutr. 56 Suppl 2(S2):S25–S32. doi:10.1038/sj.ejcn.1601426.
- Burnham KP, Anderson DR. 2002. Model selection and inference: a practical information-theoretic approach. New York(NY): Springer-Verlag.
- Chetty AA, Prasad S, Pinho OC, de Morais CM. 2019. Estimated dietary intake of nitrate and nitrite from meat consumed in Fiji. Food Chem. 278:630–635. doi:10.1016/j.foodchem.2018.11.081.
- Christieans S, Picgirard L, Parafita E, Lebert A, Gregori T. 2018. Impact of reducing nitrate/nitrite levels on the behavior of Salmonella Typhimurium and Listeria monocytogenes in French dry fermented sausages. Meat Sci. 137:160–167. doi:10.1016/j.meatsci.2017.11.028.
- De Keyzer W, Huybrechts I, De Vriendt V, Vandevijvere S, Slimani N, Van Oyen H, De Henauw S. 2011. Repeated 24-hour recalls versus dietary records for estimating nutrient intakes in a national food consumption survey. Food Nutr Res. 55:8326. doi:10.3402/fnr.v55i0.7307.
- Diouf F, Berg K, Ptok S, Lindtner O, Heinemeyer G, Heseker H. 2014. German database on the occurrence of food additives: application for intake assess. estimation of five food colours for toddlers and children. Food Addit Contam Part A Chem Anal Control Expo Risk Assess. 31(2):197–206. doi:10.1080/19440049.2013.865146).
- Douglass JS, Barraj LM, Tennant DR, Long WR, Chaisson CF. 1997. Evaluation of the budget method for screening food additive intakes. Food Addit Contam. 14(8):791–802. doi:10.1080/02652039709374590.
- Elias A, Jalakas S, Roasto M, Reinik M, Nurk E, Kaart T, Tuvike A, Meremäe K, Nelis K, Elias T. 2020. Nitrite and nitrate content in meat products and estimated nitrite intake by the Estonian children. Food Addit Contam Part A Chem Anal Control Expo Risk Assess. 37(8):1229–1237. doi:10.1080/19440049.2020.1757164.
- [EC] European Commission. 2001. Report from the Commission on Dietary Food Additive Intake in the European Union. Brussels, COM. 542.
- [EC] European Commission. 2004. Commission Regulation No 853/2004 of 29 April laying down specific hygiene rules for on the hygiene of foodstuffs. European Parliament. Off J Eur Union. 139:55–205.
- [EC] European Commission. 2008. Commission Regulation No 1333/2008 of 16 December 2008 on Food Additives. European Parliament. Off J Eur Union. 354:16–33.
- [EFSA] European Food Safety Authority. 2003. Panel on biological hazards. Scientific opinion on a request from the commission related to the effects of nitrites/nitrates on the microbiological safety of meat products. EFSA J. 14:1–34.
- [EFSA] European Food Safety Authority. 2008. Panel on contaminants in the food chain(CONTAM). Scientific opinion on nitrate in vegetables. EFSA J. 689:1–79.
- [EFSA] European Food Safety Authority. 2010. Panel on food additives and nutrient sources added to Food (ANS). Statement on nitrites in meat products. EFSA J. 8(5):1538. doi:10.2903/j.efsa.2010.1538.
- [EFSA] European Food Safety Authority. 2016. Panel on Food Additives and Nutrient Sources added to Food (ANS). Scientific opinion on the re-evaluation of erythorbic acid (E 315) and sodium erythorbate (E 316) as food additives. EFSA J. 14(1):4360. doi:10.2903/j.efsa.2016.4360.
- [FAO] Food and Agriculture Organization of the United Nation. 2013. FAOSTAT. [accessed 2019 Jun 16]. http://www.fao.org/faostat/en/#data.
- [FAO] Food and Agriculture Organization of the United Nation. 2021. Meat. [accessed 2022 December 15]. https://www.fao.org/3/cb5332en/Meat.pdf.
- [FAO.WHO] Food and Agriculture Organisation of the United Nations. World Health Organization. 2003. Nitrate (and potential endogenous formation of N-nitroso compounds). WHO Food Additive. 50.
- [FF] FoodFakty 2021. Konsumpcja mięsa na świecie wzrasta, chociaż jest silnie zróżnicowana. [Meat consumption in the world is increasing, although it is highly diversified]. [accessed 2022 December 15]. https://foodfakty.pl/konsumpcja-miesa-na-swiecie-wzrasta-chociaz-jest-silnie-zroznicowana. Polish
- Godfray HCJ, Aveyard P, Garnett T, Hall JW, Key TJ, Lorimer J, Pierrehumbert RT, Scarborough P, Springmann M, Jebb SA. 2018. Meat consumption, health, and the environment. Science. 361(6399):5324. doi:10.1126/science.aam5324.
- Honikel KO. 2008. The use and control of nitrate and nitrite for the processing of meat products. Meat Sci. 78(1-2):68–76. doi:10.1016/j.meatsci.2007.05.030.
- Hospital XF, Hierro E, Arnau J, Carballo J, Aguirre JS, Gratacós-Cubarsí M, Fernández M. 2017. Effect of nitrate and nitrite on Listeria and selected spoilage bacteria inoculated in dry-cured ham. Food Res Int. 101:82–87. doi:10.1016/j.foodres.2017.08.039.
- Hospital XF, Hierro E, Fernández M. 2012. Survival of Listeria innocua in dry fermented sausages and changes in the typical microbiota and volatile profile as affected by the concentration of nitrate and nitrite. Int J Food Microbiol. 153(3):395–401. doi:10.1016/j.ijfoodmicro.2011.11.032.
- Hospital XF, Hierro E, Fernandez M. 2014. Effect of reducing nitrate and nitrite added to dry fermented sausages on the survival of Salmonella typhimurium. Food Res Int. 62:410–415. doi:10.1016/j.foodres.2014.03.055.
- King AM, Glass KA, Milkowski AL, Sindelar JJ. 2015. Comparison of the effect of curing ingredients derived from purified and natural sources on inhibition of Clostridium perfringens outgrowth during cooling of deli-style Turkey Breast. J Food Prot. 78(8):1527–1535. doi:10.4315/0362-028X.JFP-14-491.
- Kotopoulou S, Zampelas A, Magriplis E. 2022. Risk assessment of nitrite and nitrate intake from processed meat products: results from the Hellenic National Nutrition and Health Survey (HNNHS). Int J Environ Res Public Health. 19(19):12800. doi:10.3390/ijerph191912800.
- Larsson K, Darnerud PO, Ilbäck NG, Merino L. 2011. Estimated dietary intake of nitrite and nitrate in Swedish children. Food Addit Contam Part A Chem Anal Control Expo Risk Assess. 28(5):659–666. doi:10.1080/19440049.2011.555842.
- Leclercq C, Arcella D, Turrini A. 2000. Estimates of the theoretical maximum daily intake of erythorbic acid, gallates, butylated hydroxyanisole (BHA) and butylated hydroxytoluene (BHT) in Italy: a stepwise approach. Food Chem Toxicol. 38(12):1075–1084. doi:10.1016/s0278-6915(00)00106-x.
- Lee DY, Lee SY, Jo C, Yoon Y, Jeong JY, Hur SJ. 2021. Effect on health from consumption of meat and meat products. J Anim Sci Technol. 63(5):955–976. doi:10.5187/jast.2021.e101.
- Lee HS. 2018. Exposure estimates of nitrite and nitrate from consumption of cured meat products by the U.S. population. Food Addit Contam Part A Chem Anal Control Expo Risk Assess. 35(1):29–39. doi:10.1080/19440049.2017.1400696.
- Leth T, Fagt S, Nielsen S, Andersen R. 2008. Nitrite and nitrate content in meat products and estimated intake in Denmark from 1998 to 2006. Food Addit Contam Part A Chem Anal Control Expo Risk Assess. 25(10):1237–1245. doi:10.1080/02652030802101885.
- Löwik MR. 1996. Possible use of food consumption surveys to estimate exposure to additives. Food Addit Contam. 13(4):427–441. doi:10.1080/02652039609374428.
- Menard C, Heraud F, Volatier JL, Leblanc JC. 2008. Assessment of dietary exposure of nitrate and nitrite in France. Food Addit Contam Part A Chem Anal Control Expo Risk Assess. 25(8):971–988. doi:10.1080/02652030801946561.
- Micha R, Khatibzadeh S, Shi P, Andrews KG, Engell RE, Mozaffarian D, 2015. Global, regional and national consumption of major food groups in 1990 and 2010: a systematic analysis including 266 country-specific nutrition surveys worldwide. BMJ Open. 5(9):e008705. doi:10.1136/bmjopen-2015-008705.
- Michalski MM. 1996a. Residues of nitrites and nitrates in selected meat products examined in veterinary laboratories within the framework of sanitary-hygiene supervision in the year 1995. Bull Vet Inst Pulawy. 40:117–120.
- Michalski MM. 1996b. Zawartość azotynów i azotanów w wybranych produktach drobiowych w 1993 roku [Content of nitrites and nitrates in selected poultry products in 1993]. Gosp Miesna. 48(3):52–53.
- Michalski MM. 1997a. Residues of nitrites and nitrates in selected meat products examined in Poland within the framework of sanitary-hygiene supervision in 1996. Bull Vet Inst Pulawy. 41:127–130.
- Michalski MM. 1997b. Pozostałości azotanów i azotynów w kiełbasach wyprodukowanych w Polsce w 1995 roku [Residues of nitrates and nitrites in sausages produced in Poland in 1995]. Gosp Miesna. 49(5):52–53. Polish
- Michalski MM. 1997c. Zawartość azotynów oraz azotanów w wybranych produktach mięsnych w 1994 r [Content of nitrites and nitrates in selected meat products in 1994]. Przem Spoż. 51(6):36–37. Polish
- Michalski MM. 1998. Zawartośc azotynów i azotanów w kiełbasach parzonych [The content of nitrites and nitrates in scalded sausages]. Med Weter. 54(6):421–423. Polish
- Milešević J, Vranić D, Gurinović M, Korićanac V, Borović B, Zeković M, Šarac I, Milićević DR, Glibetić M. 2022. The intake of phosphorus and nitrites through meat mroducts: a health risk assessment of children aged 1 to 9 years old in Serbia. Nutrients. 14(2):242. doi:10.3390/nu14020242.
- [MF] Ministry of Finance, Poland. 2019. Dane z zeznań podatkowych podatników, o których mowa w art. 27b ustawy z dnia 15 lutego 1992 r. o podatku dochodowym od osób prawnych (Dz. U. z 2017 r. poz. 2343, ze zm.) oraz w ustawie z 24 listopada 2017 r. o zmianie ustawy o podatku dochodowym od osób prawnych (Dz. U. poz. 2369) [Data from tax returns of taxpayers referred to in art. 27b of the Act of February 15, 1992 on Corporate Income Tax (Journal of Laws of 2017, item 2343, as amended) and in the Act of November 24, 2017 amending the Corporate Income Tax Act (Journal of Laws item 2369)]. [accessed 2019 Jun 16]. https://www.gov.pl/attachment/b478f9f3-f0ce-4326-98a6-7e15fde394b1. Polish
- Mortensen A, Aguilar F, Crebelli R, Di Domenico A, Dusemund B, Frutos MJ, Galtier P, Gott D, Gundert-Remy U, Lambré C, et al. 2017. EFSA panel on food additives and nutrient sources added to food (ans) on re-evaluation of potassium nitrite (E 249) and sodium nitrite (E 250) as food additives. EFSA J. 15(6):e04786. doi:10.2903/j.efsa.2017.4786.
- Reinik M, Tamme T, Roasto M, Juhkam K, Jurtsenko S, Tenńo T, Kiis A. 2005. Nitrites, nitrates and N-nitrosoamines in Estonian cured meat products: intake by Estonian children and adolescents. Food Addit Contam. 22(11):1098–1105. doi:10.1080/02652030500241827.
- Rohrmann S, Linseisen J. 2016. Processed meat: the real villain? Proc Nutr Soc. 75(3):233–241. doi:10.1017/S0029665115004255.
- Salvador Castell G, Serra-Majem L, Ribas-Barba L. 2015. What and how much do we eat? 24-hour dietary recall method. Nutr Hosp. 31(3):46–48. doi:10.3305/nh.2015.31.sup3.8750.
- Skrajnowska D, Pokorska-Lis G, Oledzka R. 2004. The contents of nitrates (III) and (V), added polyphosphates and total levels of phosphorus, calcium, magnesium, iron and zinc in some cured meat products. Rocz Panstw Zakl Hig. 55(4):287–295.
- Sebranek JG, Bacus JN. 2007. Cured meat products without direct addition of nitrate or nitrite: what are the issues? Meat Sci. 77(1):136–147. doi:10.1016/j.meatsci.2007.03.025.
- Speedy AW. 2003. Global production and consumption of animal source foods. J Nutr. 133(11):4048–4053. doi:10.1093/jn/133.11.4048.
- Statistics Poland. 2018. Demographic yearbook of Poland. Warsaw: Statistics Poland.
- Suomi J, Ranta J, Tuominen P, Putkonen T, Bäckman C, Ovaskainen ML, Virtanen SM, Savela K. 2016. Quantitative risk assessment on the dietary exposure of Finnish children and adults to nitrite. Food Addit Contam Part A Chem Anal Control Expo Risk Assess. 33(1):41–53. doi:10.1080/19440049.2015.1117145.
- Szczebyło A, Halicka E, Rejman K, Kaczorowska J. 2022. Is eating less meat possible? Exploring the willingness to reduce meat consumption among millennials working in polish cities. Foods. 11(3):358. doi:10.3390/foods11030358.
- Szponar L, Wolnicka K, Rychlik E. 2020. Album fotografii produktów i potraw. [Photo album of products and dishes]. Warsaw: National Food and Nutrition Institute.
- Temme EH, Vandevijvere S, Vinkx C, Huybrechts I, Goeyens L, Van Oyen H. 2011. Average daily nitrate and nitrite intake in the Belgian population older than 15 years. Food Addit Contam Part A Chem Anal Control Expo Risk Assess. 28(9):1193–1204. doi:10.1080/19440049.2011.584072.
- Thomson BM, Nokes CJ, Cressey PJ. 2007. Intake and risk assessment of nitrate and nitrite from New Zealand foods and drinking water. Food Addit Contam. 24(2):113–121. 2: doi:10.1080/02652030600934206.
- Thornton PK. 2010. Livestock production: recent trends, future prospects. Philos Trans R Soc Lond B Biol Sci. 365(1554):2853–2867. doi:10.1098/rstb.2010.0134.
- Vin K, Connolly A, McCaffrey T, McKevitt A, O'Mahony C, Prieto M, Tennant D, Hearty A, Volatier JL. 2013. Estimation of the dietary intake of 13 priority additives in France, Italy, the UK and Ireland as part of the FACET project. Food Addit Contam Part A Chem Anal Control Expo Risk Assess. 30(12):2050–2080. doi:10.1080/19440049.2013.851417.
- Wawrzyniak A, Hamułka J, Skibińska E. 2003. Obliczeniowa ocena pobrania azotanów i azotynów oraz witamin antyoksydacyjnych z całodziennymi racjami pokarmowymi przez dzieci w wieku 1-6 lat [The evaluation of nitrate, nitrite and antioxidant vitamin intake in daily food ration of children aged 1-6 year of age]. Rocz Panstw Zakl Hig. 54(1):65–72. Polish
- [WCRF] World Cancer Research Fund. American Institute for Cancer Research 2018. Recommendations and public health and policy implications. [accessed 2022 Dec 04]. https://www.wcrf.org/wp-content/uploads/2021/01/Recommendations.pdf.
- Younes M, Aquilina G, Castle L, Engel KH, Fowler P, Frutos Fernandez MJ, Fürst P, Gürtler R, Husøy T, Mennes W. 2019. EFSA panel on food additives and flavourings (FAF). Re-evaluation of phosphoric acid-phosphates - di-, tri- and polyphosphates (E 338-341, E 343, E 450-452) as food additives and the safety of proposed extension of use. EFSA J. 17(6):e05674. doi:10.2903/j.efsa.2019.5674.
- Zhang Y, Zhang Y, Jia J, Peng H, Qian Q, Pan Z, Liu D. 2023. Nitrite and nitrate in meat processing: functions and alternatives. Curr Res Food Sci. 6:100470. doi:10.1016/j.crfs.2023.100470.
Appendix A
Table A. The mean nitrite content in processed meat calculated on the available literature data. 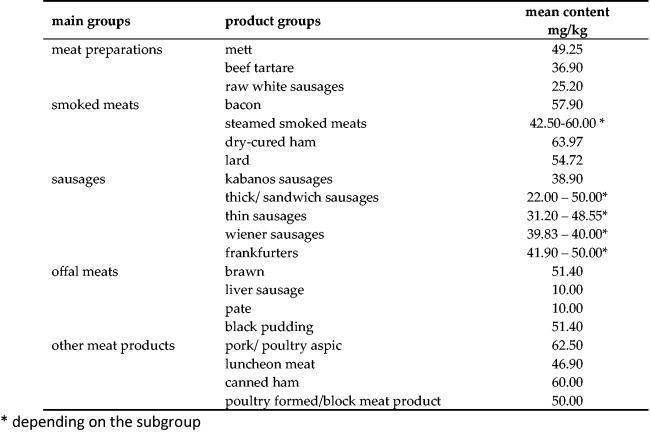
Appendix B
Table B. Dietary exposure to nitrites from processed meat products by age groups, education level and place of residence 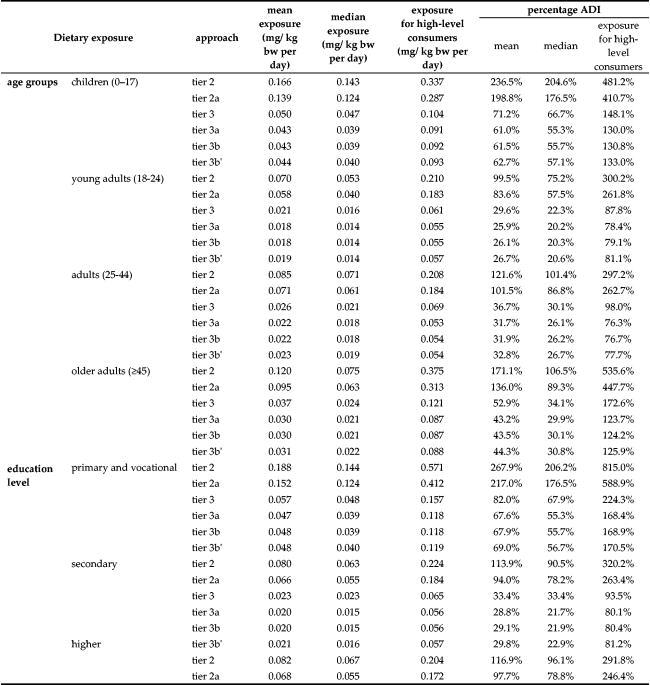
Appendix C
Appendix D
Table C. Dietary exposure to nitrites from processed meat products (in mg/kg body weight/day) and participant variables by the level of intake (above and below the ADI) at tiers 2 and 2a. The p-values indicate the significance level of a given variable (or interaction) in the model, Excluded – variable excluded as a result of selection (only interactions included in at least one of the highest ranked models are presented)