
 ?Mathematical formulae have been encoded as MathML and are displayed in this HTML version using MathJax in order to improve their display. Uncheck the box to turn MathJax off. This feature requires Javascript. Click on a formula to zoom.
Abstract
Fumonisins are one of the main problems affecting maize production in the Texas High Plains (THP), where its agroclimatic conditions make it a perennial hotspot for mycotoxin contamination. In 2017, a fumonisin outbreak in the THP maize motivated stakeholders’ request to repeal a subsection of the Texas Administrative Code, §61.61(a)(7) (Fumonisin Rule), and its related Texas Feed Industry Memorandum (Memo 5–20), which previously permitted the blending of maize containing high fumonisin levels with maize containing ≥ 5 mg/kg under state authority, and pivot to FDA fumonisin guidance. Shortly after, the USDA Risk Management Agency (RMA's) reintroduced Discount Factors (DFs) in annual Special Provisions (SP) that outline price reductions related to fumonisin contamination in maize. In this research, we estimate the potential economic burden posed by these changes through a two-part approach. In part one, we construct a decision model that explores the final disposition of fumonisin-contaminated maize based on blending permissions, fumonisin levels, and crop insurance status. In part two, we estimate the economic impact by inserting output values of the decision model into financial equations that consider testing costs, transportation fees, and discounts from crop insurance and grain elevators when applicable. Our economic analysis projects that the financial losses during a THP crop year with high fumonisin levels could range from $15.1 to $135.5 million without the option to blend under conditions of the revised RMA discount schedule. Findings further highlight crop insurance as the most promising risk management strategy for farmers in areas susceptible to fumonisin contamination.
Introduction
Maize, commonly referred to as corn, is the fifth-ranked agricultural commodity in Texas, generating more than $1.2 billion annually. Roughly 49% of Texas maize is produced in the Texas High Plains (THP), a 41-county region that covers nearly 16.5 million (M) acres, with 90% of land dedicated to agribusiness (Church Citation2019; USDA Citation2019). The THP is one of the most prolific crop-producing areas nationwide that accounts for $1.5 billion (43.8%) of annual agricultural cash receipts, supports jobs of 56,547 employees, and provides access to over 1,758 manufacturing firms (Church Citation2019). Maize has remained the most valuable THP crop for years, averaging $551.12 M (44.6%) of Texas’s annual total crop receipts (Church Citation2019). The primary driver of THP maize production is the demand to feed and fatten the 73% of Texas cattle raised in this region (Church Citation2019; USDA Citation2019). Several factors challenge the THP agricultural economy, including its agroclimatic conditions that make it a perennial hotspot for mycotoxin contamination by fumonisins.
Fumonisins (FUM) are pervasive toxins produced by Fusarium molds that commonly invade maize, reducing grain quality, restricting inclusion in human foods and animal feeds, and thus decreasing profitability (FDA Citation2001). Factors contributing to mold growth in maize include plant stress, unsuitable storage practices, and hot and dry climate, followed by high humidity (FDA Citation2001). Exposure to FUM-contaminated products has the potential to disrupt sphingolipid metabolism, causing several multi-organ and systemic effects in animals, esophageal carcinoma in humans, and neural tube defects in human fetuses (Dragan et al. Citation2001; FDA Citation2001; Merrill et al. Citation2001; Missmer et al. Citation2006).
Texas guidelines for fumonisin
The Food and Drug Administration (FDA) has provided non-binding guidance levels for FUM since 2001 to protect human and animal health. While other states followed the FDA (Citation2001) guidelines, Texas relied on the Texas Administrative Code §61.61(a)(7) and the Office of the Texas State Chemist (OTSC) Feed Industry Memorandum 5–20: The distribution of Fumonisin-containing whole grain and screenings in commercial channels and their use in mixed feeds, established before FDA's 2001 recommendations (OTSC Citation2018; 4 Tex. Admin. Code § 61.61(a)(7) (Citationdate unknown). In short, the Feed Industry Memorandum 5–20 authorized blending as an option under state authority for maize containing ≥ 5 mg/kg FUM with higher concentrated maize for intrastate commerce to maximize product availability for feedlots and allow the maize industry to manage FUM risk economically. Under the rule, maize was blended, retested, and sold to grain elevators at discounted prices assigned based on grain quality or transported to intended markets determined by compliance with FDA guidance, as shown in .
Table 1. Maize discounts for approved THP markets based on FDA recommendations.
Texas stakeholders supported the Feed Industry Memorandum 5–20 until FUM concentrations reached 214 mg/kg in maize grown in nineteen THP counties during the 2017 crop year (Herrman et al. Citation2018). As a result, OTSC approved nine blending plans in 2017, in contrast to six in 2016 (Herrman et al. Citation2018). In 2018, OTSC repealed the Texas Fumonisin Rule upon stakeholders’ request and pivoted to the Federal Food Drug and Cosmetic Act (FD&C Act) 402(a), which deems mixing contaminated and uncontaminated products as adulteration. Without the option to blend, grains containing FUM ≥ 60 mg/kg can only be exported to poultry markets with a maximum FUM concentration of 100 mg/kg (FDA Citation2001). However, intended markets for THP maize (e.g. feedlots and grain elevators) are distant from alternate markets, like poultry operations located in East and South-Central Texas, inducing transportation costs. Furthermore, alternate options for maize containing ≥ 100.1 mg/kg FUM are considered nonprofitable without crop insurance, including on-farm feeding and maize destruction.
Fumonisin risk management in Texas maize
The economic practicality of growing, harvesting, or processing consumable products without encountering hazardous or unavoidable defects is nonexistent. Thus, the USDA Risk Management Agency (RMA) manages the federal crop insurance program (FCIP), enabling farmers to purchase government-subsidized coverages from approved insurance providers (AIPs) to counterbalance casualties caused by multiple perils, such as adverse climate, water shortage, crop damage, and price reductions. Before each crop year, the FCIP defines terms and conditions in annual Loss Adjustment Manuals (LAMs), Special Provisions (SPs), and bulletins for each type and level of coverage offered based on specific geographic regions (USDA Citation2017a; 7 C.F.R. §457).
Texas maize producers may protect crops through crop-hail insurance from private sectors or FCIP multiple peril crop insurance. Most THP maize producers opt to carry crop-hail insurance policies to protect against hail and other perils not covered under FCIP. A smaller percentage have multi-peril policies, including yield-based or revenue-based plans that provide quality adjustment (QA) based on prospective market prices to offset losses from quality deficiencies recognized by the FDA, such as fumonisin contamination (USDA Citation2020). Crop insurance is categorized into enterprise, basic, optional, and whole-farm units, with coverage levels ranging from 50% to 85%, with 85% available in applicable areas (USDA Citation2016).
Generally, grains containing FUM levels ≥ 2.1 mg/kg qualify for QA (USDA Citation2017c; USDA Citation2018). To assess eligibility, AIPs collect samples for mycotoxin analysis, or farmers deliver truckloads to pre-approved RMA testing locations, like the One Sample Strategy (OSS) testing locations overseen by OTSC. OTSC established the OSS program in 2011 to enhance market assurance and food security by extending the benefits and obligations of official mycotoxin testing to commercial grain operations and laboratories (OTSC Citation2023). RMA and OTSC standardize crop sampling procedures and field test kits, authorizing OSS locations to conduct mycotoxin testing for crop insurance purposes (Herrman et al. Citation2018; OTSC Citation2023). Participating firms of OSS report official results to OTSC, who then provide these results to RMA, streamlining risk management and expediting the crop insurance claim process (Herrman et al. Citation2018). Grain elevators also rely on accurate FUM results to determine price discounts (PDs) for FUM-contaminated maize (OTSC Citation2023). Grain elevator PDs differ from crop insurance Discount Factors (DFs) that entail the indemnity payment owed to farmers for insured quality deficiencies, as presented in . DF charts are published in RMA's annual SPs and outline higher DFs and lower farmer payments at increased contaminant levels.
In 2017, RMA excluded DFs for FUM from the annual SPs, qualifying all farmers marketing maize containing ≥ 2.1 mg/kg FUM for Zero Market Value (ZMV) provision (USDA Citation2017b; USDA Citation2020). ZMV indemnifies farmers of the full market value when no local buyers are willing to purchase the product (USDA Citation2020). Claiming the ZMV and selling maize to the intended market al.lowed insured farmers to double their profit, gaining excess revenue over expense. On the other hand, grain elevators and cattle feedlots managed food safety risks through OTSC-approved blending plans. In 2018, RMA reintroduced DFs for FUM in SPs for the THP region (USDA Citation2018). The 2018 SP only allowed farmers to receive ZMV if maize containing FUM ≥ 100.1 mg/kg was destroyed acceptably (USDA Citation2018), as shown in .
The elimination of the Texas Fumonisin Rule and the reintroduction of DFs to RMA's SPs suspended the financial windfall for farmers and the industry’s ability to economically manage food safety (Cogburn Citation2017). Without the option to blend, maize containing FUM ≥ 60.1 mg/kg affects all partakers involved in the value chain. Yet, the economic pinch is more substantial for maize producers who do not have crop insurance and grain elevators who are highly regulated and can no longer rely on the legal certainty previously afforded by the blending provision. A pro forma analysis revealed that the farmers gained $52 M following the 2017 FUM outbreak by claiming ZMV and selling maize to intended markets. Stakeholders requested the repeal of the Texas fumonisin rule with a general perception that the FDA might revise the FUM guidance and focus on reducing FUM incidence through agronomic practices. In the absence of these anticipated outcomes, a need exists to determine the economic impact of repealing the Fumonisin Rule and Memo 5–20 while maintaining compliance with FD&C Act 402(a).
Towards that end, this study estimates the financial losses associated with eliminating the option to blend and introducing DFs in SPs for THP farmers, grain elevators, and the maize industry. More specifically, we evaluate the influence of crop insurance participation, FUM frequency, alternative market availability, and price reductions on the value gained for marketing FUM-contaminated maize in the THP without the option to blend and with the current crop insurance DFs.
Materials and methods
Fundamental concept of the model
This predictive model explores the economic consequence of a severe FUM outbreak in THP maize using a two-part model. In part one, a decision tree is constructed with the Precision Tree component of the Palisade @Risk and Decision Analysis software to demonstrate the allocation options for THP maize based on blending permissions, FUM content, and crop insurance status. Here, the volume of maize is measured by bushel (bu.) and equates to roughly 25 kg. In part two, maize amounts of the decision tree are inserted into financial equations to estimate the potential economic loss for THP farmers, grain elevators, and the maize industry in the event of a future FUM outbreak. We conducted the study with the following assumptions:
All maize produced in the THP is initially transported to grain elevators at an equal cost for all farmers.
Grain elevators analyze 10% of all truckloads for FUM and pass the $25 testing cost to farmers.
Under the option to blend, maize containing ≥ 2.1 mg/kg FUM is blended to ≤ 60 mg/kg, retested, and sold to feedlots or grain elevators.
At grain elevators, PDs presented in are assigned. At feedlots, the full market value is received if FUM content is ≤ 60 mg/kg.
With the option to blend, grain elevators do not have a lawful market in the THP to sell maize containing FUM ≥ 100.1 mg/kg, leading to its rejection. Likewise, removing the option to blend eliminates the lawful market for maize containing ≥ 60.1 mg/kg, but ≤ 100 mg/kg, also leading to its rejection.
Farmers marketing maize containing ≥ 60.1 mg/kg FUM without blending permissions distribute grain to poultry operations or use maize for on-farm feeding, which is considered non-lucrative without crop yield protection.
Farmers encounter a $1.65/bu. transportation fee when delivering grain to poultry markets, where full market value is received for maize containing ≤ 100 mg/kg.
Maize rejected at grain elevators or deemed non-salvageable based on FDA guidance is considered profitless and does not incur destruction costs. Thus, only insured farmers benefit through ZMV based on their crop coverage level.
Insured farmers receive double profit under RMA’s 2017 SPs (e.g. the price received at intended markets + the amount gained through crop indemnity) and encounter DFs presented in under RMA’s 2018 SPs.
Fumonisin contamination in THP maize
The FUM levels in THP maize were extracted from the OTSC database for the 2017 crop year. Most data were gathered from whole maize samples collected at participating firms by OTSC field investigators in Moore, Dallam, Hartley, Potter, and Hutchinson counties. OTSC personnel analyzed samples for total FUMs (FB1 + FB2 + FB3) with an in-house ISO/IEC 17025:2017 accredited chemical analysis utilizing the UPLC-MS/MS (Li et al. Citation2010). We performed descriptive statistics and organized data into four categories based on the following ranges of FUM content: ≤ 2 mg/kg, 2.1–60 mg/kg, 60.1–100 mg/kg, and ≥ 100.1 mg/kg, as shown in .
Table 2. OTSC survey data for FUM content in the 2017 THP maize harvest.
THP maize harvest
Additional THP data collected in this study included 2017 maize yield, average price of maize per bu., crop insurance participation, grain elevator PDs, and RMA’s 2018 DFs. We obtained the maize yield from the USDA National Agricultural Statistics Service (NASS), indicating 123 M bu. were produced during the 2017 THP harvest (USDA Citation2019). The USDA NASS also revealed the price of maize in 2017 as $3.84 per bu. (USDA Citation2017c). Documents from the USDA RMA showed that 30% of farmers purchased crop yield protection in 2017 at a 70% coverage level (CBO Citation2017).
We gathered grain elevator PDs from a pro forma analysis conducted by Kelsey Postma, a former OTSC graduate student analyst (). The 2017 PD started at −60 cents per bu. of maize containing 60 mg/kg and increased by 0.01 cent/bu. for every mg/kg over 60 mg/kg. The 2018 PD started at −20 cents for maize bu. containing 60 mg/kg and increased by 20 cents/bu. for every twenty mg/kg over 60 mg/kg. The RMA 2018 DFs were gathered from SPs for Potter County using RMA’s Actuarial Information Browser (AIB) with the following search terms: 2017 reinsurance year; corn (0041); 2017 commodity year; Yield protection (01) insurance plan; Texas (48); and Potter (375).
Decision model
depicts the decision tree for part one of our economic assessment. The step-by-step diagram began with the 123 M bu. of maize produced during the 2017 THP harvest. The first circular chance node denotes the 30% of farmers protected through crop yield coverage and the 70% uninsured. Pathways (also called branches) following the nodes for insured and uninsured farmers represent the percent frequency of FUM in maize based on those same ranges as the OTSC survey data (e.g. FUM ≤ 2 mg/kg, 2.1–60 mg/kg, 60.1–100 mg/kg, or ≥ 100.1 mg/kg). Nodes that precede FUM frequency are the final disposition options. The last destination for maize containing FUM ≤ 2 mg/kg or 2.1–60 mg/kg is the feedlot or grain elevator. For maize with FUM levels ranging from 60.1 to 100 mg/kg, we consider on-farm feeding and the poultry market. In contrast, no markets are considered for maize containing ≥ 100.1 mg/kg FUM. The triangular end nodes represent the end of a particular pathway.
Figure 1. Decision tree for determining the final disposition of THP maize containing FUM based on blending permissions. ‘P’ represents the probabilities of particular events occurring. aPs for the option to blend. bPs without blending permissions.
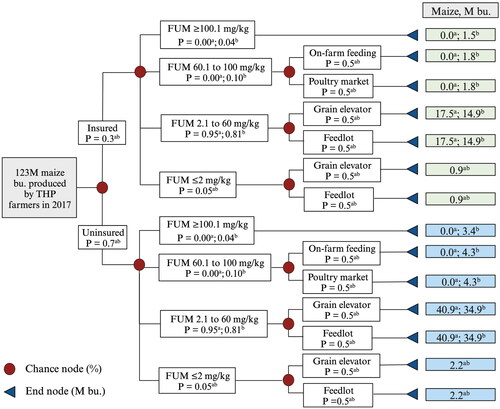
The probabilities (P) for each branch demonstrate the likelihood of particular events and differ based on permitted blending options, as shown in . Under the option to blend, we assume that all maize is blended to ≤ 60 mg/kg FUM; thus, zeros are the Ps for FUM content ranging from 60.1 to 100 mg/kg and exceeding 100.1 mg/kg. Other Ps representing FUM content reflect OTSC survey data. The Ps for final destination routes were 0.5. For grain elevators and feedlots, this informed estimate was supported by the comparable number of facilities in the THP (e.g. 122 grain elevators vs. 116 feedlots), suggesting equal availability for acceptable maize (Herrman et al. Citation2018). There was no data available to support an informed decision concerning the maize distribution to each alternative market sector; thus, 0.5 Ps were also utilized to represent the allocation of maize containing 60.1–100 mg/kg FUM used for on-farm feeding and transported to poultry operation. All Ps for each node sum up to one (e.g. p = 1). Multiplying Ps along each specific pathway estimates the overall probability of THP maize containing various levels of FUM reaching distinct destinations. These Ps are then multiplied by the 123 M maize bushels produced during the 2017 THP harvest to estimate the amount of maize sold by insured or uninsured farmers to each available market.
Financial analysis
Part two of the study incorporated maize amounts generated from part one into the financial equations, estimating the potential economic impact for THP farmers and the maize industry based on the following scenarios:
Scenario A: Option to blend + RMA’s 2017 SPs (baseline)
Scenario B: No option to blend + RMA’s 2017 SPs
Scenario C: No option to blend + RMA’s 2018 SPs
Financial equations are listed in Supplementary Table 1. Computations estimated the influence of FUM levels on farmers’ ability to sell maize, testing costs, and discounts imposed by crop insurance and grain elevators. Scenario A represented the authorized blending provision and available RMA DFs during the 2017 FUM outbreak in THP maize. The equations for insured farmers accounted for the value earned from intended markets and the indemnified value gained through crop insurance payments. In contrast, uninsured farmers only received the value gained from marketing maize to intended markets. Scenario B revealed the economic impact of eliminating the option to blend, which subjected all maize containing ≥ 60.1 mg/kg FUM to alternate operations. Scenario C highlighted the effect of adding DFs for FUM to RMA’s SP. These equations only considered the economic losses for insured farmers, as the reintroduction of DFs did not affect those uninsured.
In each scenario, testing costs were deducted from the value earned by farmers. Testing costs were estimated with the assumption that if an average Texas field of 540 acres produces 140 bu. of maize/acre, and each truckload holds 1000 bu., then every tenth truckload of 1000 bu. undergo FUM analyses at grain elevators, which equates to roughly one test per 2500 tonnes of maize (USDA Citation2019). The equation used for testing costs was as follows:
Where TC represented testing costs; Bu. the amount of marketed maize; 1,000 the amount of maize bu. per truckload; 1/10 the number of truckloads charged for testing; and $25 the fee per test.
The financial findings of Scenario A served as our baseline value. The projected economic losses for repealing the option to blend and reintroducing RMA DFs were estimated by deducting the outcomes of financial equations for Scenarios B and C from the value earned in Scenario A.
For grain elevators, we estimated the potential economic losses with the assumption that maize containing FUM ≥ 100.1 mg/kg under the option to blend is rejected. Likewise, we assumed that maize containing FUM ≥ 60.1 mg/kg is rejected without blending permissions. The equation used to calculate these financial losses for grain elevators was as follows:
Where GEL represented the economic losses for THP grain elevators; Bu. the amount of THP maize bu. containing FUM content based on ranges of OTSC survey data; fMV the 2017 full market value of THP maize; and $1 M the 1-million-dollar conversion factor.
Sensitivity analysis
We conducted a sensitivity analysis to examine the relative impact of input variation on economic losses for THP farmers, grain elevators, and the maize industry. These factors were crop insurance enrollment, crop coverage level, alternative usage, and FUM frequency in maize based on ranges previously discussed. We subjected all factors to a 20-step variation from −25% to 25%. The sensitivity analyses for uninsured farmers excluded crop insurance and coverage levels. Likewise, we only considered FUM content in maize in the sensitivity analysis for grain elevators. For the THP maize industry, we assessed the influence of insured or uninsured farmers marketing maize containing ≥ 60.1 to 100 mg/kg and ≥ 100.1 mg/kg separately, instead of evaluating the FUM frequency in ranges.
Software
Palisade @RISK and Decision Tools version 8.0.1. https://palisade.lumivero.com/
Results
Projected economic losses
presents the projected economic losses due to high FUM levels in THP maize following the elimination of the Texas Fumonisin Rule and the addition of DFs in RMA SPs. Scenario A shows the value gained during the 2017 THP maize harvest, while Scenarios B and C reveal the potential profit deductions associated with these changes in the event of future FUM outbreaks. The anticipated economic losses range from $15.1 to $135.5 M. The THP maize industry experienced the lowest loss (9%) in Scenario B, with insured and uninsured farmers encountering a 6% and 11% economic loss, respectively. The highest loss (17%) for the THP industry was observed in Scenario C, where insured farmers encountered a 39% reduction in revenue.
Table 3. Potential economic consequences for THP farmers and the maize industry.
shows the potential economic impact of repealing the blending authority for THP grain elevators. With the option to blend, grain elevators reject 4.9 M bu. of maize containing ≥ 100.1 mg/kg FUM, generating a $18.9 M loss. Removing the option to blend also subjects maize containing 60.1–100 mg/kg FUM to rejection. The projected losses without blending permissions equal $47.2 M for the 17.2 M bu. containing 60.1–100 mg/kg FUM, and $18.9 M for maize with ≥ 100.1 mg/kg FUM.
Table 4. Projected financial losses for THP grain elevators.
Sensitivity analysis
show the relative impact of varying Ps by 25% on the projected economic losses for THP farmers, grain elevators, and the maize industry. For uninsured farmers, a 25% variation in the amount of maize containing 2.1–60 mg/kg FUM resulted in a potential $3.4–$64.4 M reduction in economic losses. In contrast, maize with FUM levels ≥ 60.1 mg/kg contributed $0.2–$5.6 M to the financial losses faced by uninsured farmers.
Figure 2. Results for the sensitivity analyses. A (top left): THP uninsured farmers. B (top right): THP insured farmers. C (bottom left): THP grain elevators. D (bottom right): THP maize industry.
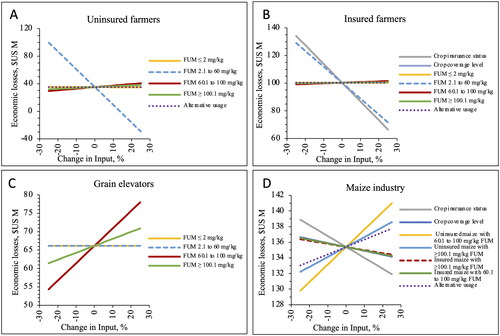
For insured farmers, varying crop insurance participation and the amount of maize containing 2.1–60 mg/kg FUM led to a $1.2–$33.8 M decrease in financial losses. Other observations were a ≤ $1.2 M economic difference for varying crop coverage levels and maize containing all other ranges of FUM content.
For grain elevators, maize containing FUM ranging from 60.1 to 100 mg/kg contributed $0.6–$11.8 M to economic losses. Fumonisin content in maize ≥ 100.1 mg/kg contributed $0.2–$4.7 M to losses in revenue. Maize containing FUM ≤ 60 mg/kg did not influence economic losses for THP grain elevators.
For the THP maize industry, uninsured farmers marketing grains with ≥ 60.1 mg/kg FUM had the greatest influence on economic losses, followed by the amount of maize intended for alternative usage, such as poultry operations or on-farm feeding. These factors contributed $0.2–$5.6 M to losses in revenue. Crop insurance participation had the most substantial impact on reducing economic losses by $0.2–3.5 M. Other factors that reduced financial losses for the THP maize industry were insured farmers marketing maize containing ≥ 60.1 mg/kg FUM and crop coverage levels.
Discussion
In recent years, fumonisins have become one of the most challenging mycotoxins for the THP maize industry, which is responsible for feeding the 73% of Texas beef confined in the region. The climate in the THP is conducive to fungal and subsequent mycotoxin contamination. As such, the availability and sales of THP maize are limited by FUM levels exceeding 60 mg/kg without the option to blend under state authority and with changes established in RMA's 2018 SPs. Our economic risk assessment estimated potential losses associated with these changes in a given crop year with high FUM contamination. Financial calculations projected that in a year with high FUM levels, THP grain elevators without a lawful market in the THP would reject 17.2 M bu. of maize containing ≥ 60.1 mg/kg FUM and lose up to $66.1 M. The economic losses for the THP maize industry during a FUM outbreak could reach $50.2 M per year in the absence of blending permissions and $135.5 M per year with the addition of RMA DFs. More specifically, repealing the option to blend generates a potential 6% economic loss for insured farmers and a possible 11% loss for uninsured maize producers. In contrast, reintroducing DFs in RMA’s SPs only impacts insured farmers, subjecting them to roughly 39% economic loss.
At a glance, results may imply that repealing the option to blend and reintroducing changes to RMA's SPs affected insured farmers more than uninsured farmers. However, it is critical to note that excluding DF charts in RMA SPs is uncommon and has not been done since the 2017 crop year. The RMA has established DF charts in SPs for FUM in THP maize for six crop years succeeding the 2017 outbreak, indicating the financial windfall experienced by insured farmers in 2017 was unusual and the chance of receiving this opportunity again is unlikely.
This research is comparable to previous estimates of the financial losses caused by fumonisin contamination to the rest of the country, where blending is not an option. In 2007, an economic model for fumonisins in US maize predicted that a crop year with low FUM levels would result in a $1–$20 M loss, while a crop year with a significant FUM outbreak would generate a $31 to $46 M loss (Wu Citation2007). Our findings are also consistent with the economic losses experienced by removing the option to blend aflatoxin-containing maize. In 2012, eight states encountered pervasive droughts that resulted in a 33% national loss. As a result, the FDA approved blending maize containing aflatoxin levels above 0.02 mg/kg with maize of low or no aflatoxins at the request of these eight states to increase maize availability for livestock feeding and minimize the associated economic burden. However, droughts persisted in succeeding crop years that sparked safety concerns and controversy for maize producers, provoking the FDA to repeal blending permits for aflatoxin-contaminated maize. The FDA has not approved blending for aflatoxins since. Other economic analyses projected that aflatoxin-related losses posed to the US maize industry in 2011 to 2013 ranged from $52.1 M to $1.7 billion annually (Mitchell et al. Citation2016). However, these projections utilized a limited number of incorrectly attributed data from OTSC and did not consider the impact of the Texas OSS aflatoxin risk-management program. Postma et al. (Citation2023) report that the co-regulation of aflatoxin resulted in an economic benefit of $14.5 M in 2018. These differences (Mitchell et al. Citation2016 vs. Postma et al. Citation2023) align with our current fumonisin study where financial losses associated with mycotoxin risk management are determined, in part, by the regulatory strategy used to manage mycotoxin risk.
Our work indicates that the Texas agriculture industry’s request to repeal the Texas Fumonisin Rule and Memo 5–20 rule was economically deleterious to Texas commercial grain handlers and uninsured maize producers. In 2017, Texas was the only state to have promulgated rules for fumonisin in maize. The decision to pivot to FDA guidance provides equal protection to the Texas food and feed supply, albeit at a significant cost to stakeholders. Another factor contributing to the Texas agriculture industry’s proposal to eliminate the in-state fumonisin regulation involved results of industry-funded research conducted by Texas A&M University’s animal science faculty. That study reported there were no significant differences in the health or performance of fifty beef steers when fed up to 108.8 mg/kg fumonisin for 110 d (Jennings et al. Citation2020). These findings led to the misperception that the FDA would reassess fumonisin guidance levels. However, the study by Jennings et al. (2020) failed to address several confounding variables, such as considering a control group and analyzing feed for other potential sources of contamination, creating a challenge to establish the connection between fumonisin and the observed outcomes. A recent study further explored the influence of Jennings et al. (2020) on the current regulatory levels for fumonisin in cattle through a comparison of meta-analysis and the Environmental Protection Agency’s (EPA’s) benchmark dose software (Brown Citation2023). Findings ultimately indicated there is insufficient scientific evidence to support a change in FDA fumonisin guidance (Brown Citation2023).
Conclusion
Our predictive economic analysis revealed that repealing the Texas Fumonisin Rule and reintroducing DFs for insured crops containing FUM subjects THP maize producers to a $15.1–$135.5 M loss in a given crop year with high FUM contamination. For THP grain elevators, a severe FUM outbreak without the authorized blending provision could lead to the rejection of 17.2 M bu. of maize, worth $66.1 M. Findings further highlight crop yield coverage as a reliable safety net for THP maize producers, who are more prone to FUM contamination.
| Abbreviations | ||
| AIP | = | Approved insurance provider |
| Bu. | = | Bushels |
| DF | = | Discount factors |
| FCIP | = | Federal Crop Insurance Program |
| FUM | = | Fumonisin |
| P | = | Probability |
| PD | = | Price discounts |
| OSS | = | One Sample Strategy |
| OTSC | = | Office of the Texas State Chemist |
| SP | = | Special provisions |
| THP | = | Texas High Plains |
| RMA | = | Risk Management Agency |
Supplemental Material
Download Zip (105.5 KB)Disclosure statement
No potential conflict of interest reported by author(s).
Additional information
Funding
References
- 4 Tex. Admin. Code § 61.61(a)(7). [date unknown]. Subchapter H. Adulterants, Amended to be effective in 1995 (OTSC). https://casetext.com/regulation/texas-administrative-code/title-4-agriculture/part-3-texas-feed-and-fertilizer-control-serviceoffice-of-the-texas-state-chemist/chapter-61-commercial-feed-rules/subchapter-h-adulterants/section-6161-poisonous-or-deleterious-substances
- Brown AA. 2023. Improvement of feed and nutrient security for sulfur and fumonisin in Texas feedlot cattle rations [Doctoral dissertation]. Texas A&M University.
- Church L. 2019. The impact of agribusiness in the high plains trade area. Amarillo Chamber of Commerce. https://amarillo.tamu.edu/files/2019/12/Impact-of-AgriBusiness.pdf.
- Code of Federal Regulations. 2022. Title 7. Subtitle B. Chapter IV. Part 457-Common crop insurance regulations. 7 C.F.R. §457. https://www.ecfr.gov/current/title-7/subtitle-B/chapter-IV/part-457
- Cogburn C. 2017. Sustainable crop insurance services: fumonisin update. http://www.sustainablecropins.com/fumonisin-update/.
- Congressional Budget Office (CBO). 2017. Options to reduce the budgetary costs of the federal crop insurance program. https://www.cbo.gov/publication/53375.
- Dragan YP, Bidlack WR, Cohen SM, Goldsworthy TL, Hard GC, Howard PC, Riley RT, Voss KA. 2001. Implications of apoptosis for toxicity, carcinogenicity, and risk assessment: fumonisin B1 as an example. Toxicol Sci. 61(1):6–17. doi: 10.1093/toxsci/61.1.6.
- FDA. 2001. Guidance for Industry: fumonisin Levels in Human Foods and Animal Feeds. Established Nov. 2001. https://www.fda.gov/regulatory-information/search-fda-guidance-documents/guidance-industry-fumonisin-levels-human-foods-and-animal-feeds
- Herrman TJ, Sasser M, Rooney M. 2018. White paper on fumonisin risk management and communication in the Texas High Plains. https://otscweb.tamu.edu/Risk/Fumonisin%20White%20Paper.pdf.
- Jennings JS, Ensley SM, Smith WN, Husz TC, Lawrence TE. 2020. Impact of increasing levels of fumonisin on performance, liver toxicity, and tissue histopathology of finishing beef steers. J Anim Sci. 98(12). doi: 10.1093/jas/skaa390. 33280003.
- Li W, Herrman TJ, Dai SY. 2010. Rapid determination of fumonisins in corn-based products by liquid chromatography/tandem mass spectrometry. J AOAC Int. 93(5):1472–1481. doi: 10.1093/jaoac/93.5.1472.
- Merrill AH, Sullards MC, Wang E, Voss KA, Riley RT. 2001. Sphingolipid metabolism: roles in signal transduction and disruption by fumonisins. Environ Health Perspect. 109(Suppl 2):283–289. doi: 10.1289/ehp.01109s2283.
- Missmer SA, Suarez L, Felkner M, Wang E, Merrill AH, Rothman KJ, Hendricks KA. 2006. Exposure to fumonisins and the occurrence of neural tube defects along the Texas-Mexico border. Environ Health Perspect. 114(2):237–241. doi: 10.1289/ehp.8221.
- Mitchell NJ, Bowers E, Hurburgh C, Wu F. 2016. Potential economic losses to the US corn industry from aflatoxin contamination. Food Addit Contam Part A Chem Anal Control Expo Risk Assess. 33(3):540–550. doi: 10.1080/19440049.2016.1138545.
- OTSC. 2018. Feed Industry Memorandum 5-20: the distribution of fumonisin-containing whole grain, whole seeds and screenings in commercial channels and their use in mixed feeds. Issued in 1995 as Memorandum 5-19. Voided in Oct 2018. https://otscweb.tamu.edu/Laws/PDF/Feed/FdInd-5-20.pdf.
- OTSC. 2023. One sample strategy mycotoxin risk management for Texas: 2023 Handbook. Version 13.1. https://otsc.qualtraxcloud.com/Showdocument.aspx?ID=7186.
- Postma K, Herrman TJ, Sasser M. 2023. Economic benefit of co-regulation to manage aflatoxin risk in maize. Heliyon. 9(7):e18254. doi: 10.1016/j.heliyon.2023.e18254.
- USDA. 2016. Risk management agency fact sheet: Texas corn. https://www.rma.usda.gov/Fact-Sheets/Oklahoma-City-Regional-Office-Fact-Sheets/Corn-2017-TX.
- USDA. 2017a. Loss adjustment manual standards handbook. 2017 and succeeding crop years. FCIC-25010 (10-2016). https://www.rma.usda.gov/-/media/RMA/Handbooks/Loss-Adjustment-Standards–-25000/Loss-Adjustment-Manual/2017-25010-Loss-Adjustment-Manual-Standards-Handbook.ashx?la=en.
- USDA. 2017b. Risk management agency: special provisions of insurance: 2017 and succeeding crop years. https://webapp.rma.usda.gov/apps/actuarialinformationbrowser/CropCriteria.aspx.
- USDA 2017c. National agricultural statistics service, agricultural statistics board: 2017 Agricultural Prices. Available at: https://www.nass.usda.gov/Publications/Todays_Reports/reports/agpr0317.pdf.
- USDA. 2018. Risk management agency: special provisions of insurance: 2018 and succeeding crop years. https://webapp.rma.usda.gov/apps/actuarialinformationbrowser/CropCriteria.aspx.
- USDA. 2019. 2017 census of agriculture: Texas state and county data. Part 43A and 43B. Volume 1. AC-17-A-42A & 42B. Issued April 2019. https://www.nass.usda.gov/Publications/AgCensus/2017/Full_Report/Volume_1,_Chapter_1_State_Level/Texas/.
- USDA. 2020. Risk management agency fact sheet: corn quality adjustment. https://www.rma.usda.gov/en/Fact-Sheets/National-Fact-Sheets/Corn-Quality-Adjustment.
- Wu F. 2007. Measuring the economic impacts of Fusarium toxins in animal feeds. Anim Feed Sci Technol. 137(3-4):363–374. doi: 10.1016/j.anifeedsci.2007.06.010.