
 ?Mathematical formulae have been encoded as MathML and are displayed in this HTML version using MathJax in order to improve their display. Uncheck the box to turn MathJax off. This feature requires Javascript. Click on a formula to zoom.
Abstract
A method was developed for the determination of tropane alkaloids (TAs), including atropine, scopolamine, anisodamine and homatropine in buckwheat and related products. This work presents an optimised methodology based on QuEChERS (Quick, Easy, Cheap, Effective, Rugged and Safe) extraction procedure followed by ultra-high performance liquid chromatography combined with time-of-flight mass spectrometry for the determination of TAs (atropine, scopolamine, anisodamine and homatropine) in buckwheat samples. The analytical methodology was successfully validated, demonstrating good linearity, low limit of quantification, repeatability (RSDr < 15%), inter-day precision (RSDR < 19%) and recovery (74–113%). Finally, 13 commercial samples of buckwheat were analysed and the results demonstrated that they were in compliance with the current European regulations regarding TAs.
Introduction
Tropane alkaloids (TAs) are naturally occurring compounds, produced as secondary metabolites in several species of plants, being the most prevalent in the Solanaceae family. TAs are predominately found in Atropa belladonna and Datura stramonium and distributed over all parts of the plant, this includes leaves, flowers, pericarp, roots and seeds (Dusemund et al. Citation2018).
Although more than 200 types of TAs have been identified in plants, the most researched ones are atropine and scopolamine (). Those TAs are widely used in the pharmaceutical industry as non-selective inhibitors of the muscarinic acetylcholine receptors (Chan Citation2017; Kohnen-Johannsen and Kayser Citation2019; Ribeiro et al. Citation2022). Atropine is the racemic mixture of isomers (−)-hyoscyamine and (+)-hyoscyamine, which only the (−)-hyoscyamine enantiomer exhibits anticholinergic activity (EFSA CONTAM Panel Citation2013). Though, when ingested at higher doses, atropine and scopolamine are toxic, with decreased production of secretions in the digestive and respiratory tract, mydriasis, muscle spasms and tachycardia as the main reported adverse effects in humans (Adamse et al. Citation2014). Moreover, there are other TAs, like anisodamine and homatropine (), which had the same effects but with less toxicity. However, no chronic or genotoxic toxicity were exhibited (EFSA CONTAM Panel Citation2013).
Figure 1. Chemical structures of TAs, including atropine, scopolamine, anisodamine and homatropine (structures from https://pubchem.ncbi.nlm.nih.gov/ (accessed on 30 September 2023)].
![Figure 1. Chemical structures of TAs, including atropine, scopolamine, anisodamine and homatropine (structures from https://pubchem.ncbi.nlm.nih.gov/ (accessed on 30 September 2023)].](/cms/asset/b108f716-00b9-4cd3-8365-8c31ab02bac0/tfac_a_2339325_f0001_c.jpg)
In the primary phases of the food chain, TAs can accidentally occur due to contamination with seeds, especially from Datura spp. plants, containing high concentrations of these natural chemical contaminants. These plants have the same cultural cycle as crops of grains, cereals and pseudocereals, and seeds cannot be easily removed by sorting from some cultures, like buckwheat, since they have similar size (Perharič et al. Citation2013; Chan Citation2017). The presence of TAs in foodstuffs is a health concern, consequently, the European Commission established new maximum levels for the sum of atropine and scopolamine for cereals, pseudocereals and herbal infusions, applicable from 1 September 2022 (European Commission Citation2021), to ensure the highest standards of food safety.
Buckwheat (Fagopyrum esculentum L.) is a well-known pseudocereal, belonging to the Polygonaceae family, native from Asia. This triangular seed does not belong to the cereal family but has similar characteristics with them, like physical appearance and high starch content, being a good source of carbohydrates (>70%) (USDA FoodData Central Citation2019; Martínez-Villaluenga et al. Citation2020). Buckwheat is also a good source of protein (13%), including essential amino acids, such as lysine and methionine, important in plant-based diets (USDA FoodData Central Citation2019; Martínez-Villaluenga et al. Citation2020).
This good nutritional profile leads many people to consider buckwheat a healthy ingredient and potentially used in different processed foods including bread, pasta, snacks and cakes. In addition, buckwheat is gluten-free and is important in diets for people with coeliac disease and intolerance to gluten (Caeiro et al. Citation2022). Moreover, the consumption of this pseudocereal is frequently associated with health benefits including antioxidant, anti-cancer, anti-inflammatory and anti-hypertension effects (Giménez-Bastida and Zieliński Citation2015; Koval et al. Citation2020). In 2020, the world production of buckwheat was 1.8 million tonnes (FAOSTAT Citation2022).
The increasing evidence of the presence of TAs in food products and their likely negative impact on human health has driven an increased need of methodologies to determine these chemical contaminants at very low levels in complex matrices such as foods, to ensure the consumers’ health. In the scientific literature, some analytical methods for the determination of TAs in buckwheat have been developed in recent years, using different approaches (Perharič et al. Citation2013; Mulder et al. Citation2016; Chen et al. Citation2017; Marín-Sáez et al. Citation2017; Cirlini et al. Citation2018). Although few methods applied the QuEChERS (acronym of Quick, Easy, Cheap, Effective, Rugged and Safe) approach, this methodology provides a simple, quick, easy and environmentally friendly way to extract contaminants and allows rapid analysis of several food samples (Chen et al. Citation2017; Perestrelo et al. Citation2019).
Therefore, to fill the gap in multi-analyte methodologies for TAs, the aim of this paper was to develop and validate an ultra-high performance liquid chromatography combined with time-of-flight mass spectrometry (UHPLC–ToF-MS) method to determinate atropine, scopolamine, anisodamine and homatropine in buckwheat and buckwheat products, through a QuEChERS approach. Another purpose of this paper was to estimate the presence of TA in the buckwheat, applying the optimised method to Portuguese market samples and providing data on the occurrence of these TAs and evaluating the compliance with EU legal limits.
Materials and methods
Chemicals and reagents
TA standards, including atropine ((±)-hyoscyamine), (±)-scopolamine hydrochloride, anisodamine and homatropine hydrobromide were purchased from Sigma–Aldrich (Madrid, Spain). D5-atropine and 13C, D3-scopolamine hydrobromide were used as internal standards (IS) and were obtained from Sigma–Aldrich (Madrid, Spain). All standard solutions were stored in amber vials in the dark at −20 °C, and before use, they were kept at room temperature for 30 min.
Methanol (MeOH), acetonitrile (ACN), both HPLC gradient grade, and formic acid were purchased from Merck (Darmstadt, Germany). Water was purified by Milli-Q plus system from Millipore (Molsheim, France) with resistivity of 18.2 MΩ × cm.
For QuEChERS, trisodium citrate dihydrate and anhydrous magnesium sulphate were purchased from PanReac (Barcelona, Spain). Sodium chloride was purchased from Fluka (Seelze, Germany). Sodium citrate dibasic sesquihydrate was purchased from Sigma–Aldrich (Madrid, Spain). For clean-up, primary secondary amine-bonded silica (PSA) and C18 were acquired from Agilent Technologies (Santa Clara, CA, USA).
Samples and sampling procedure
Samples (n = 13) of buckwheat-based products were randomly purchased in different supermarkets in Portugal between April and May of 2022 (Table S1). The samples included pasta, flakes, galettes, puffs, flour and grain with different origins from conventional agriculture and organic agriculture, which is one of the popular consumer trends. Additionally, buckwheat is frequently easier to find at specialty health stores that often exclusively sell organic foods. Samples were ground (Retsch rotor mill SK 300 with a sieve of trapezoid holes of 1.00 mm), mixed thoroughly to assure homogenisation and preserved at room temperature until further analysis.
Preparation of standard solutions
Stock standard solutions of four TAs were individually prepared by dilution in MeOH (Marín-Sáez et al. Citation2017). Atropine and anisodamine solutions were prepared with a concentration of 1 mg/mL, while the stock solution of homatropine hydrobromide was prepared at 10 mg mL−1 and scopolamine hydrochloride was prepared at 10 µg mL−1. These stock solutions were subsequently used to prepare a working solution for calibration.
A calibration work solution was prepared in MeOH by mixture of atropine, scopolamine, anisodamine and homatropine stock standard solutions to obtain a final concentration of 100 ng mL−1 for each analyte.
For internal standards, a stock solution of each IS was prepared with a concentration of 100 µg mL−1 in pure MeOH. Then, a mixture of two IS was prepared at a final concentration of 1 µg mL−1, using pure MeOH as solvent.
Extraction procedure
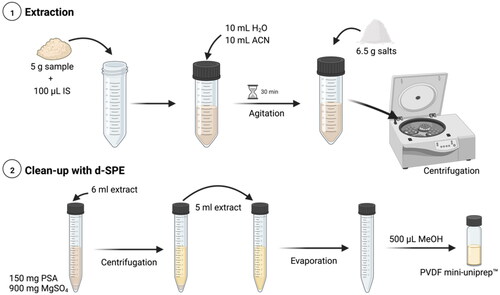
TAs extraction was performed according to a QuEChERS procedure with some modifications. About 5 g of buckwheat (5.0 ± 0.1 g) was weighted in 50 mL Falcon tubes. Firstly, an aliquot of 40 µL of internal standards solution (1 µg mL−1) was added and next 10 mL of cold water and 10 mL of ACN were added and mixed for 1 min in vortex, followed by 30 min at 110 rpm using a Kotterman 4010 Orbital shaker (Uetze/Hanigsen, Germany). Subsequently, 6.5 g of mixture of extraction salts for liquid–liquid partitioning step (4 g of anhydrous magnesium sulphate, 1 g of sodium chloride, 1 g of sodium citrate and 0.5 g of disodium hydrogen citrate sesquihydrate) were added and vortexed for 1 min. Then, the samples were centrifuged at 4500 rpm for 5 min at 5 °C. Afterwards, 6 mL of the extract was added into a tube containing 150 mg PSA sorbent and 0.9 g anhydrous MgSO4, which corresponds to a clean-up step, called dispersive solid-phase extraction (d-SPE). After centrifugation at 4500 rpm (3622 × g) for 2 min at 5 °C, 5 mL of the extract was transferred to a 15 mL Falcon tube and evaporated to dryness under a gentle stream of nitrogen at 40 °C. The residues were redissolved with 500 µL of pure MeOH, vortexed for 30 s, followed by 10 min in an ultrasonics bath. Finally, the redissolved extract was filtered through a PVDF mini-uniprep™ for injection into the UHPLC–ToF-MS system ().
Figure 2. Extraction procedure for the determination of four TAs in buckwheat samples (created with BioRender.com).
UHPLC–ToF-MS parameters
Detection and quantification were performed with a Nexera X2 Shimadzu UHPLC coupled with a 5600+ ToF-MS detector (SCIEX, Foster City, CA, USA) equipped with a Turbo Ion Spray electrospray ionisation source working in positive mode (ESI+).
Regarding the chromatographic separation, a column Acquity UPLC BEH C18 (2.1 mm × 100 mm, 1.7 µm) was used and kept at 20 °C. The autosampler was maintained at 10 °C to refrigerate the samples. The flow rate was 0.3 mL min−1 and a volume of 20 μL extract solution was injected into the column. The mobile phase consisted of water [A] and ACN [B] both acidified with 0.1% formic acid, with the following gradient program: start with 5% [B]; 0.01–6 min from 5% to 80% [B]; 6–6.5 min from 80% to 3% [B] and kept until the end of the run with 3% [B], with total run time of 10 min.
For mass spectrometry, acquisition was performed in full scan from 100 to 750 Da using Analyst® TF software (SCIEX, Foster City, CA, USA) and with the following settings: ion source voltage of 5500 V; source temperature 575 °C; curtain gas (CUR) 30 psi; Gas 1 and Gas 2 of 55 psi; declustering potential of 100 V. To provide accurate mass resolution, the ToF-MS detector was calibrated every seven injections in the method’s mass range with standard positive calibration solution for AB SCIEX TripleTOF™ systems, through nine calibration ions with mass range 146.1176 and 1521.9715 Da.
Identification of TAs
The identification and data processing of TAs were made through the PeakView™ and MultiQuant™ software (SCIEX, Foster City, CA, USA). The isotope match is presented automatically by the PeakView™ software, and regarding the acceptance of identification criteria of analytes (Commission of the European Communities Citation2002), three parameters and their corresponding equations (EquationEquations (1)–(3)) were used: (1) maximum relative retention time deviation (ΔRRT) of 2.5% (EquationEquation (1)(1)
(1) ); (2) difference in the isotope pattern with a tolerance of 10% (EquationEquation (2)
(2)
(2) ); and (3) exact mass deviation (Δm) with a tolerance of 5 ppm (EquationEquation (3)
(3)
(3) ).
(1)
(1)
where RTtropane alkaloid is the retention time of each analyte, and the RTinternal standard is the retention time of the corresponding internal standard, depending on the analyte.
(2)
(2)
(3)
(3)
Validation of the UHPLC–ToF-MS method
The method for the determination of atropine, scopolamine, anisodamine and homatropine was validated by the determination of concentration range, linearity, limit of detection (LOD), limit of quantification (LOQ), recovery assays at different levels, precision (repeatability and precision inter-day) and matrix effect (ME).
Spiking experiments
A matrix-matched calibration curve was prepared by spiking a blank sample of buckwheat (5 g) with 8 different levels, using 0.0156–2 mL of calibration of the work solution (‘Chemicals and reagents’ section) to obtain a concentration range between 0.3125 and 40 µg kg−1 of the analytes of interest. Afterwards, extraction was performed as described in ‘Preparation of standard solutions’ section.
The curves were constructed by linear regression analysis of the ratio between the analyte area and corresponding IS area and the concentration (µg kg−1). LOD and LOQ were determined as the concentration that originates a signal-to-noise ratio (S/N) ≥3 and ≥10, respectively. Recovery was determined by repeated analyses (n = 6) of a spiked blank buckwheat matrix, at different levels. For the determination of repeatability (RSDr) and precision inter-day (RSDR), blank samples of buckwheat were spiked at different levels taking into account the ML of TAs. In the case of RSDR, extraction was carried out on three different days by two different operators. Additionally, the selectivity of the method was assessed by analysing twenty times the blank sample of buckwheat.
ME
The ME was evaluated by ionisation suppression/enhancement, comparing the peak areas of the standard calibration curve in solvent and the peak area of the matrix-matched calibration curve with spiked buckwheat samples, through the next formula (Kruve et al. Citation2015a):
For that, a calibration curve in the range of 0.3125–10 μg kg−1 for the four TAs was prepared in solvent and analysed with LC–MS giving the peak area Asolvent standard. Ionisation enhancement was considered when MEionisation > 100%, and ionisation suppression when MEionisation < 100%. According to Matuszewski et al. (Citation2003), the ME could be also classified as negligible ([0%]–[±10%]), soft ([±10%]–[±20%]), medium ([±20%]–[±50%]) and strong ([±50%]).
Statistical analysis
The statistical analysis of the data was analysed with IBM® SPSS® Statistics, version 28.0.1.1. (Chicago, IL, USA), using the Student’s t-test when the normality of data and homogeneity of variances were validated. The significance level was defined at p < 0.01. Results concerning the statistical evaluation of the ME of TAs were expressed as mean value plus the standard deviation (SD) of six replicates.
Results and discussion
Optimisation of chromatographic conditions
The optimisation of UHPLC–ToF-MS parameters was performed by injection of calibration work solution at a concentration of 100 ng mL−1 for each TA and the mix solution of IS. The analytes were analysed using ESI + and in full mass spectra. The optimisation of chromatographic conditions was carried out to obtain the best peak shape and reduce the analysis time.
Firstly, MeOH, ACN and water, with and without acidification (0.1% of formic acid) were tested as solvents of TAs in the chromatographic system. The best results (data not shown) were achieved when used MeOH as solvent.
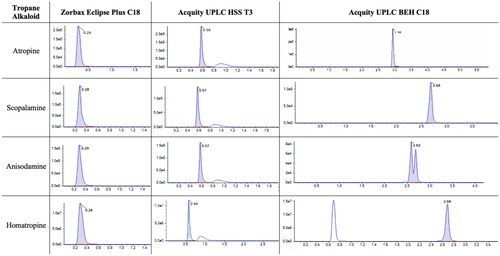
Then, different columns were tested: Ascentis Express C18 (10 cm × 2.1 mm, 2.7 µm), Zorbax Eclipse Plus C18 (2.1 × 50 mm, 1.8 µm), Acquity UPLC HSS T3 (2.1 × 100 mm, 1.8 µm) and Acquity UPLC BEH C18 (2.1 × 100 mm, 1.7 µm), since the non-polar C18 is the stationary phase have been used for the separation of several TAs. The chromatograms of each toxin in different columns are presented in . Moreover, it was concluded that the best peak shape, resolution and retention time were obtained using Acquity UPLC BEH C18. The double peak for anisodamine was already reported in Marín-Sáez et al.’s (Citation2017) study when using Zorbax Eclipse Plus C18, both peaks are assumed for the identification and quantification of anisodamine.
Figure 3. Chromatograms (intensity vs time, min) of atropine, scopolamine, anisodamine and homatropine using different columns, namely, Zorbax Eclipse Plus C18, Acquity UPLC HSS T3 and Acquity UPLC BEH C18.
Other parameters, such as the composition of mobile phase, flow rate (0.3–0.5 mL min−1) and gradient profile were evaluated, setting as optimal conditions those indicated in ‘Extraction procedure’ section, where excellent peak resolution for the four plant toxins was achieved in a 10 min chromatographic run.
Extraction optimisation
A modified QuEChERS method was optimised for the extraction of four TAs from buckwheat. Buckwheat is a complex matrix, and, for method purposes, buckwheat-based products were also studied, increasing the complexity of the matrix, which may interfere with alkaloids analysis.
TAs are high polar compounds, and, to achieve the best results, different modifications on the solvent extraction were tested. TAs are generally extracted using different mixtures of MeOH/water (Nardin et al. Citation2016; Romera-Torres et al. Citation2018; Gonçalves et al. Citation2020) or ACN/water (Chen et al. Citation2017; Cirlini et al. Citation2019; Vuković et al. Citation2021). Different conditions were tested, using different solvents (ACN, water, MeOH), temperatures (room temperature and 4 °C) and time of shaking (0, 30 and 60 min), assessing by comparing the peak areas for all toxins in a blank sample of buckwheat spiked at two levels (2.5 and 10 µg kg−1), summarised in . The conditions A corresponds to extraction with 10 mL of ACN; conditions B correspond to use 10 mL of cold water, shaking by 1 h and then the addition of 10 mL of ACN; conditions C is the same that B, but without shaking; conditions D corresponds to extraction with 10 mL of ACN and shake time (30 min) and finally, the conditions E corresponds to extraction with 10 mL of water and 10 mL of ACN, followed by 30 min of shaking.
Figure 4. Average peak areas (n = 2) using five different extraction procedures for TAs in buckwheat at the spiked level of (a) 2.5 and (b) 10 µg kg−1, where different conditions are represented by letters. A corresponds to extraction with 10 mL of ACN; B correspond to use 10 mL of cold water, shaking by 1 h and then the addition of 10 mL of ACN; C is the same that B, but without shaking; D corresponds to extraction with 10 mL of ACN and shake time (30 min) and finally, the E corresponds to extraction with 10 mL of water and 10 mL of ACN, followed by 30 min of shaking. The lower-case letters indicate statistically significant differences between the conditions tested, for each TAs.
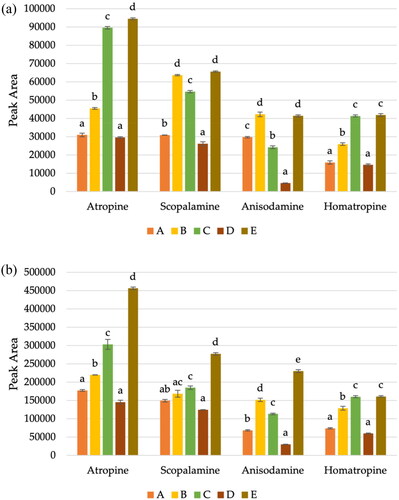
Although MeOH is the most reported solvent for TAs in different matrices, in our study, in general, the best method is the one using 10 mL of both cold water and ACN, corresponding to conditions E, with the highest peak areas. The only exception was for anisodamine, where the method using just ACN had the highest peak area. However, since for buckwheat there are only maximum levels established for the sum of atropine and scopolamine (European Commission Citation2006a, Citation2021), the method was optimised to have the best analytical performance for those TAs.
The use of water, before ACN extraction, improved the extraction efficiency since water is a highly polar solvent in which TAs are very soluble (Chen et al. Citation2017). Additionally, water allows the swelling of buckwheat grain, which had increased the extraction of analytes. Also, the shaking time facilitates matrix swelling. The use of water for swelling was reported in other studies with cereals, for example, wheat (Mastovska et al. Citation2010) and rice (Melo et al. Citation2019), to improve extraction efficiency.
In the literature, the methods have used formic acid or acetic acid, between 0.2% and 1%, to acidify solvent, both in QuEChERS and SPE methods. During the extraction procedure optimisation a method using simple solid–liquid extraction with a mixture of MeOH/water/formic acid (39:60:1 v/v/v) was tested, however, there was no good peak resolution for analytes (data not shown). In our study, for the first time, a non-acidic solvent was used for extraction of TAs, with good results, in agreement with green chemistry principles for use of safer solvents for humans and the environment and minimising the potential accidents in the laboratory. The sample preparation included a clean-up step based on d-SPE to remove interferents and include an evaporation step to concentrate the TAs before the chromatographic step. Other authors have used SPE cartridges for clean-up (Marín-Sáez et al. Citation2017); however, this method requires a vacuum, takes more solvents to activate the column and elute analytes and is difficult to apply to a large number of samples, so, d-SPE has more advantages because is a faster, cheaper and has a higher throughput method (Rejczak and Tuzimski Citation2015).
Validation of analytical method
The optimised method was validated according to the criteria defined by Commission Decision of 12 August 2002 (Commission of the European Communities Citation2002), concerning the performance of analytical methods and the interpretation of the result, since there is still no specific regulation or guidance document for the validation protocol of a method for the quantification of plant toxins in food products.
D5-atropine and 13C, D3-scopolamine were added at the beginning of the extraction procedure as the internal standards for atropine and scopolamine, respectively. The IS allows correction of signal variations, measuring the relative response ratio between a plant toxin and IS. For mass-spectrometric detection, using the isotope-labelled forms of the analyte is more suitable, since it will have characteristics similar to the toxin and, consequently, behavior during the analytical method. However, for the other two TAs, the best IS was selected based on structure similarity, in this case, D5-atropine was selected as is for homatropine and 13C, D3-scopolamine for anisodamine.
Furthermore, the identification criteria, described above were always evaluated. In the experiments carried out for validation purposes, RRT was always lower than 0.5%.
Linearity and LOD and LOQ
Linearity was evaluated by matrix-matched calibration curves in different ranges for different TAs (). Determination coefficients (R2) of calibration curves were always higher than 0.996, as well as residuals, which were always lower than 20%, indicating suitability to quantify TAs in the selected calibration range by the developed method. The determination coefficient was higher for homatropine (R2 = 0.9991), followed by atropine (R2 = 0.9982), scopolamine (R2 = 0.9968) and anisodamine (R2 = 0.9962).
Table 1. Linearity and limits of detection and quantification of UHPLC–ToF-MS method for the simultaneous determination of TAs in buckwheat.
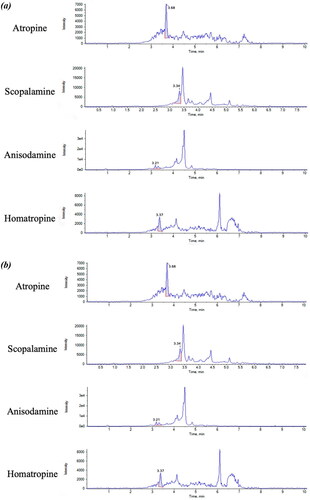
The limits of the method, including LOD and LOQ are compiled in (). LOD and LOQs are much lower than the requirement imposed by EU regulations for the ML of the sum of atropine and scopolamine (10 µg kg−1) in buckwheat products and sensitive enough to detect other two TAs not regulated for buckwheat. However, the method is more sensitive for atropine than scopolamine, since the LOQ was 0.625 µg kg−1 for atropine and 1.25 µg kg−1for scopolamine. The LOQ for atropine is 0.06 lower than the ML, while the LOQ for scopolamine is 0.125 lower than the ML. These LOQs are in agreement with the criteria set by the Recommendation (EU) 2015/976 on the monitoring of the presence of TAs in food, where the ‘LOQs should be preferably below 5 μg kg−1and not higher 10 μg kg−1 for agricultural commodities, ingredients, food supplements and herbal teas and lower than 2 μg kg−1for finished foods’ (European Commission Citation2015). The chromatograms for each TA, at LOQ level and at spiked level of 5 µg kg−1, are present in .
Figure 5. (a) Chromatograms of blank buckwheat sample spiked at LOQ level for each TA, corresponding to 0.625 µg kg−1 for atropine and homatropine and 1.25 µg kg−1 for scopolamine and anisodamine. (b) Chromatograms of blank buckwheat sample spiked at 5 µg kg−1 level for each TA, including atropine, scopolamine, anisodamine and homatropine.
Compared with other methods, a procedure based on QuEChERS developed by Chen et al. (Citation2017) provided a lower LOQ for atropine (0.4 µg kg−1), but a higher LOQ for scopolamine (2 µg kg−1). Moreover, our LOQs were lower than those reported by Marín-Sáez et al. (Citation2017), 1 µg kg−1 for atropine and 2 µg kg−1 for scopolamine, using SPE purification and LC-Orbitrap MS system; however, for anisodamine and homatropine, their LOQs were lower (1 µg kg−1 for anisodamine and 0.5 µg kg−1 for homatropine). Nevertheless, Cirlini et al. (Citation2018) developed a method for the determination of atropine and scopolamine and had lower LOQs (0.30 and 0.10 µg kg−1, respectively). In conclusion, the developed methodology offered comparable LOQs to other studies in the same matrix and included anisodamine and homatropine, TAs still not regulated in buckwheat.
Trueness and precision
shows the results of recovery, repeatability and precision inter-day for the different TAs in a blank buckwheat sample spiked at 8 different concentration levels. The results regarding the validation of the method (), show that for some TAs there is no linear range when using all 8 spiking levels because LODs are higher due to signal-to-noise ratio, like scopolamine, or, in the case of atropine, at higher concentration levels (40 µg kg−1) there is a loss of linearity.
Table 2. Results of the validation for different plant toxins at different spiking levels in buckwheat.
The trueness of measurements can be assessed through the recovery of additions of known amounts of the analytes to a blank matrix, when certified reference materials are not available (Commission of the European Communities Citation2002). Concerning recovery, the method provides good recoveries for all four plant toxins within the appropriate range established by the Commission Regulation EC No. 401/2006 (European Commission Citation2006b), ranging between 74% and 113%. For atropine, the recoveries ranged between 82% and 110%, while for scopolamine ranged between 91% and 107%. These recoveries are comparable to other studies, for example, the recoveries reported by Marín-Sáez et al. (Citation2017) using solid–liquid extraction (63–94%) and by Cirlini et al. (Citation2018), which had a recovery of atropine and scopolamine range 78–103%, applying a simple liquid–liquid extraction on different buckwheat-based food products. Best results were achieved by Chen et al. (Citation2017), which reported recoveries between 80% and 88% for atropine and 77% and 80% for scopolamine; however, this study does not include more TAs.
Precision was evaluated in terms of repeatability and inter-day precision and was expressed as relative standard deviation (RSD). Regarding repeatability, it was evaluated by the relative standard deviation (RSDr) for all toxins, using the same sample, and the same operator in a short time. As it is shown in , good repeatability was obtained with all values lower than or equal to 15%, observing that most of them are below 10%, being considering acceptable (Commission of the European Communities Citation2002). The highest RSDr is for anisodamine at a spiked level of 1.25 µg kg−1 (15.2%), in fact, for all TAs, the repeatability was lower in the lowers spiked levels. Considering each TA, atropine has the best repeatability, ranging between 3% and 10%. These results are similar to Chen et al. (Chen et al. Citation2017) which had good precision with RSDr lower or equal to 17%.
Inter-day precision of the method was evaluated by the relative standard deviation (RSDR) at three different days of analysis, in three different concentration levels with different operators and the values are acceptable, ranging between 5.1% and 18.7%. Scopalamine was the TA with the higher values for RSDR, and consequently, with lower inter-day precision.
Selectivity
The selectivity of the method was assessed by analysing 20 blank samples, checking for any interferences in the region of interest where the target analytes are expected to elute (retention time between 3.30 and 3.70 min). The results showed that, for the four TAs in study, there was no observed any signal/peak at the characteristic retention time of the analyte, indicating the absence of chemical or matrix interferences.
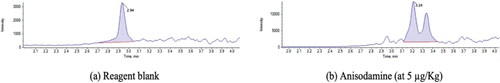
A reagent blank was also prepared, with all the chemicals used in the extraction procedure, with exception of the sample, to observe if they influence on the analytical response. The results show no interferents, except for anisodamine, where there was a peak at 2.94 min but with no interference at the expected time for this analyte (3.26 min) ().
Figure 6. Chromatogram of (a) reagent blank with peak at 2.94 min, also present in the (b) chromatogram.
ME
ME is caused by co-extracted matrix compounds that negatively affect the analytical performance of target analytes, such as ionisation efficiency through either suppression or enhancement (Kruve et al. Citation2015b). The ME of ionisation (ME ionisation) was determined at two levels: LOQ and 10 times the LOQ level (). In general, the LC–MS method causes an ionisation suppression for all toxins. The only exceptions were for atropine and homatropine at the LOQ level, where there was a significant ionisation enhancement (p < 0.01). The method caused a negligible ionisation enhancement for scopolamine (101.4 ± 12.0%) and a soft ionisation suppression for anisodamine (84.4 ± 12.2%), at LOQ levels, but with no significant differences (p > 0.01). For atropine at the LOQ level, the ionisation enhancement was medium, with 126.4 ± 5.9%. The highest ME was for homatropine at LOQ level, with 149.5 ± 5.4, but still considered medium ME. For 10 LOQ level, the method caused an ionisation suppression for all TAs, ranging from 64.2 ± 3.2% for homatropine and 87. 0 ± 3.1% for scopolamine. For atropine and scopolamine, the ionisation was considered soft, while for homatropine and anisodamine was considered medium, according to Matuszewski et al. (Citation2003) criteria.
Figure 7. ME of ionisation with the validated analytical method using QuEChERS and d-SPE for the determination of four TAs (atropine, scopolamine, anisodamine and homatropine) at two different levels: LOQ and 10-fold higher that LOQ. The asterisk (*) means a significant difference (p < 0.01) using the Student’s t-test.
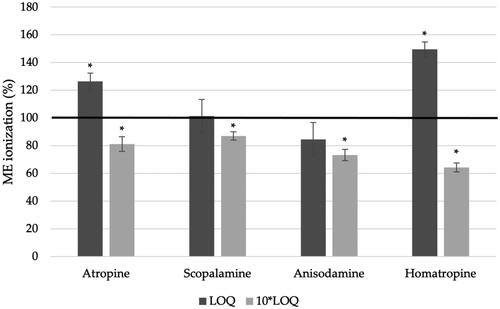
This ionisation suppression was found by Marín-Sáez et al. (Citation2017) in buckwheat samples, using SPE as clean-up and LC–MS/MS, with ME ranging from 19.8% for scopolamine to 33.2% for anisodamine. Jandrić et al. (Citation2011) developed a QuEChERS method without a clean-up step followed by LC–MS/MS and anisodamine was one of the TA with a strong ionisation suppression, around 50% in different cereal matrices, including wheat, rye and maize. Atropine and homatropine also had a medium signal suppression, while scopolamine was the only toxin with ionisation enhancement.
It should be noted that although anisodamine and homatropine in buckwheat have no set legal limits, these two TAs were validated in this method, since the occurrence data in food are limited, and more than 200 different TAs have been identified in various plants. Also, it is of utmost importance to monitor the presence of these plant toxins in buckwheat, to prevent accidental exposure of humans to TAs. To increase the database on the presence of TAs in food and assure food safety, new methods for the determination of TAs in buckwheat and other pseudocereals should be validated.
Occurrence of TAs in buckwheat commercial samples
Another objective of our experiment was to provide a preliminary estimation of the levels of TAs present in buckwheat products available in the Portuguese market. For that, 13 samples of different buckwheat-based products were analysed by the developed method. Each sample was extracted in duplicate.
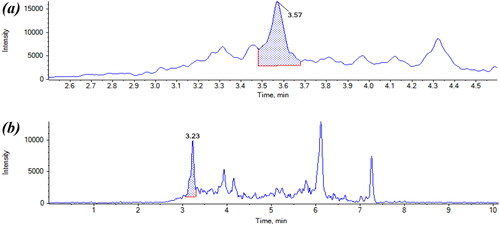
Atropine was found in one sample of 100% buckwheat-based galettes with a concentration of 2.13 µg kg−1 (). This level is lower than ML established for the sum of atropine and scopolamine (10 µg kg−1). Similar results are obtained by Marín-Sáez et al. (Citation2017) where atropine and scopolamine were detected in one buckwheat sample, but at concentrations below the LOQ (1 and 2 µg kg−1, respectively).
Homatropine was found in two samples. One of the samples corresponded to flakes, produced in France, with 1.92 µg kg−1 (). The other sample was a galette with buckwheat (80%) and other pseudocereals like quinoa (5%) and amaranth (5%) and it was found 0.98 µg kg−1 of homatropine. In this case, the presence of this TA could be due to the other ingredients. However, no limits are established for homatropine in any foodstuffs and no other studies reported its presence ().
Figure 8. (a) Chromatogram of buckwheat buckwheat-based galette contaminated with atropine and (b) chromatogram of buckwheat flake sample contaminated with homatropine.
In the EU, other authors have studied the presence of TAs in markets, following the EFSA requirements. In Spain, Chen et al. (Citation2017) assessed eight samples, including buckwheat, buckwheat flour and buckwheat pasta, and atropine and scopolamine were not detected, being the established LODs of 0.04 and 0.2 µg kg−1, respectively. Nevertheless, in Italy, 26 different buckwheat-derived organic food samples were collected by Cirlini et al. (Citation2018) and TAs were detected in three samples with high levels. For example, buckwheat flour was contaminated with 83.9 µg kg−1 of atropine and 10.4 µg kg−1 of scopolamine, exceeding the ML established, being a food safety concern.
The Rapid Alert System for Food and Feed (RASFF) reported, between January 2012 and December of 2023, 20 notifications for bio-contaminants in cereals and bakery products, most of them from organic cultures with origins in different countries: Italy, Spain, Germany, France, Netherlands, Bulgaria and South Africa (RASFF Window Citation2023a). In August 2021, one notification of high content of TAs in buckwheat flour from Austria, used in baking mixes in Germany, reported a level of 240 ± 97 µg kg−1 for atropine and 87 ± 35 µg kg−1 for scopolamine (RASFF Window Citation2021). More recently, in June 2023, the sum of atropine and scopolamine was 14.5 µg kg−1 in buckwheat flour from France (RASFF Window Citation2023b).
Currently, there are legal maximum limits for the presence of TAs in foods only in Europe. In Codex Alimentarius, TAs are not included in the list of food contaminants (Codex Alimentarius Commission Citation2023). However, in 2020, the FAO/WHO Expert Meeting suggested that adult health should be protected by a combined atropine and scopolamine content in dry food products of less than approximately 30 µg kg−1 in cereals (FAO/WHO Citation2020). This level goes higher than the European guidelines (10 µg kg−1 for the combined amount of atropine and scopolamine in buckwheat). Other countries should follow the EU initiative and set maximum levels for the occurrence of these plant toxins to ensure food safety.
The developed and validated method for the determination of TAs in buckwheat enables food safety authorities, manufacturers and researchers to accurately monitories the presence of TA contamination in buckwheat-based foods, enhancing global food safety standards and protecting public health. Further studies in more buckwheat samples should be carried out. Furthermore, the validation of this method could potentially be extended for other pseudocereals, such as quinoa or amaranth, which is rising in consumption, particularly in the EU.
Author contributions
ARSM: Methodology, software, validation, formal analysis, investigation, data curation, visualisation, writing—original draft. CC: Methodology, validation, investigation. SB: Writing—review and editing; AP: Supervision, writing—review and editing. ASS: Conceptualisation, methodology, investigation, resources, data curation, writing—review and editing, supervision, funding acquisition. All authors have read and agreed to the published version of the manuscript.
| Abbreviations | ||
| ACN | = | Acetonitrile |
| d-SPE | = | Dispersive solid-phase extraction |
| EC | = | European Commission |
| EFSA | = | European Food Safety Authority |
| EU | = | European Union |
| FAO | = | Food and Agriculture Organization |
| IS | = | Internal Standards |
| LC | = | Liquid chromatography |
| LOD | = | Limit of detection |
| LOQ | = | Limit of quantification |
| ME | = | Matrix effect |
| MEionisation | = | Matrix effect of ionisation |
| MeOH | = | Methanol |
| ML | = | Maximum level |
| MS | = | Mass spectrometry |
| PSA | = | Primary secondary amine-bonded silica |
| QuEChERS | = | Quick, Easy, Cheap, Effective, Rugged and Safe |
| R2 | = | Determination coefficient |
| RASFF | = | Rapid Alert System for Food and Feed |
| RSD | = | Relative standard deviation |
| TAs | = | Tropane alkaloids |
| ToF-MS | = | Time-of-flight mass spectrometry |
| UHPLC | = | Ultra-high performance liquid chromatography |
| WHO | = | World Health Organization |
Supplemental Material
Download MS Word (36.2 KB)Disclosure statement
No potential conflict of interest was reported by the author(s).
Additional information
Funding
References
- Adamse P, van Egmond HP, Noordam MY, Mulder PPJ, de Nijs M. 2014. Tropane alkaloids in food: poisoning incidents. Qual Assur Saf Crops Foods. 6(1):15–24. doi: 10.3920/QAS2013.0314.
- Caeiro C, Pragosa C, Cruz MC, Pereira CD, Pereira SG. 2022. The role of pseudocereals in celiac disease: reducing nutritional deficiencies to improve well-being and health. J Nutr Metab. 2022:8502169. doi: 10.1155/2022/8502169.
- Chan TYK. 2017. Worldwide occurrence and investigations of contamination of herbal medicines by tropane alkaloids. Toxins (Basel). 9(9):284. doi: 10.3390/toxins9090284.
- Chen H, Marín-Sáez J, Romero-González R, Garrido Frenich A. 2017. Simultaneous determination of atropine and scopolamine in buckwheat and related products using modified QuEChERS and liquid chromatography tandem mass spectrometry. Food Chem. 218:173–180. doi: 10.1016/j.foodchem.2016.09.075.
- Cirlini M, Cappucci V, Galaverna G, Dall’Asta C, Bruni R. 2019. A sensitive UHPLC-ESI-MS/MS method for the determination of tropane alkaloids in herbal teas and extracts. Food Control. 105:285–291. doi: 10.1016/j.foodcont.2019.05.030.
- Cirlini M, Demuth TM, Biancardi A, Rychlik M, Dall’Asta C, Bruni R. 2018. Are tropane alkaloids present in organic foods? Detection of scopolamine and atropine in organic buckwheat (Fagopyron esculentum L.) products by UHPLC–MS/MS. Food Chem. 239:141–147. doi: 10.1016/j.foodchem.2017.06.028.
- Codex AlimentariusCommission. 2023. General Standard For Contaminants and Toxins in Food and Feed. CXS 193-1995. Rome: Joint Food and Agriculture Organization of the United Nations (FAO) and World Health Organization (WHO) Food Standards Programme.
- Commission of the European Communities. 2002. Commission Decision of 12 August 2022 implementing Council Directive 96/23/EC concerning the performance of analytical methods and the interpretation of results. Off J Eur Communities. 221:8–36.
- Dusemund B, Schaefer B, Lampen A. 2018. Plant alkaloids. In: Encyclopedia of food chemistry. [place unknown]: Elsevier; p. 344–347. doi: 10.1016/B978-0-08-100596-5.21814-3.
- EFSA CONTAM Panel. 2013. Scientific opinion on tropane alkaloids in food and feed. EFSA J. 11(10):3386,113 pp. [Internet]. doi: 10.2903/j.efsa.2013.3386.
- European Commission. 2006a. Commission Regulation (EC) No. 1881/2006 of 19 December 2006 setting maximum levels for certain contaminants in foodstufs. Off J Eur Union. 364(1882):5–24.
- European Commission. 2006b. Commission Regulation (EC) No 401/2006 of 23 February 2006 laying own the methods of sampling and analysis for the official control of the levels of mycotoxins in foodstuffs. Off J Eur Union. 70(401):12–34. [Internet]. http://eur-lex.europa.eu/legal-content/EN/TXT/PDF/?uri=CELEX:32006R0401&qid=1490946469496&from=NL.
- European Commission. 2015. COMMISSION RECOMMENDATION (EU) 2015/976 of 19 June 2015 on the monitoring of the presence of tropane alkaloids in food. Off J Eur Union. 157(10):97–98. [Internet]. doi: 10.2903/j.efsa.2013.3386.
- European Commission. 2021. COMMISSION REGULATION (EU) 2021/1408 of 27 August 2021 amending Regulation (EC) No 1881/2006 as regards maximum levels of tropane alkaloids in certain foodstuffs. Off J Eur Union. 304(10):1–4. [Internet]. doi: 10.2903/j.efsa.2013.3386.
- FAOSTAT. 2022. Production/crops and livestock products/buckwheat. Food and Agriculture Organization of the United Nations. [Internet]. [accessed 2022 Sep 27]. https://www.fao.org/faostat/en/#data/QCL/visualize.
- FAO/WHO 2020. Joint FAO/WHO expert meeting on tropane alkaloids. [place unknown]: FAO. doi: 10.4060/cb1857en.
- Giménez-Bastida JA, Zieliński H. 2015. Buckwheat as a functional food and its effects on health. J Agric Food Chem. 63(36):7896–7913. [accessed 2022 Sep 30] doi: 10.1021/ACS.JAFC.5B02498/ASSET/IMAGES/MEDIUM/JF-2015-02498K_0004.GIF.
- Gonçalves C, Cubero-Leon E, Stroka J. 2020. Determination of tropane alkaloids in cereals, tea and herbal infusions: exploiting proficiency testing data as a basis to derive interlaboratory performance characteristics of an improved LC-MS/MS method. Food Chem. 331:127260. doi: 10.1016/J.FOODCHEM.2020.127260.
- Jandrić Z, Rathor MN, Švarc-Gajić J, Maestroni BM, Sasanya JJ, Djurica R, Cannavan A. 2011. Development of a liquid chromatography-tandem mass spectrometric method for the simultaneous determination of tropane alkaloids and glycoalkaloids in crops. Food Addit Contam Part A Chem Anal Control Expo Risk Assess. 28(9):1205–1219. doi: 10.1080/19440049.2011.584908.
- Kohnen-Johannsen K, Kayser O. 2019. Tropane alkaloids: chemistry, pharmacology, biosynthesis and production. Molecules. 24(4):796. doi: 10.3390/molecules24040796.
- Koval D, Plocková M, Kyselka J, Skřivan P, Sluková M, Horáčková Š. 2020. Buckwheat secondary metabolites: potential antifungal agents. J Agric Food Chem. 68(42):11631–11643. doi: 10.1021/acs.jafc.0c04538.
- Kruve A, Rebane R, Kipper K, Oldekop ML, Evard H, Herodes K, Ravio P, Leito I. 2015b. Tutorial review on validation of liquid chromatography-mass spectrometry methods: part I. Anal Chim Acta. 870(1):29–44. doi: 10.1016/j.aca.2015.02.017.
- Kruve A, Rebane R, Kipper K, Oldekop ML, Evard H, Herodes K, Ravio P, Leito I. 2015a. Tutorial review on validation of liquid chromatography-mass spectrometry methods: part II. Anal Chim Acta. 870(1):8–28. doi: 10.1016/j.aca.2015.02.016.
- Marín-Sáez J, Romero-González R, Garrido Frenich A. 2017. Multi-analysis determination of tropane alkaloids in cereals and solanaceaes seeds by liquid chromatography coupled to single stage Exactive-Orbitrap. J Chromatogr A. 1518:46–58. doi: 10.1016/j.chroma.2017.08.052.
- Martínez-Villaluenga C, Peñas E, Hernández-Ledesma B. 2020. Pseudocereal grains: nutritional value, health benefits and current applications for the development of gluten-free foods. Food Chem Toxicol. 137:111178. doi: 10.1016/j.fct.2020.111178.
- Mastovska K, Dorweiler KJ, Lehotay SJ, Wegscheid JS, Szpylka KA. 2010. Pesticide multiresidue analysis in cereal grains using modified QuEChERS method combined with automated direct sample introduction GC-TOFMS and UPLC-MS/MS techniques. J Agric Food Chem. 58(10):5959–5972. doi: 10.1021/jf9029892.
- Matuszewski BK, Constanzer ML, Chavez-Eng CM. 2003. Strategies for the assessment of matrix effect in quantitative bioanalytical methods based on HPLC − MS/MS. Anal Chem. 75(13):3019–3030. doi: 10.1021/ac020361s.
- Melo MG, Carqueijo A, Freitas A, Barbosa J, Silva AS. 2019. Modified QuEChERS extraction and HPLC-MS/MS for simultaneous determination of 155 pesticide residues in rice (Oryza sativa L.). Foods. 9(1):18. doi: 10.3390/foods9010018.
- Mulder PPJ, de Nijs M, Castellari M, Hortos M, MacDonald S, Crews C, Hajslova J, Stranska M. 2016. Occurrence of tropane alkaloids in food. EFSA Support. Publ. 13(12):EN-140, 200pp. doi: 10.2903/sp.efsa.2016.EN-1140.
- Nardin T, Piasentier E, Barnaba C, Larcher R. 2016. Targeted and untargeted profiling of alkaloids in herbal extracts using online solid-phase extraction and high-resolution mass spectrometry (Q-Orbitrap). J Mass Spectrom. 51(9):729–741. doi: 10.1002/jms.3838.
- Perestrelo R, Silva P, Porto-Figueira P, Pereira JAM, Silva C, Medina S, Câmara JS. 2019. QuEChERS - Fundamentals, relevant improvements, applications and future trends. Anal Chim Acta. 1070:1–28. doi: 10.1016/j.aca.2019.02.036.
- Perharič L, Koželj G, Družina B, Stanovnik L. 2013. Risk assessment of buckwheat flour contaminated by thorn-apple (Datura stramonium L.) alkaloids: a case study from Slovenia. Food Addit Contam Part A Chem Anal Control Expo Risk Assess. 30(2):321–330. doi: 10.1080/19440049.2012.743189.
- RASFF Window. 2021. Notification 2021.4323: high content of tropane alkaloids in buckwheat flour from Austria, used in baking mixes from Germany. European Commission. [Internet]. [accessed 2022 Sep 27]. https://webgate.ec.europa.eu/rasff-window/screen/notification/495136.
- RASFF Window. 2023a. Notifications of biocontaminants in cereals and bakery products. European Commissions. [Internet]. [accessed 2023 Nov 29]. https://webgate.ec.europa.eu/rasff-window/screen/search?searchQueries=eyJkYXRlIjp7InN0YXJ0UmFuZ2UiOiIyMDIyLTAxLTAxVDAwOjAwOjAwLjAwMFoiLCJlbmRSYW5nZSI6IjIwMjMtMDgtMzBUMjM6MDA6MDAuMDAwWiJ9LCJub3RpZmljYXRpb25TdGF0dXMiOnsibm90aWZpY2F0aW9uU3RhdHVzIjpbWzFdXX0sInByb2R1Y3QiOnsicHJvZHVjdENhdGVnb3J5IjpbWzE4NDM0XV19LCJyaXNrIjp7ImhhemFyZENhdGVnb3J5IjpbWzIxNzgyXV19fQ%3D%3D.
- RASFF Window. 2023b. Notification 2023.6326: tropanic alcaloids in buckwheat flour. European Commision. [Internet]. [accessed 2023 Nov 29]. https://webgate.ec.europa.eu/rasff-window/screen/notification/633529.
- Rejczak T, Tuzimski T. 2015. A review of recent developments and trends in the QuEChERS sample preparation approach. Open Chem. [Internet]. 13(1):980–1010. doi: 10.1515/chem-2015-0109.
- Ribeiro MMAC, Barreto DN, Flávio da S. Petruci J, Richter EM. 2022. Simultaneous determination of scopolamine and butylscopolamine in pharmaceutical and beverage samples by capillary zone electrophoresis. Microchem J. 172:106985. doi: 10.1016/j.microc.2021.106985.
- Romera-Torres A, Romero-González R, Martínez Vidal JL, Garrido Frenich A. 2018. Simultaneous analysis of tropane alkaloids in teas and herbal teas by liquid chromatography coupled to high-resolution mass spectrometry (Orbitrap). J Sep Sci. 41(9):1938–1946. doi: 10.1002/jssc.201701485.
- USDA FoodData Central. 2019. Buckwheat. United States Department of Agriculture. [Internet]. [accessed 2022 Sep 30]. https://fdc.nal.usda.gov/fdc-app.html#/food-details/170286/nutrients.
- Vuković G, Stojanović T, Petrović A, Konstantinović B, Puvača N, Marinković D, Špirović Trifunović B, Bursić V. 2021. Tropane alkaloids in mint teas at the Serbian market. Agro-knowl J A. 22(4):117–125. [Internet]. doi: 10.7251/AGREN2104117V.