
 ?Mathematical formulae have been encoded as MathML and are displayed in this HTML version using MathJax in order to improve their display. Uncheck the box to turn MathJax off. This feature requires Javascript. Click on a formula to zoom.
Abstract
Ragworts like tansy ragwort (J. vulgaris Gaertn., syn. Senecio jacobaea L.) contain hepatotoxic and cancerogenic pyrrolizidine alkaloids (PA) and their corresponding pyrrolizidine alkaloid N-oxides (PANO). Due to increasing spread of ragworts (Jacobaea spp.) PA/PANO may pose a health risk to animals and humans consuming contaminated feed and food. Therefore, the aim of the present study was to investigate the transfer of individual PA/PANO originating from a well-defined PA/PANO extract into the milk of dairy cows. For this objective, 16 German Holstein cows were assigned to four treatment groups (n = 4) in a 28-day dose-response study. Administration into the reticulorumen was performed daily by gavage after the morning milking. Three groups received different amounts of the J. vulgaris extract resulting in a PA/PANO exposure of 0.47, 0.95, or 1.91 mg PA/PANO/kg body weight/day, respectively. Furthermore, a control group received molasses to account for the sugar content of the used PA/PANO extract. While the composition of the PA/PANO extract was more diverse, the PA/PANO pattern in milk was dominated by the PA in their free base form. It was shown that mainly PA considered stable in the rumen environment were transferred into the milk. The main compounds in milk were jacoline (74.3 ± 2.4% of the PA/PANO sum), jaconine (11.2 ± 1.3%), and jacobine (7.2 ± 0.6%) with concentrations up to 29.7, 4.65 µg/l, or in the highest exposed group, 3.44 µg/l. There was no dose-dependent effect on the total PA/PANO transfer rate into the milk. The average transfer rate was 0.064 ± 0.005% of the administered content.
Introduction
Pyrrolizidine alkaloids (PA) and their corresponding N-oxides (PANO) are toxic secondary plant metabolites. It is estimated that they occur in about 6000 plant species worldwide and more than 600 isolated structures are known so far (Hartmann and Witte Citation1995). PA/PANO are mostly present in the plant families Asteraceae, Boraginaceae, Fabaceae and Orchidaceae, while tansy ragwort (Jacobaea vulgaris, Gaertn., syn. Senecio jacobaea, L.) is part of the Asteraceae family (Hartmann and Witte Citation1995; EFSA Citation2016).
Ragworts had spread rapidly in European countries in recent years (Leiss Citation2011) and poses a problem for agriculture. Domesticated grazing animals are known to avoid ragworts. However, an exposure of dairy cows to PA/PANO cannot be excluded in a situation of poor pasture management or by feeding PA/PANO contaminated preserved feed, especially hay (Candrian et al. Citation1984; Berendonk et al. Citation2010). Possible adverse health effects of PA/PANO intake are hepatotoxicity, developmental toxicity, genotoxicity and carcinogenicity (Fu et al. Citation2004; 1986; Stegelmaier Citation2004; EFSA Citation2016). While cattle are considered more susceptible among livestock animals, those effects are dose, time and species dependent (Cheeke and Pierson-Goeger Citation1983; Cheeke Citation1984; EFSA 2011).
PA/PANO can be categorised into four groups according to the necine base in their chemical structure: platynecine, retronecine, heliotridine and otonecine types. While platynecine type PA/PANO are seen as nontoxic, retronecine, heliotridine and otonecine type compounds share an unsaturated 1,2-double bond in their necine core structure, which is seen as prerequisite to reveal toxic properties. Examples of PA/PANO of the retronecine type are riddelliine (Ri), retrorsine (Re), senecionine (Sc), jacobine (Jb), jacoline (Jl), and seneciphylline (Sp), while senkirkine (Sk) belongs to the otonecine type (Fu et al. Citation2004; EFSA 2011).
The transfer rate of PA/PANO from plant material into milk depends on their toxicokinetics, including the release from the plant matrix in the digestive tract, the absorption through the gut wall, hepatic and extra-hepatic metabolism, the distribution in the body, and the fractional excretion via bile, faeces, urine, and milk (Mattocks et al. Citation1986; Geburek et al. Citation2020; Taenzer et al. Citation2022). In ruminants, the forestomach is a pre-systemic metabolism compartment. It was shown that PANO are rapidly metabolised to the corresponding free base and finally to numerous saturated, less or non-toxic metabolites (Cheeke Citation1988; Taenzer et al. Citation2022). While different PA were metabolised at different rates, Jl was found to be the most stable PA with respect to rumen metabolism (Taenzer et al. Citation2022).
Besides the PA/PANO metabolism in the rumen, the hepatic cytochrome P450 monooxygenases and other enzymes lead to further PA/PANO metabolism. Most notably, free PA bases are converted back to the N-oxides or transformed to pyrrolic esters, the reactive metabolites (Fu et al. Citation2004; Ruan et al. Citation2015). From the liver, PA and their metabolites, including PANO, enter either the systemic circulation or undergo biliary excretion and eventually entero-hepatic recirculation. The fraction entering the systemic circulation is distributed throughout the body and/or excreted in the urine via the kidney and/or in the milk via the blood-udder barrier.
The transfer of PA/PANO into the milk was already investigated in different studies (e.g. Dickinson et al. Citation1976; Hoogenboom et al. Citation2011; Mulder et al. Citation2020). Dickinson et al. (Citation1976) administered dried tansy ragwort (J. vulgaris) to four cows at a dosage of 10 g/kg body weight (BW)/day (d) for a period of two weeks. This comparatively high dosage resulted in a total transfer rate of about 0.1%. Hoogenboom et al. (Citation2011) calculated a total transfer rate of 0.1% for three cows fed with a mixture of dried ragwort (J. vulgaris and Senecio inaequidens) in increasing amounts (50–200 g/d) over three weeks. It was reported that individual PA/PANO had different transfer rates. Thereby, Jl showed the highest transfer rate with 4%. Furthermore, Mulder et al. (Citation2020) fed 200 g/d of a ragwort mixture (J. vulgaris, S. inaequidens), common groundsel (Senecio vulgaris) or viper’s bugloss (Echium vulgare) to three cows for four days. In this study, a total transfer rate of 0.05% and a transfer rate of 1.4% for Jl was calculated. However, most studies tested only one PA/PANO dose and the calculated exposure must be viewed critically as contaminated feed is a source of uncertainty, due to inhomogeneity or rejection of feed intake of the plant material.
Therefore, a dose-response study using a PA/PANO extract originating from J. vulgaris with known compounds and concentrations was performed to investigate the PA/PANO composition in milk and to determine their individual transfer rates into milk based on an exact exposure scenario.
Material and methods
Experimental design and milk sampling
The present study is part of a comprehensive study where a PA/PANO extract was fed to dairy cows in a dose-dependent manner (Knoop et al. Citation2023). The feeding trial was performed in agreement with the German Animal Welfare Act accepted by the Lower Saxony State Office for Consumer Protection and Food Safety (LAVES), Germany (file number 33.19-42502-04-19/3191) and is described in detail by Knoop et al. (Citation2023). In brief, 16 pluriparous, non-pregnant, lactating German Holstein cows were divided into four treatment groups (n = 4 per group) based on a similar milk yield and BW. During the trial, all cows received the same total mixed ration (TMR) consisting of maize silage (30%), grass silage (30%), and concentrate feed (40%) on a dry matter (DM) basis.
A PA/PANO extract with known concentration and composition (Knoop et al. Citation2023) was administered once daily (8 am) after the morning milking for a period of 28 days. For the groups PA/PANO-1, PA/PANO-2, and PA/PANO-3, the factual PA/PANO exposure was 0.47, 0.95, and 1.91 mg (PA/PANO)/kg BW/d, respectively. Thereby, group PA/PANO-3 received only the PA/PANO-extract, while groups PA/PANO-1 and PA/PANO-2 received the corresponding amount of PA/PANO extract mixed with molasses. The control group CONMolasses received a corresponding amount of molasses.
During the trial, the cows were milked twice daily in the morning (5 am) and in the evening (2 pm). The milk yield was measured automatically (Lemmer Fullwood GmbH, Lohmar, Germany) and BW was determined daily after leaving the milking parlour. Individual milk samples were taken before the start and during the trial on day 0 only in the evening after PA/PANO administration and on day 1, 2, 3, 4, 5, 6, 7, 10, 14, and 21 twice daily. The milk samples were immediately stored at −20 °C until analysis.
Determination of PA/PANO in the extract from tansy ragwort extract
The PA/PANO extract was analysed in parallel from by different institutions, the German Federal Institute for Risk Assessment (BfR) and the Ludwig-Maximilians-University of Munich (LMU). Prior to the LC-MS/MS measurement the PA/PANO extract was subsequently diluted with water/methanol (95/5, v/v) or pure water to dilutions ranging from 1:2000 up to 1:100,000, based on the weight of the original extract. Finally, the dilutions were filtered with a centrifugal filter (modified nylon 0.2 μm, VWR, Radnor, Pennsylvania) or through a syringe filter (0.2 μm, regenerated cellulose, Macherey-Nagel, Düren, Germany). The parameters of the LC-MS/MS measurements can be found in Knoop et al. (Citation2023) and Kaltner et al. (Citation2019). External calibration or standard addition was used for PA/PANO quantification. Detailed information on the validation of the method used at LMU can be found in the latter study.
Determination of PA/PANO in milk
Milk samples were analysed in duplicates according to Klein et al. (Citation2022) for Senecio-PA, their corresponding PANO, and their isomers (). For analysis, milk samples were thawed and homogenized by shaking. A liquid-liquid extraction with n-hexane and 2% aqueous formic acid was carried out. After centrifugation, the aqueous phase was cleaned by solid-phase extraction (Bond Elut Plexa PCX 200 mg Agilent, Waldbronn, Germany). The ammoniacal methanolic eluate was dried under nitrogen (50 °C), the residue was reconstituted in 500 µL methanol/water mixture (10/90, v/v) and membrane filtered (PVDF, 0.2 µm). The PA/PANO were analysed with liquid chromatography tandem mass spectrometry using a Shimadzu high performance liquid chromatography apparatus LC-20 (Shimadzu, Duisburg, Germany) and an API4000 triple quadrupole mass spectrometer (Sciex, Darmstadt, Germany). The chromatographic separation was performed on a Kinetex™ EVO C18 column (2.6 μm, 100 × 2.1 mm, 100 Å, Phenomenex, Aschaffenburg, Germany) with aqueous 10 mM ammonium carbonate buffer (pH 9.0, solvent A) and acetonitrile (solvent B) as mobile phases. PA/PANO was quantified via external matrix-matched calibration curve (0–10 µg/l). Blank milk, which had been collected before the PA/PANO extract was administered, was used for the preparation of the matrix-matched calibration standards. If analyte concentrations exceeded the calibrated range, the samples were diluted and quantified using an external matrix-matched calibration curve prepared in an equally diluted matrix. A methanol/water mixture (10/90, v/v) was used for dilution.
Table 1. Pyrrolizidine alkaloids (PA), PA-N-oxides (PANO), and corresponding isomers in milk, including limits of detection and quantification (LOD/LOQ [µg/l]) according to Klein et al. (Citation2022).
For calculation of the PA/PANO concentration in milk, PA/PANO of an isomer group were summed up.
To validate the method, repeatability (expressed as relative standard deviation) and average recovery rates were determined. For this purpose, blank milk was spiked to three different levels of PA/PANO concentration (0.05; 0.50; and 3.00 µg/L) with five repetitions each (n = 5) and analysed according to the milk samples. In addition, the linearity (expressed as correlation coefficient, R2) was evaluated according to SANTE/12682/2019 and using the Mandel’s F test. To assess the limit of detection (LOD) and limit of quantification (LOQ) for each PA/PANO, twelve equidistant concentrations ranging from 0.01 to 0.12 ng/mL and eleven equidistant concentration levels in the range from 0.2 to 1.2 ng/mL were established in blank milk extract. The LOD and LOQ were determined using the calibration curve method of DIN 32645 (Citation2008) with a probability of error of 1% and an uncertainty of 33.3%. Each individual LOD is related to the LOD of the less sensitive mass transition (qualifier) and the LOQ to that of the more sensitive mass transition (quantifier). Overall, recovery rates for the quantified PA/PANO ranged from 64% to 127% with relative standard deviations below 15% at all tested concentrations tested. For further information see Klein et al. (Citation2022).
Calculations
The analyte concentration in milk detected between the limit of detection (LOD) and the limit of quantification (LOQ) was reported as 0.5 times the LOQ (). Values below the LOD were set at 0.0 µg/l (Klein et al. Citation2022).
The weighted average daily toxin concentration (PA/PANO concentration) was calculated for the days 1, 2, 3, 4, 5, 6, 7, 10, 14, and 21 where two milk samples (morning milk, m; evening milk, e) were available. All PA/PANO concentrations in milk are presented as weighted average, except for the progression of the PA/PANO concentration of the morning and evening milking during the first week ().
The intake and excretion of the individual PA/PANO and the sum of PA/PANO and the resulting transfer rates into the milk were calculated as follows
For an estimation of the elimination half-life of selected PA/PANO in milk a linear regression approach was applied using the data of the individual PA/PANO concentrations in the evening and morning milk.
Statistics
The values were statistically analysed with the SAS software (version 9.4; SAS Institute Inc., Cary, NC, USA) using the MIXED procedure for repeated measures (Littell et al. Citation1998) and presented as least square means with standard error. By comparing the different covariance structures (compound symmetry (cs), variance components (vc), autoregressive (1) (AR (1)), and unstructured (un)) the best model was selected for the Akaike information criterion corrected for small sample sizes (AICC). In the model, the values ‘group’, ‘day’, and the interaction between both ‘group x day’ were implemented as fixed factors. Furthermore, the individual cows were set as random effect. Differences between values with p ≤ 0.05 were considered as significant, while values with p ≤ 0.1 were considered as tendencies. Due to individual PA/PANO concentrations < LOD the data set showed a high number of zero values. This phenomenon of zero inflation does not fit into a normal distribution. Therefore, the corresponding p-values were determined by performing a rank analysis beforehand, except for Jb, jacobine N-oxide (JbN), Jl, jacoline N-oxide (JlN), jaconine (Jn), Sk, and total PA/PANO. The calculations of the mean values, the standard error, as well as the outliers of the transfer rate of the individual PA/PANO into the milk (for graphical representation) were carried out using the Statistica programme (TIBCO Software Inc. (2020). Data Science Workbench, version 14).
Results
PA/PANO concentrations in the milk
Each detected PA/PANO as well as the total concentration in milk () showed a significant group effect or at least a tendency (p < 0.056). Thus, the PA/PANO levels detected in the milk samples of each dosing group correlated with the amounts of the PA/PANO extract administered to each dosing group. Due to the mean concentration calculated within each experimental group during the trial period, concentrations may be below the actual LOD (). The mean total PA/PANO concentration over time (weighted average) was 6.13 ± 1.60 µg/l, 11.77 ± 3.10 µg/l and 25.76 ± 5.24 µg/l for group PA/PANO-1, PA/PANO-2, and PA/PANO-3, respectively.
Table 2. Mean, minimum (min), and maximum (max) concentrations (µg/l) of individual PA/PANO in milk of the different dosing groups.
Comparing the concentration of PA and PANO, Jb, Jl, Jn showed a significantly higher milk concentration than their corresponding N-oxides. Re, on the other hand, was only present as a free base and not as an N-oxide. Ec, Ri, and Sp, as well as their corresponding N-oxides, were present in milk at low concentrations (<0.1 µg/l) and occurred in approximately equal amounts as free bases and corresponding N-oxides. The exception was ScN, which was present in milk at higher concentrations than the free base ().
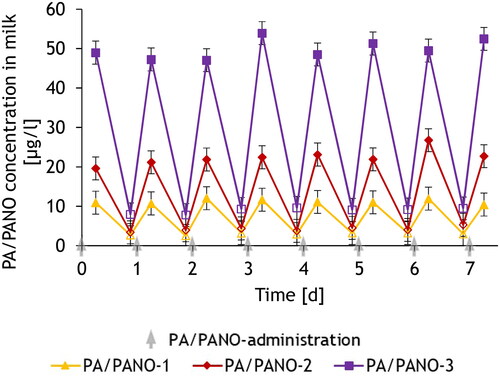
The mean total PA/PANO concentration in group PA/PANO-3 increased constantly from day 7 (), finally resulting in a significant dose-dependent effect over the time of the trial. Jl showed a similar progression like the total PA/PANO concentration, except that the concentration was highest in the PA/PANO-3 group on day 14 (). Jb and Jn also showed significant differences over time, characterised by an increase over the course of the experiment compared to day 1 (). However, a decrease in the concentration of Jn was observed in all dosing groups on day 7, whereby the concentration subsequently remained constant in the PA/PANO-1 and PA/PANO-2 groups, whereas the concentration increased again in the highest exposed group (). For all analytes, except Sk, the highest concentrations (maximum) were found in the highest exposed groups. Sk had the highest level in PA/PANO-2 (). Looking at the data for the first week separately for milking times (), the concentrations in the milk increased strongly within 6 h after PA/PANO administration in all groups. After further 15 h, the concentration in the milk decreased by 74.0%, 81.4%, and 82.0% compared to the concentration in the evening milk in group PA/PANO-1, PA/PANO-2, and PA/PANO-3, respectively. Although PA/PANO concentrations decreased steeply between the daily PA/PANO administrations, they were still detectable in the morning milk of the following day ().
Figure 1. The course of the concentrations of total PA/PANO (A), jacoline (B), jacobine (C), and jaconine (D) in milk of the different dosing groups (PA/PANO-1: 0.47 mg (PA/PANO)/kg BW/d; PA/PANO-2: 0.95 mg (PA/PANO)/kg BW/d; PA/PANO-3: 1.91 mg (PA/PANO)/kg BW/d) from day 1 to 21. Symbols represent least square means (n = 4) with standard error as whiskers.
*Significant (p < 0.05) difference from the value on day 1 within the group using a Tukey adjusted t-test.
p-values: Total PA/PANO: Group: p < 0.001, day: p < 0.001, group x day: p = 0.040; jacoline: Group: p < 0.001, day: p = 0.056, group x day: p = 0.834; jacobine: Group: p = 0.012, day: p < 0.001, group x day: p = 0.184; jaconine: Group: p = 0.001, day: p < 0.001, group x day: p = 0.143;
BW = body weight; d = day; PA = pyrrolizidine alkaloid; PANO = pyrrolizidine alkaloid N-oxide
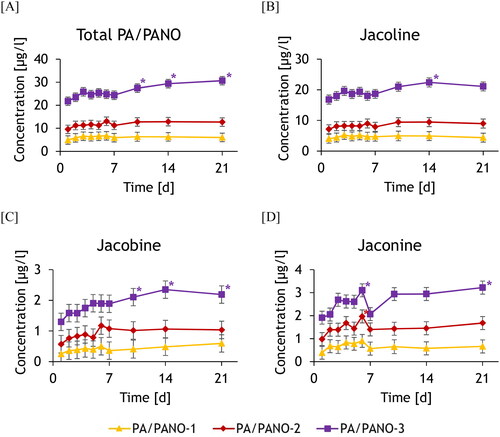
Figure 2. Time course of PA/PANO concentrations in milk of dairy cows differentiated in morning (outlined symbols) and evening milk (filled symbols) during the first seven days of the trial depending on PA/PANO dosing groups (PA/PANO-1: 0.47 mg (PA/PANO)/kg BW/d; PA/PANO-2: 0.95 mg (PA/PANO)/kg BW/d; PA/PANO-3: 1.91 mg (PA/PANO)/kg BW/d). The values are displayed as least square means (n = 4) with standard error as whiskers.
BW = body weight; d = day; PA = pyrrolizidine alkaloid; PANO = pyrrolizidine alkaloid-N-oxide
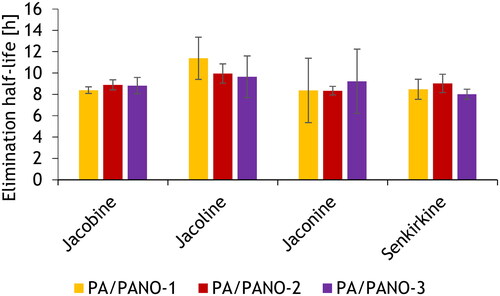
Applying a linear regression approach using all data of the PA/PANO concentrations in the evening and morning milk, the elimination half-lives for the main analytes were estimated. Thereby, the elimination half-lives for Jl were 11.4 ± 2.0 h, 10.8 ± 0.9 h and 9.6 ± 2.0 h, for Jb 8.4 ± 0.3 h, 8.9 ± 0.5 h and 8.8 ± 0.8 h, for Jn 8.4 ± 3.0 h, 8.3 ± 0.4 h, and 9.2 ± 3.0 h and for Sk 8.5 ± 0.9 h, 9.0 ± 0.9 h and 8.0 ± 0.5 h for the PA/PANO-1, PA/PANO-2, and PA/PANO-3 groups, respectively ().
Figure 3. Elimination half-life depending on PA/PANO dosing groups (PA/PANO-1: 0.47 mg (PA/PANO)/kg BW/d; PA/PANO-2: 0.95 mg (PA/PANO)/kg BW/d; PA/PANO-3: 1.91 mg (PA/PANO)/kg BW/d). The values are displayed as least square means with standard deviation as whiskers.
BW = body weight; d = day; PA = pyrrolizidine alkaloid; PANO = pyrrolizidine alkaloid-N-oxide
PA/PANO composition in milk
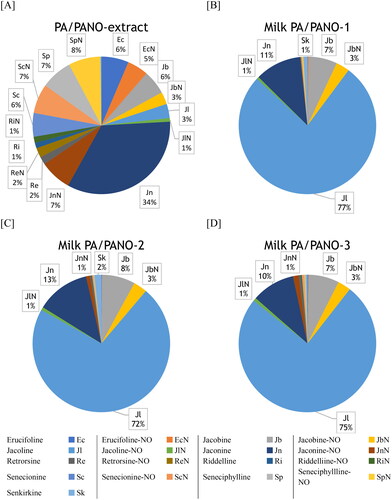
The PA/PANO extract contained both PA and PANO with Jn as main metabolite at 34%. The remaining composition of the extract was relatively evenly distributed between PA and PANO (). The PA/PANO pattern of the milk did not differ over time. Considering the mean values over time of all dosing groups (, [B-D]), Jl was the predominant PA with 74.6 ± 2.4%. The second-highest was Jn with 11.2 ± 1.2%, followed by Jb with 7.2 ± 0.6%. In addition, the corresponding PANO of these substances (JbN, JlN, jaconine N-oxide (JnN)) contributed in the range of 1%–3% (). Furthermore, Sk showed a proportion of more than 1% in groups PA/PANO-1 and 2. All PA/PANO, grouped with the corresponding isomers (), were detected at least once within every dose group, although not at all time points, with the exception of JnN in the lowest exposed group, which could not be detected at all ().
Figure 4. PA/PANO composition (%) of the PA/PANO extract as reported by Knoop et al. (Citation2023) and in milk of the different dosing groups (PA/PANO-1: 0.47 mg (PA/PANO)/kg BW/d; PA/PANO-2: 0.95 mg (PA/PANO)/kg BW/d; PA/PANO-3: 1.91 mg (PA/PANO)/kg BW/d). PA/PANO contributing <1% are not labelled.
BW = body weight; d = day; PA = pyrrolizidine alkaloid, NO = N-oxide
Transfer of PA/PANO into milk
The transfer rates reflect the individual PA/PANO concentrations in milk (). The main analytes, in particular Jl and Jb and their N-oxides, had the highest transfer rates ( and ). The calculated transfer rate of Jl as the main compound in milk was 1.417 ± 0.134% with a maximum of 2.772% (). Taken all analytes together, the mean total PA/PANO transfer rate amounted to 0.064 ± 0.005%. The main analytes in milk, Jb, Jl, Jn and Sk, as well as the total PA/PANO concentration showed significant time effects.
Figure 5. Transfer rates (%) of individual PA/PANO in milk of the three dosing groups PA/PANO-1 (0.47 mg (PA/PANO)/kg BW/d), PA/PANO-2 (0.95 mg (PA/PANO)/kg BW/d), and PA/PANO-3 (1.91 mg (PA/PANO)/kg BW/d) averaged over time.
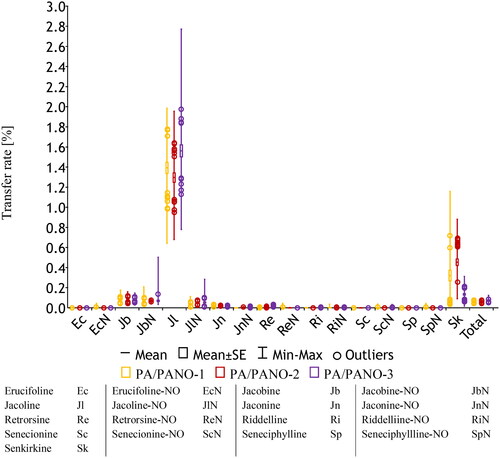
Table 3. Mean, minimum (min), and maximum (max) transfer rates (%) of individual PA/PANO in milk of the different dosing groups.
When comparing the transfer rates of PA and PANO, Jb, Jl, Jn, and Re showed higher values in the free bases than in the corresponding N-oxides, especially in the higher dosage groups. For Ec, Ri, Sp, and their corresponding N-oxides, the transfer rates of the free bases were comparable to those of the corresponding N-oxides. The transfer rate of ScN was higher than that of the free base ().
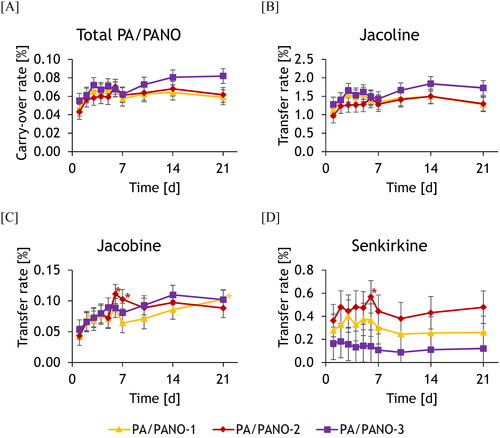
The mean transfer rate of PA/PANO in total and that of Jl and Jb () increased within the first 6 days of the trial in all groups, although there was a partial decrease on day 7. This resulted in all groups in significant differences in the transfer rate over time compared to day 1 within this period. The transfer rate of total PA/PANO in group PA/PANO-3 increased again from day 7 resulting in a significant time-dependent transfer rate (). Sk is an exception in terms of both the concentration and the transfer rate. The highest exposed group had the lowest transfer rates over the entire course of the experiment, whereby all transfer rates are characterized by a higher variation within the groups ().
Figure 6. Transfer rate (%) of PA/PANO in total (A), jacoline (B), jacobine (C), senkirkine (D) in milk of the different dosing groups (PA/PANO-1: 0.47 mg (PA/PANO)/kg BW/d; PA/PANO-2: 0.95 mg (PA/PANO)/kg BW/d; PA/PANO-3: 1.91 mg (PA/PANO)/kg BW/d) from day 1 to 21. Symbols represent least square means (n = 4) with standard error as whiskers.
*Significant (p < 0.05) difference from the value on day 1 within the group using a Tukey adjusted t-test.
p-values: PA/PANO: Group: p = 0.622, day: p < 0.001, group x day: p = 0.697; jacoline: Group: p = 0.534, day: p = 0.002, group x day: p = 0.924; jacobine: Group: p = 0.847, day: p < 0.001, group x day: p = 0.456; senkirkine: Group: p = 0.300, day: p = 0.002, group x day: p = 0.367;
BW = body weight; d = day; PA = pyrrolizidine alkaloid; PANO = pyrrolizidine alkaloid-N-oxide
Discussion
Although tansy ragwort (J. vulgaris) is not consumed by cows while grazing under normal circumstances, exposure can still occur through preserved feed like hay, where PA/PANO are known to be stable (Gottschalk et al. Citation2018; Kaltner et al. Citation2018). A study conducted in Belgium discovered that 23 of 40 feedstuffs for horses contained PA/PANO and detected concentrations of up to 411.4 µg/kg (Huybrechts and Callebaut Citation2015). A monitoring of animal forages (silage, grass, hay and alfalfa) by Mulder et al. (Citation2009) detected PA/PANO in 31 out of 147 samples with a maximal concentration in alfalfa (pellets/crumb) of 5,401 µg/kg DM. Furthermore, the EFSA published data with concentrations of up to 22,771 µg/kg in the feed category forages and roughage with a mean of 290 µg/kg from 252 measured samples (EFSA 2011).
Since there is a risk of the presence of PA/PANO in the feed intended for lactating cows, it is of particular interest to characterize the transfer into milk and to clarify whether and to what extent the exposure dose influences the transfer rate.
The present results are part of a comprehensive study. It was shown before that the administration of a well-defined PA/PANO extract at different dosages had no significant effects on body weight, milk yield or milk ingredients (Knoop et al. Citation2023). However, it was reported that over the course of the trial parameters indicating liver lesion (GGT, AST, and GLDH) increased in the highest exposed group. The liver is, besides the rumen, the main organ for PA/PANO metabolism. Hence, a damaged liver could lead to a disturbed metabolism and an altered PA/PANO transfer into milk.
The present results show that the profile of PA/PANO in milk is not dose-dependent. In comparison to the administered PA/PANO extract (Knoop et al. Citation2023), the PA pattern in milk was less diverse (). In the PA/PANO extract, Jl was present in only 3.34%, whereas in the milk it was the major component with more than 70%. The percentages of Jn in the milk were about one third less than in the PA/PANO-extract, while Jb showed approximately the same ratio in PA/PANO extract and milk. In summary, especially Jl but also Jb and Jn could be identified as main analytes in the milk after the exposure to the PA/PANO extract from tansy ragwort (J. vulgaris). This is consistent with previously published data. Hoogenboom et al. (Citation2011) reported that Jl was the major compound with a ratio of about 80% in milk, while in the fed ragwort mixture the percentage was less than 1%. The percentage of Jn in the milk, as the second main compound, is also comparable between the two studies (9.4 ± 2.9% (Hoogenboom et al. Citation2011) and 11.23 ± 1.24% ()). Mulder et al. (Citation2020) fed 200 g/d of a ragwort mixture (J. vulgaris, S. inaequidens), common groundsel (S. vulgaris) or viper’s bugloss (Echium vulgare) to dairy cows for 4 days and also observed Jl with the highest concentration in milk during the treatment with the ragwort mixture. Jb, JnN, Jn, and Sk were only detected in small amounts. Furthermore, Mulder et al. (Citation2020) showed the same concentration profile as in the present study, with a sharp increase after PA/PANO administration and a decrease before the next administration (). It should be noted that regardless of the dosage group, the PA/PANO were still not completely eliminated from the milk after 21 h.
PA/PANO undergo a series of metabolic processes particularly in the rumen and the liver. In the rumen, PANO are metabolised to free base PA. According to Taenzer et al. (Citation2022), PA were further metabolised at different rates to numerous metabolites, whereas Jl was the most stable PA in the rumen environment. Sk, Jn, and Jb were also proven to be relatively stable in the rumen.
Once absorbed, the PA/PANO first reaches the liver where they are subject to further metabolism, particularly through enzymes of xenobiotic metabolism. Cows showed, like humans, a comparably low PA biotransformation rate (Kolrep et al. Citation2018). Geburek et al. (Citation2020) incubated rat liver microsomes (RLM) and human liver microsomes (HLM) with different PA for 6 h and measured the remaining PA concentrations. Again, Jl was quite stable in both situations, when incubated with HLM and RLM. More than 90% of Jl could still be detected in both approaches after 6 h. There were considerable differences in the degradation of the other PA by HLM and RLM. Sk was relatively stable, too, with <60% of Sk still detectable after the incubation period in RLM, while in the HLM approach >30% of Sk was still present. Jb, on the other hand, was <20% present in the HLM after the incubation period and <40% detectable in the RLM after 6 h. Overall, most PA were metabolised more effectively by the RLM. Consequently, lower specificity of microsomes like in the RLM increased the likelihood of metabolising PA faster (Geburek et al. Citation2020). Hence, the metabolism in rumen and liver leads to the different PA/PANO profiles in milk in comparison to the PA/PANO source.
Apart from this, the detected PA, which are relatively resistant to metabolism, could be considered less of a toxicological concern, as toxic pyrroles might be formed to a lesser extent (Taenzer et al. Citation2022).
There were significant differences in the concentrations of Jb and Jn in milk over the course of the trial (). This is also reflected in the transfer rate, which increased at the beginning of the experiment (). The mean concentration increased between administrations until a ‘steady state’ was reached. In the study by Hoogenboom et al. (Citation2011), a relatively constant steady state was also quickly established in the evening milking. It is noticeable that those PA that are more resistant to metabolism (rumen and liver), such as Jl and Sk (Geburek et al. Citation2020; Taenzer et al. Citation2022), also reach higher concentrations in milk than less resistant PA (). The different concentrations of the individual PA/PANO and the resulting transfer rates are strongly influenced by toxicokinetic effects. This starts with the release of the PA/PANO from the plant material in the digestive tract, followed by absorption via the intestinal wall. In this aspect, the experiment differs from natural conditions, as a PA/PANO extract was administered. Rumen and liver metabolism also play a particularly important role. The remaining PA/PANO then either enter the systemic circulation, are biliary excreted, or not absorbed at all and excreted via faeces. Entero-hepatic recirculation is also conceivable. The fraction that enters the systemic circulation is distributed in the body and finally excreted via urine and milk. In order to enter the milk, the remaining PA/PANO must pass through the blood-udder barrier. As the blood-udder barrier acts very selectively, this step can have a major impact and could still influence the concentration of the individual PA/PANO in in the milk essentially.
In the present study, the free base form predominated over the N-oxides in the case of the main metabolites Jl, Jb, and Jn. However, other PA/PANO whose concentrations were closer to the LOQ showed more equal ratios. In the case of Sc and Ri, the N-oxide form (ScN or RiN) even exceeded the free base, irrespective of the dosing group. Lastly, PA like Ec and Sp showed dose-dependent ratios, with the N-oxides predominant at the lowest PA/PANO dosage ().
While in the 1976 study by Dickinson et al. no PANO were analysed in the milk, in the studies by Hoogenboom et al. (Citation2011) and Mulder et al. (Citation2020) no PANO were detected in the milk. In contrast to these studies, Mulder et al. (Citation2020) detected N-oxides, mainly JbN, in the milk of cows treated with ragwort. In contrast to the present study, Hoogenboom et al. (Citation2011) and Mulder et al. (Citation2020) used lower dosages (0–460 and 780 mg/d, respectively) compared to the dosage range of 306–1242 mg/d in the current study. In addition, the LOQ was generally higher in the aforementioned studies (ranging from 0.06 to 0.2 µg/l). This difference in LOQ may explain the variable presence of PANO in the milk and why more PANO was detected in the present study than in previous studies.
It was also assessed whether the BW or the milk yield of individual dairy cows in each group had an influence on the PA/PANO concentration in milk (data not shown). However, no correlation was found between these parameters.
Hoogenboom et al. (Citation2011) measured the PA/PANO concentration in milk after the administration stopped. For these data the elimination half-lives from milk were calculated with a mono-exponential pharmacokinetic approach and were 8 h for Jl, 8 h for Jb, 6 h for Jn and 16 h for Sk. In the present study, mean elimination half-lives were calculated using a linear regression approach. Hereby, Jl showed the highest elimination half-live with about 10.6 h followed by Jb with 8.7 h, Jn with 8.6 h and Sk with 8.5 h. With the exception of Sk, the elimination half-lives are in the same range as calculated by Hoogenboom et al. (Citation2011), although the present approach provides only rough estimates.
Individual PA/PANO showed different transfer rates into the milk (). The main compound Jl showed the highest transfer rate with a mean of 1.417 ± 0.134%. The mean transfer rate of total PA/PANO was 0.064 ± 0.005%. This is similar to previous studies. Hoogenboom et al. (Citation2011) and Dickinson et al. (Citation1976) showed a total transfer rate of 0.1%, while Mulder et al. (Citation2020) calculated a total transfer rate of 0.05% and for Jl a transfer rate of 1.4%. In contrast, Candrian et al. (Citation1991) administered a single dose of 547 mg radiolabelled Sp perorally to one cow. The measured transfer rate of Sp was 0.16%, while in the present study the mean transfer rate of Sp was 0.001 ± 0.001% (). It should be noted that, in comparison, the administration of Sp by the PA/PANO extract was significantly lower. It is therefore important to consider the source of the PA/PANO as well as the amount administered and the method of administration.
Due to the metabolism, which mainly takes place in the rumen and liver, the administered PA/PANO were not directly transferred to the milk. It may therefore be useful to calculate the transfer rate based on the sum parameters (PA + corresponding PANO). The study by Hoogenboom et al. (Citation2011) also assumed these differences and calculated a transfer rate for Jl of 4% when Jl and its corresponding N-oxide (JlN) were calculated together, and a transfer rate of 7% when only Jl was considered. In the present study, however, this large difference could not be demonstrated, because JlN was only present at low levels in both the extract and the milk (approx. 1% in each). Furthermore, N-oxides with a higher content in the extract, such as EcN, SpN and JnN, were hardly detectable in the milk (<LOQ), so that even with these PA only small percentage changes occurred in relation to the individual calculations of the transfer rates.
Conclusion
The composition of milk is characterised by those PA that are most stable to the rumen and liver metabolism, with Jl, Jn and Jb being the main analytes. Therefore, Jl may be a suitable marker in milk for inferring exposure based on transfer rates. The rumen metabolism as well as the liver metabolism leads to a change in the profile of individual PA/PANO from the PA/PANO source into the milk. The amount of PA/PANO transferred to milk was dose-dependent, which means that a higher PA/PANO exposure led to a higher concentration of PA/PANO in the milk. Furthermore, it has to be mentioned, that a different PA/PANO source may lead to a different PA/PANO profile in milk. The individual PA/PANO transfer rates were dose-independent, as they were in total not influenced by the administered amount of PA/PANO. Although the total transfer rate of 0.064% ± 0.005% seems relatively low, even low concentrations of toxic and carcinogenic substances should be considered. Nevertheless, the detected more stable PA appears to be of less toxicological concern compared to e.g. Re. In order to reduce the exposure of animals and humans to genotoxic and carcinogenic substances, the contamination of preserved feed with ragworts should be kept to a reasonable minimum. Overall, the data for ragworts have been significantly expanded in the present study, but more data are still missing, especially for the other plant families and non-Senecio-PA, as it can be seen that the transfer is PA/PANO-individual. In conclusion, more research on the toxicology of individual PA/PANO is needed to assess the risk of the transferred analytes.
Acknowledgment
The authors gratefully acknowledge the skilful technical assistance of Michaela Freitag, Carmen Piller, Sebastian Schlef, and René Mamet.
Disclosure statement
No potential conflict of interest was reported by the authors.
Additional information
Funding
References
- Berendonk C, Cerff D, Hünting K, Wiedenfeld H, Becerra J, Kuschak M. 2010. Pyrrolizidine alkaloid level in Senecio jacobaea and Senecio erraticus - the effect of plant organ and forage conservation. Proceedings of the 23rd General Meeting of the European Grassland Federation, Grassland in a Changing World, Kiel, Germany. 15:669–671.
- Candrian U, Luethy J, Schmid P, Schlatter C, Gallasz E. 1984. Stability of pyrrolizidine alkaloids in hay and silage. J Agric Food Chem. 32(4):935–937. doi: 10.1021/jf00124a057.
- Candrian U, Zweifel U, Luethy J, Schlatter C. 1991. Transfer of orally administered 3H-seneciphylline into cow’s milk. J Agric Food Chem. 39(5):930–933. doi: 10.1021/jf00005a026.
- Cheeke PR. 1984. Comparitive toxicity and metabolism of pyrrolizidine alkaloids in ruminants and nonruminant herbivores. Can J Anim Sci. 64(5):201–202. doi: 10.4141/cjas84-224.
- Cheeke PR. 1988. Toxicity and metabolism of pyrrolizidine alkaloids. J Anim Sci. 66(9):2343–2350. doi: 10.2527/jas1988.6692343x.
- Cheeke PR, Pierson-Goeger ML. 1983. Toxcicity of Seneccio jacobea and pyrrolizidine alkaloids in various laboratory animals and avian species. Toxicol Lett. 18(3):343–349. doi: 10.1016/0378-4274(83)90116-9.
- Dickinson JO, Cooke MP, King RR, Mohamed PA. 1976. Milk transfer of pyrrolizidine alkoloids in cattle. J Am Vet Med Assoc. 169(11):1192–1196.
- DIN 32645. 2008. Chemical analysis decision limit, detection limit and determination limit under repeatability conditions - terms, method, evaluation. Berlin: Beuth Verlag GmbH.
- EC. 2019. Analytical quality control and method validation procedures for pesticide residues analysis in food and feed (SANTE/12682/2019).
- EFSA Panel on Contaminants in the Food Chain (CONTAM). 2011. Scientific opinion on pyrrolizidine alkaloids in food and feed. EFSA J. 9(11):2406.
- European Food Safety Authority (EFSA). 2016. Dietary exposure assessment to pyrrolizidine alkaloids in the European population. EFSA J. 14(8):e04572.
- Fu PP, Xia Q, Lin G, Chou MW. 2004. Pyrrolizidine alkaloids—genotoxicity, metabolism enzymes, metabolic activation, and mechanisms. Drug Metab Rev. 36(1):1–55. doi: 10.1081/dmr-120028426.
- Geburek I, Preiss-Weigert A, Lahrssen-Wiederholt M, Schrenk D, These A. 2020. In vitro metabolism of pyrrolizidine alkaloids: metabolic degradation and GSH conjugate formation of different structure types. Food Chem Toxicol. 135:110868. doi: 10.1016/j.fct.2019.110868.
- Gottschalk C, Ostertag J, Meyer K, Gehring K, Thyssen S, Gareis M. 2018. Influence of grass pellet production on pyrrolizidine alkaloids occurring in Senecio aquaticus—infested grassland. Food Additives Contaminants Part A. 35(4):751–760. doi: 10.1080/19440049.2018.1430901.
- Hartmann T, Witte L. 1995. Chapter four - chemistry, biology and chemoecology of the pyrrolizidine alkaloids. In: S. W. Pelletier, editor. Alkaloids: Chemical and Biological Perspectives; Vol. 9. Pergamon; p. 155–233.
- Hoogenboom LAP, Mulder PPJ, Zeilmaker MJ, van den Top HJ, Remmelink GJ, Brandon EFA, Klijnstra M, Meijer GAL, Schothorst R, Van Egmond HP. 2011. Carry-over of pyrrolizidine alkaloids from feed to milk in dairy cows. Food Additives & Contaminants: part A. 28(3):359–372. doi: 10.1080/19440049.2010.547521.
- Huybrechts B, Callebaut A. 2015. Pyrrolizidine alkaloids in food and feed on the Belgian market. Food Additives Contaminants: Part A. 32(11):1939–1951. doi: 10.1080/19440049.2015.1086821.
- Kaltner F, Rychlik M, Gareis M, Gottschalk C. 2018. Influence of storage on the stability of toxic pyrrolizidine alkaloids and their N-oxides in peppermint tea, hay, and honey. J Agric Food Chem. 66(20):5221–5228. doi: 10.1021/acs.jafc.7b06036.
- Kaltner F, Stiglbauer B, Rychlik M, Gareis M, Gottschalk C. 2019. Development of a sensitive analytical method for determining 44 pyrrolizidine alkaloids in teas and herbal teas via LC-ESI-MS/MS. Anal Bioanal Chem. 411(27):7233–7249. doi: 10.1007/s00216-019-02117-1.
- Klein LM, Gabler AM, Rychlik M, Gottschalk C, Kaltner F. 2022. A sensitive LC–MS/MS method for isomer separation and quantitative determination of 51 pyrrolizidine alkaloids and two tropane alkaloids in cow’s milk. Anal Bioanal Chem. 414(28):8107–8124. doi: 10.1007/s00216-022-04344-5.
- Knoop K, Knappstein K, Kaltner K, Gabler AM, Taenzer J, These A, Kersten S, Meyer U, Frahm J, Kluess J, et al. 2023. Short-term exposure of dairy cows to pyrrolizidine alkaloids from tansy ragwort (Jacobaea vulgaris Gaertn.): effects on health and performance. Arch Anim Nutr. 77(5):363–384. doi: 10.1080/1745039X.2023.2261806.
- Kolrep F, Numata J, Kneuer C, Preiss-Weigert A, Lahrssen-Wiederholt M, Schrenk D, These A. 2018. In vitro biotransformation of pyrrolizidine alkaloids in different species. Part I: microsomal degradation. Arch Toxicol. 92(3):1089–1097. doi: 10.1007/s00204-017-2114-7.
- Leiss KA. 2011. Management practices for control of ragwort species. Phytochem Rev. 10(1):153–163. doi: 10.1007/s11101-010-9173-1.
- Littell RC, Henry P, Ammerman CB. 1998. Statistical analysis of repeated measures data using SAS procedures. J Anim Sci. 76(4):1216–1231. doi: 10.2527/1998.7641216x.
- Mattocks AR, Driver HE, Barbour RH, Robins DJ. 1986. Metabolism and toxicity of synthetic analogues of macrocyclic diester pyrrolizidine alkaloids. Chem Biol Interact. 58(1):95–108. doi: 10.1016/s0009-2797(86)80089-8.
- Mulder PPJ, Beumer B, Oosterink JE, De Jong J. 2009. Dutch survey pyrrolizidine alkaloids in animal forage (No. 2009.018). Netherlands: RIKILT-Institute of Food Safety.
- Mulder PP, Klijnstra MD, Goselink RM, van Vuuren AM, Cone JW, Stoopen G, Hoogenboom RL. 2020. Transfer of pyrrolizidine alkaloids from ragwort, common groundsel and viper’s bugloss to milk from dairy cows. Food Additives & Contaminants: part A. 37(11):1906–1921. doi: 10.1080/19440049.2020.1798028.
- Ruan J, Gao H, Li N, Xue J, Chen J, Ke C, Ye Y, Fu PP, Zheng J, Wang J, et al. 2015. Blood pyrrole-protein adducts—a biomarker of pyrrolizidine alkaloid-induced liver injury in humans. Journal of Environmental Science and Health, Part C. 33(4):404–421. doi: 10.1080/10590501.2015.1096882.
- Stegelmaier B. 2004. Pyrrolizidine alkaloids. In: Clinical veterinary Toxicology. St. Louis, MO, USA: Mosby Inc.
- Taenzer J, Gehling M, Klevenhusen F, Saltzmann J, Dänicke S, These A. 2022. Rumen metabolism of Senecio pyrrolizidine alkaloids may explain why cattle tolerate higher doses than monogastric species. J Agric Food Chem. 70(33):10111–10120. doi: 10.1021/acs.jafc.2c01332.