
Abstract
Processed plant-based foods, particularly high carbohydrate-containing foods, are among the greatest contributors to dietary acrylamide, a probable human carcinogen, uptake. Between 2009 and 2020, five surveys were conducted to determine acrylamide in high carbohydrate-containing foods in Canada. These surveys included sampling of potato and sweet potato chips, French fries, and frozen potato/sweet potato products, as a follow-up to our earlier surveys from 2002 - 2008. Samples were analyzed using isotope dilution (13C3-acrylamide) with LC-MS/MS. The highest mean acrylamide levels were found in sweet potato chips. Among potato chips (57 to 4660 ng g−1), one brand consistently showed the highest concentrations with wide variability. Acrylamide concentrations decreased over time in ready-to-eat French fries (from 480 to 358 ng g−1), and one brand showed a clear reduction temporally. Wide variations were observed among brands, among lots/outlets of same brands, and among different food chains. Acrylamide levels in potato chips decreased between 2009 and 2016 (504.3 ng g−1) relative to the period 2002 - 2008 (1096.9 ng g−1). The acrylamide trends observed in the products measured in the latest study indicate that food producers may have adopted mitigation strategies.
Introduction
Although rarely found in raw food ingredients, acrylamide is detected in a wide variety of processed food products, including potato and sweet potato fries, chips, breakfast cereals, crispbreads and biscuits, roasted coffee, instant coffee, and chocolate products, that are part of the daily diets worldwide (Becalski et al. Citation2003; Kafouris et al. Citation2018; Abt et al. Citation2019; Deribew and Woldegiorgis Citation2021). Food products that are derived from plant-based ingredients such as potatoes and cereals likely to contain the highest amounts of acrylamide due to the presence of high content of acrylamide precursors (glucose/fructose and asparagine) in their raw materials (Lineback et al. Citation2012). Acrylamide is produced during frying, broiling, baking, roasting, grilling, and toasting when carbohydrate-rich foods are heated at high temperatures (>120 °C) (Törnqvist Citation2005). Acrylamide formation is also affected by the duration of cooking, moisture, and pH as well as the storage conditions. A cross-sectional (2013–2016) survey conducted among 4418 participants in the US found that processed foods (such as bread, cakes, breakfast cereals, salty snacks, French fries, reconstituted meats, etc.), which are potential sources of acrylamide, contributed to 57.5% of overall dietary energy (Martínez Steele et al. Citation2023). Because of its presence in foods commonly consumed worldwide, dietary exposures to acrylamide and its potential impact to health, have been a concern since its detection in foods (Tareke et al. Citation2002).
After discovering acrylamide in food (Tareke et al. Citation2002) and because of its presence in popular food items, numerous chemical and toxicological studies have been conducted to understand the potential impact of acrylamide exposure to human health. It is found that acrylamide and its active metabolite glycidamide (GA) possess clastogenic and mutagenic properties (EFSA 2022). In addition, acrylamide exposure causes selective neurotoxicity in humans (i.e. following occupational exposure) and laboratory animals (LoPachin Richard and Gavin Citation2012). Although there was no clear evidence of cancer in humans, the International Agency for Research on Cancer (IARC) classified acrylamide as a probable human carcinogen (Group 2 A) based on evidence in experimental animals and supporting mechanistic information (IARC Citation1994). Other national and international agencies have also identified it as a potential human carcinogen (JECFA Citation2011; NTP Citation2011). Although animal studies have showed clear evidence of the carcinogenic activity of acrylamide, available epidemiological and toxicological evidence are insufficient to link dietary acrylamide exposure to human cancer risk (Mucci et al. Citation2003; Hogervorst et al. Citation2007; Lineback et al. Citation2012; Virk-Baker et al. Citation2014; Graff et al. Citation2018; EFSA 2022).
Various mitigation strategies have been developed and adopted by the industry to reduce acrylamide content in processed foods (Hendriksen et al. Citation2009; Pedreschi et al. Citation2014; Rapp et al. Citation2018; Oddy et al. Citation2023). To assess the effectiveness of mitigation strategies, it is important to understand acrylamide temporal trends in food products. Routine surveys of food products over time help to track the trend of acrylamide levels and thus dietary exposure (Health Canada’s Revised Exposure Assessment of Acrylamide in Food: Health Canada (HC) Citation2012). This work allows for determination of how much impact the mitigation strategies adopted by food manufacturers have had on the final food products. The present study was, therefore, undertaken to determine acrylamide concentrations in different potato/sweet potato-based food products commercially available in Canada and known to be potential sources of acrylamide exposure. Acrylamide concentrations were measured in different food products from 2009 to 2020 and compared with previously published data (2002–2008) (Becalski et al. Citation2010) to interpret acrylamide trend over a longer time period. The data generated in this study will help to evaluate the effectiveness of mitigation strategies may be adopted by food industry.
Materials and methods
Chemicals
Dichloromethane (pesticide grade) and methanol (HPLC grade) were obtained from EM Science (Gibbstown, NJ). Water was obtained from Millipore Milli-Q Gradient A10 (Billerica, MA) purification system. Acrylamide (≥ 99%) was from Aldrich (St. Louis, MO) and 13C3 (98%) labeled standard of acrylamide (CLM-813) was from Cambridge Isotope Laboratories (Andover, MA). All stock acrylamide solutions and calibration solutions were prepared in water. Working standard solutions were stored at 4 °C while the stock was kept frozen below -10 °C.
Samples
Potato chips (potato crisps in Europe) and French fries are known to be among the top contributors to dietary exposure to acrylamide because of their high carbohydrate content (Acrylamide in food: Health Canada (HC) Citation2021; Oddy et al. Citation2023) and are widely consumed by Canadians of several age groups. Sampling plans were designed for the present study to include potato/sweet potato-based products. Efforts were made to choose the same brands and products during the presently described surveys as those tested in the earlier work. Convenience sampling was performed from retail locations in Ottawa; sampling was conducted only in this city as most of the national and US brands were available. Potato chips (85 samples from seven brands) comprised chips made from sliced potatoes and chips that were extruded and baked. For sweet potato chips, 11 samples from two brands were collected. French fries were sampled as ready-to-eat, from three national fast-food chains, and frozen. Sample sizes for ready-to-eat French fries and frozen fries were 27 and 41 (from six brands), respectively. Monitoring of acrylamide levels in potato chips began in 2002, and broader categories of potato/sweet potato-related products were added to the acrylamide follow-up surveys in 2009–2020.
Sample preparation
Entire bags of potato chips were homogenized in a blender, stored frozen and subsamples were analyzed. All products were sampled in three replicates (when possible) to ascertain lot-to-lot variability.
Ready-to-eat French fries were purchased from eight outlets during the 2009 and 2014 surveys, followed by sample homogenization using a Waring blender and stored in 250 mL pre-cleaned glass jars with Teflon lined covers (I-Chem brand) and kept in a freezer at < −10 °C until analysis.
In 2020, 41 frozen samples were collected and among them, there were only 3 brands (seven samples) of sweet potato products and 16 different types of potato products. All products were prepared following manufacturers’ instructions, as indicated on the label. Briefly, samples were baked on a non-stick baking sheet at 218 or 232 °C (425 or 450 °F). Following cooking (and cooling), samples were homogenized using a Waring blender and stored in 250 mL pre-cleaned glass jars with Teflon lined covers (I-Chem brand) and kept in a freezer at < −10 °C until analysis.
Analysis
2.0 g of the ground samples were homogenized with Milli Q water (24 mL) and spiked with 16 µL of 250 ng g−1 of the 1,2,3-13C3-acrylamide standard. The sample was extracted with 10 mL dichloromethane to remove non-polar matrix components and centrifuged in a refrigerated centrifuge (RC-2B) for 2-hr 15,000 rpm. To remove high molecular weight matrix components, the aqueous supernatant was transferred to a (5 kDa) centrifugal filter and ultra-filtered at 4 °C. An aliquot of the filtrate was subjected to a two-stage solid phase extraction (SPE) process. The first stage SPE was performed on a Waters Oasis HLB SPE cartridge (Waters corporation, Milford, MA), followed by the second phase on an Agilent Bond Elut AccuCAT SPE cartridge (200 mg 3 mL; Agilent, Palo Alto, CA). The former cartridge contains a polymeric reversed-phase sorbent, whereas the latter cartridge contains both a strong cation as well as an anion exchange sorbent. An aliquot of the resulting elute was used for liquid chromatography/electrospray tandem mass spectrometry (LC-MS/MS) analysis.
Samples were processed in sets consisting of up to 12 and each set included one randomly selected sample from each set, spiked with native acrylamide at 250 ng g−1, one or two method blanks, and one or two control samples of Food Analysis Performance Assessment Scheme (FAPAS) test materials (#T3051, #T3075, and T#3089) (Food and Environment Research Agency, Sand Hutton, York, UK). Spiked samples and FAPAS test materials were included for quality control/method performance assessment.
LC-MS/MS analysis
For sample extracts and calibration standards analyses (Becalski et al. Citation2004), three different systems were used. In 2009, an Agilent 1100 liquid chromatograph (Agilent, Palo Alto, CA) coupled to a triple quadrupole tandem mass spectrometer, Quattro-Ultima (Micromass Inc., Manchester, UK) was used briefly. Then analyses were switched onto Waters Acquity ultra-high pressure liquid chromatograph coupled to a Quattro Premier XE triple quadrupole mass spectrometer (Waters Corporation, Milford, MA, USA). Analytical separation was achieved with a Thermo-Hypersil analytical column, Aquasil C18 (2.1 × 250 mm, 5 µm) at 23 °C. Samples were eluted from the column in isocratic mode using a mobile phase of 12% methanol in 1 mM ammonium formate with a flow rate of 0.175 mL/min. The injection volumes were 10 µL. Acrylamide retention time was 5.5 min under these chromatographic conditions. The samples from 2020 survey were analyzed with Shimadzu UHPLC coupled to a SCIEX QTRAP 6500+ Quadrupole MS/MS (SCIEX, Framingham, MA, USA). A Restek Allure Acrylamide column (2.1 × 50 mm, 5 µm; Restek, Bellefonte, PA) was used for sample separation. Samples were eluted from the column in isocratic mode using a mobile phase of 15% methanol/0.1% acetic acid/water with a flow rate of 0.4 mL/min. The injection volume was 6 µL. Acrylamide retention time was 0.85 min under these chromatographic conditions.
The mass spectrometer was operated in positive ionization with multiple reaction monitoring (MRM) mode. Acrylamide was analyzed by isotope dilution method and quantitated using m/z 72 → 55 transition for the native form of acrylamide and m/z 75 → 58 transition for 1,2,3-13C3-Acrylamide. The m/z 72 → 54 transition was used as the primary confirmation transition for acrylamide. Concentrations of acrylamide in foods were expressed as ng g−1 sample weight, calculated from a seven-point calibration curve (1, 5, 10, 25, 100, 500, and 1000 ng L−1 acrylamide, respectively). The limit of detection (LOD) was determined from acrylamide standard injected on-column, based on a signal to noise ratio of 3:1, equivalent to approximately 3 ng g−1 in the samples. The limit of quantification (LOQ) was calculated as three times the LOD value (10 ng g−1). However, both LOD and LOQ were lower in 2020 analysis (0.3 and 1.0 ng g−1, respectively).
Statistical analysis
Statistical analyses were performed in Microsoft Excel. Data were expressed as mean ± standard deviation (SD). Student’s t test was used to determine significant differences between means.
Results and discussion
Quality assurance/quality control
Acrylamide was not detected in any of the blanks above the LOQ (10 ng g−1). Results of all FAPAS test materials (#T3051, #T3075, and #T3089) were within the acceptable range. For example, the assigned value and acceptable range of #T3089 were 206 ng g−1 and 122 – 289 ng g−1, respectively. A mean concentration of 218 ng g−1 with a standard deviation of 15.9 ng g−1 were determined for this test material. The z-scores for all three test materials were 0.5. The average recovery of spiked samples from each of the different surveys from 2009 to 2020 were in the range of 91.2% (2020)–104% (2016).
Potato chips
The acrylamide concentration in potato chips of 2009–2016 surveys ranged from 57 to 4660 ng g−1; wide variations observed between brands, within brands over time, and between lots of the same brand in the same year. Most variation over time was observed in Brand A1, which had the lowest (278 ng g−1) and the highest (4660 ng g−1) acrylamide concentrations in 2010 and 2009, respectively (, Suppl Figure 1). However, an overall decrease in concentration was observed over time in this brand, from 2179.5 ± 2081.6 ng g−1 in 2009 to 382.0 ± 36.8 ng g−1 in 2016 (median 429.5 ng g−1). Unlike Brand A1, Brand A2 did not show any pattern in acrylamide concentration over time, with concentrations ranging from 195 to 862 ng g−1 (median 315.5 ng g−1) (, Suppl Fig.1) with the highest concentration in 2014 and the lowest in 2016. For brand A3, the lowest acrylamide concentration (152 ng g−1) was in 2014, while the highest (389 ng g−1) was in 2016. Although average concentration (278.6 ± 71.7 ng g−1, median 278.0 ng g−1) was much lower compared with some other brands, A3 brand products did not show any clear pattern over time (, Suppl Figure 1). Although brand A4 products had comparatively lower concentrations (296.3 ± 141.5 ng g−1, median 245.0 ng g−1), its concentration increased in 2016 compared to other years in which it was analyzed (2009, 2010 and 2014). Acrylamide concentrations in Brand A5 was 552.6 ± 202.6 ng g−1 (median 607.5 ng g−1), however, the concentration was higher in both 2010 and 2016 than in 2009 (, Suppl Figure 1). We could not include brands A5, A6 and A7 in all four surveys because these brands were relatively new (or unavailable) and not available always. It is therefore difficult to conclude whether the reduction in acrylamide concentration in potato chips was related to lot-to-lot variability due to potato storage conditions or due to adoption of mitigation strategies during this period (2009–2016).
Figure 1. Acrylamide concentration (ng g−1) in sweet potato chips collected in the surveys during 2009 – 2016.
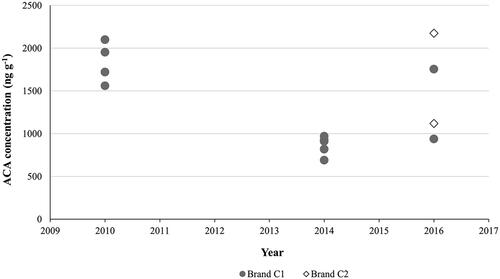
Table 1. Acrylamide concentration (ng g−1) in potato chips of different commercial brands surveyed during 2009 – 2016.
In our previous surveys, potato chips similarly had wide variability (Becalski et al. Citation2010). Acrylamide content in Brand A (A1 in the current study) was 2452.6 ± 1104.4 ng g−1. Although concentrations were similar at the higher end in both surveys, more than 50% of the samples in the 2009–2016 surveys had concentrations lower than the minimum concentration observed in the previous surveys (Suppl Figures 1 and 2). In the 2002–2008 surveys, Brand C (A3 in current study) had the lowest acrylamide concentrations (376.0 ± 136.7 ng g−1) compared with other brands. In contrast, the same brand (A3) in the 2009–2020 surveys had a mean acrylamide concentration of 278.6 ng g−1 (). Brand B currently identified as A2 had acrylamide concentration of 982.6 ng g−1 in 2002–2008 compared with 347.1 ng g−1 in the 2009–2016 surveys. When we consider potato chips as one type of food product, the current surveys had considerably lower acrylamide concentrations (504.3 ± 718.2 ng g−1, n = 85) than the previous surveys (1096.9 ± 922.9 ng g−1, n = 129). Results of our recent surveys show a clear reduction of acrylamide content in the individual brands (Suppl Figure s 1-5) as well as in potato chips as a class, on Canadian market. Surveys conducted in other countries also have shown similar trend. Abt et al. (Citation2019) found a decrease in mean acrylamide concentrations from chips collected in 2011 - 2015 (498.2 ng g−1) relative to those collected between 2002 – 2006 (639.5 ng g−1) on the US market. Similarly, a decrease over time was reported in several European markets (Powers et al. Citation2013; Mesías and Morales Citation2015; Claeys et al. Citation2016; Gielecińska and Mojska Citation2023).
Our data (2002 - 2008 and 2009 - 2016 surveys) revealed that lot-to-lot variations resulted in acrylamide concentrations variation by 100% or more. Research from other groups (Mesías and Morales Citation2015; Gielecińska and Mojska Citation2023) also suggested that variability in acrylamide concentrations in potato chips is clearly linked to the brands and lots within a brand. Considering the fact that levels of natural precursors of acrylamide, asparagine and reducing sugars, in potato and cereal grains are greatly influenced by growth conditions and agronomic practices (Biedermann Citation2002; Halford et al. Citation2007; Tsukakoshi et al. Citation2012) and storage conditions (Lineback et al. Citation2012; Powers et al. Citation2021), lot-to-lot variability might be unavoidable. It is, however, thought that lot-to-lot variability can be reduced by adopting appropriate mitigation strategies, such as agronomic factors, recipe and product design, processing, and production (Powers et al. Citation2021; Mesias et al. Citation2022; Oddy et al. Citation2023). As wider variabilities were observed within individual brands in our surveys and other markets, including Spain (Mesias et al. Citation2019) and Poland (Gielecińska and Mojska Citation2023), it is possible to produce potato chips (all brands) with reduced acrylamide content for Canadian consumers by combining adoption of appropriate mitigation strategies, use of potato varieties developed for chips, recommended storage conditions and product processing consistency.
French fries and other potato products
The acrylamide concentrations were determined in two types of French fries – ready-to-eat and frozen, which required baking/cooking before testing. First type was procured from the restaurant and second type was baked at the lab. Considerable variabilities were observed in acrylamide concentrations between the restaurant chain ready-to-eat French fries ranging from 255 to 1120 ng g−1 in 2009 and 67 to 842 ng g−1 in 2014 (). A significant reduction (p = 0.003) in acrylamide concentration was observed in samples from 2014 compared to those from 2009 from one chain (Brand B1). However, products from other two chains (Brand B2 and Brand B3) remained mostly unchanged, acrylamide concentrations increased in some samples while decreased in others, without any specific trend over time. Again, there was considerable variability in acrylamide concentrations within each chain depending on the location of the outlets ().
Table 2. Acrylamide concentration (ng g−1) in ready-to-eat French fries of three fast-food chains on the Canadian market.
Although fast food outlets belonging to the same chain are very likely to receive prefabricated fries from same sources, acrylamide concentrations in 2014 varied by a factor of about three to six between outlets belonging to the same chain and greater than 12 times between outlets belonging to different chains (). It is possible that the variations in acrylamide concentrations in the final products were caused by a divergence of frying parameters between outlets. The extent of variation in acrylamide concentration in French fries found in our surveys is smaller than reported by Sanny et al. (Citation2013) (77 to 4483 and 85 to 3369 ng g−1 in two different frying conditions) but greater than Normandin et al. (Citation2013) (291 to 2390 ng g−1). Although the inconsistent starting materials and random variability in industrial processes affect acrylamide concentration in final products (Foot et al. Citation2007; Konings et al. Citation2007; Pedreschi et al. Citation2014), further reduction of acrylamide is possible by adopting mitigation strategies and adhering to consistent frying protocols among different outlets of same fast-food chains.
Surveys were conducted in 2009, 2010, and 2020 to determine acrylamide concentrations in frozen and oven baked potato and sweet potato products from different manufacturers. Collection of the same products among collection cycles was not always possible, due to unavailability or sometimes, discontinuation of the product. Wide variations were observed between manufacturers, types, and survey years. The concentrations ranged from 17.3 to 626.6 ng g−1 (mean and median of 183.6 ± 173.8 and 106.0 ng g−1, respectively) for French fries (). Among French fry types, Brand B4 had acrylamide 59.8 and 101.9 ng g−1 in 2010 and in 2020, respectively, while Brand B5 contained 198.0 ng g−1 in 2010. In 2020, one sample from each of Brands B6 and B7 was analyzed that had acrylamide of 17.3 and 31.4 ng g−1, respectively. In contrast, crinkle-cut fries with sea salt of Brand B8 had acrylamide of 182.2 ng g−1 in 2020.
Table 3. Acrylamide concentration (ng g−1) in frozen potato/sweet potato products on the Canadian market.
Shoestring spice-coated and shoestring fried potatoes from Brands B9 and B10 had acrylamide of 270.7 ng g−1 in 2009 and 100.0 ng g−1 in 2010, respectively (). In contrast, Brands B11 and B12 had 41.0 and 47.4 ng g−1 of acrylamide, respectively, in 2009. Shoestring fries with sea salt (Brand B13) and straight cut fries with sea salt (Brand B14) had much higher acrylamide, 373.2 and 543.4 ng g−1, respectively, in 2020. Shoestring cut fries from both Brands B15 and B16 had much lower concentration in 2020, 30.6 and 78.2 ng g−1, respectively, than 626.6 ng g−1 in 2009 (Brand B15) and 106.3 ng g−1 in 2010 (Brand B16).
Another straight cut fries product from Brand B17 had 148.3 ng g−1 in 2009. Straight cut fries of Brand B18 had 532.8 ng g−1 of acrylamide in 2009, while Brands B19 and B20 straight cut had 238.0 and 77.3 ng g−1 of acrylamide, respectively, in 2010 (). In 2020, straight cut and crispy straight cut from Brands B21 and B22 had 267.2 and 93.5 ng g−1 acrylamide, respectively. For potato wedges, homestyle (Brand B26) had an acrylamide concentration of 766.3 ng g−1 in 2009, while the concentration in restaurant style (Brand B27) was 38.4 ng g−1 in 2020. The much lower acrylamide in restaurant-style wedges might be related to ingredients and/or cooking parameters. Another possibility is that the reduction is because of the adoption of a mitigation strategy. In some frozen potato products, acrylamide concentrations have decreased in 2020 compared to 2009 or 2010. However, one crinkle cut fries product (Brand B4) had higher acrylamide in 2020 (101.9 ± 22.1 ng g−1) than in 2010 (59.8 ± 32.0 ng g−1).
In sweet potato product, plank cut fries (Brand B30) and crinkle-cut fries (Brand B31) had 135.2 and 289.7 ng g−1 of acrylamide, respectively, in 2020. In contrast, Organic Crispy straight cut fries from Brand B32 contained 107.0 ng g−1 of acrylamide in the same year. As sweet potato products were analyzed only in 2020, temporal comparison was not possible. The overall acrylamide concentration in frozen French fries was much lower (183.6 ± 173.8 ng g−1) than ready-to-eat French fries (419.0 ± 221.6 ng g−1). In the US surveys of 2011 – 2015 (Abt et al. Citation2019), ready-to-eat French fries/potato products (shoestring potatoes, hash browns, potato puffs, cut fries, and curly fries) had 418.4 ± 303.5 ng g−1 of acrylamide, while frozen products of the same category (baked by consumers) contained 206.0 ± 279.7 ng g−1 of acrylamide, and the trend agrees with our study. Normandin et al. (Citation2013) also found that deep-fried French fries contained much higher acrylamide (291–2390 ng g−1; mean 1053 ng g−1) than oven-baked fries (142 - 818 ng g−1; mean 358 ng g−1). Restaurant fries are typically deep-fried, while consumer-prepared fries are commonly baked; cooking style/parameters might be a factor for this difference. Differences in acrylamide concentrations were also observed between slice types of frozen products. Acrylamide concentration is positively correlated with food surface area (Gökmen et al. Citation2006), which supports the differences in acrylamide concentrations in differently sliced frozen potato/sweet potato fries in our study (). Similarly, Michalak et al. (Citation2011) found that acrylamide concentrations in crinkle (620 ± 101 ng g−1) and shoestring (747 ± 112 ng g−1) cut potato fries were greater than that in cubes (485 ± 151 ng g−1).
Sweet potato chips
Although sweet potato chips were collected from two manufacturers, most of the samples belonged to Brand C1. Overall, acrylamide concentration ranged from 690 to 2175 ng g−1 with an average of 1304.2 ± 514.5 ng g−1 in Brand C1, while Brand C2 had acrylamide concentration of 1647.5 ± 746.0 ng g−1 (). No notable differences among the samples in Brand C1 from different years were observed except in 2014, which had comparatively lower acrylamide in all five samples.
Because of growing popularity of vegetables chips, acrylamide content in these products has been analyzed in different countries. González-Mulero et al. (Citation2023) found significantly higher levels of acrylamide in the sweet potato chips, 2342 ± 148 ng g−1, while the concentration was much lower in potato chips, 524 ± 32 ng g−1. In the study of Nguyen et al. (Citation2022), acrylamide concentration in sweet potato chips was 1110 ng g−1 (749–1509 ng g−1), while potato chips contained 354 ng g−1 (123–962 ng g−1). In another study, Oellig et al. (Citation2022) found a wide variation in sweet potato chips ranging from 100–2780 ng g−1 (880 ng g−1). In our survey, acrylamide concentration in sweet potato chips (1357 ± 532 ng g−1) was lower than that of González-Mulero et al. (Citation2023), but higher than those of Nguyen et al. (Citation2022) and Oellig et al. (Citation2022). Acrylamide concentration in sweet potato chips was much higher than potato chips in all published results as well as in our survey ( and ). Higher levels of acrylamide precursors such as asparagine and reducing sugar in sweet potatoes (Elmore et al. Citation2019; González-Mulero et al. Citation2023), manufacturing processes, or lack of consistent mitigation methods might be responsible for high concentration of acrylamide in sweet potato chips. This highlights the importance of monitoring the presence of acrylamide in this food category.
Conclusion
We used three chromatography systems to analyze acrylamide in surveyed foods described in this manuscript. System updating resulted in increased analytical sensitivity, which might slightly compromised comparisons over the years. However, data from our study suggest that there has been a substantial decrease in acrylamide concentrations in different potato-based food products in 2009–2020 surveys compared with 2002–2008 surveys, which may be due to the adoption of mitigation methods. However, in 2009–2020 surveys, no clear trend of acrylamide reduction over time was observed, which indicates lack of adoption of concerted and/or effective mitigation strategies, such as use of raw materials with low levels of reducing sugars, optimize cooking parameters, and addition of the enzyme asparaginase. Despite the observed reductions in analyzed food products, considerable (and sometime higher than the EU benchmark in some foods) presence of acrylamide in food suggests that regular monitoring would allow to determine potential on-going trends in acrylamide occurrence and update dietary exposures. Considering the large degree of variability within and between brands in each product category, it is possible to reduce acrylamide concentration by integrated planning and adoption of mitigation measures. Food manufacturers/operators should therefore regularly review the mitigation measures adopted to maintain low acrylamide levels and adjust processes and quality controls to achieve the levels as low as possible.
Supplemental Material
Download MS Word (753.1 KB)Acknowledgements
The authors are grateful to Jean-Francois Fiset, Robert Dabeka, Xù-Liáng Cáo, and Luc Pelletier for critical comments on the manuscript.
Disclosure statement
No potential conflict of interest was reported by the author(s).
Additional information
Funding
References
- Abt E, Robin LP, McGrath S, Srinivasan J, DiNovi M, Adachi Y, Chirtel S. 2019. Acrylamide levels and dietary exposure from foods in the United States, an update based on 2011-2015 data. Food Addit Contam Part A Chem Anal Control Expo Risk Assess. 36(10):1475–1490. doi: 10.1080/19440049.2019.1637548.
- Acrylamide in food: Health Canada (HC). 2021. Available from https://www.canada.ca/en/health-canada/services/food-nutrition/food-safety/chemical-contaminants/food-processing-induced-chemicals/acrylamide.html.
- Becalski A, Lau BPY, Lewis D, Seaman SW. 2003. Acrylamide in foods: occurrence, Sources, and modeling. J Agric Food Chem. 51(3):802–808. doi: 10.1021/jf020889y.
- Becalski A, Lau BPY, Lewis D, Seaman SW, Hayward S, Sahagian M, Ramesh M, Leclerc Y. 2004. Acrylamide in French fries: influence of free amino acids and sugars. J Agric Food Chem. 52(12):3801–3806. doi: 10.1021/jf0349376.
- Becalski A, Stadler R, Hayward S, Kotello S, Krakalovich T, Lau BP, Roscoe V, Schroeder S, Trelka R. 2010. Antioxidant capacity of potato chips and snapshot trends in acrylamide content in potato chips and cereals on the Canadian market. Food Addit Contam Part A Chem Anal Control Expo Risk Assess. 27(9):1193–1198. doi: 10.1080/19440049.2010.483692.
- Biedermann M. 2002. Methods for determining the potential of acrylamide formation and its elimination in raw materials for food preparation, such as potatoes. Mitt Lebensm Hyg. 93:653–667.
- Claeys W, De Meulenaer B, Huyghebaert A, Scippo M-L, Hoet P, Matthys C. 2016. Reassessment of the acrylamide risk: Belgium as a case-study. Food Control. 59:628–635. doi: 10.1016/j.foodcont.2015.06.051.
- Deribew HA, Woldegiorgis AZ. 2021. Acrylamide levels in coffee powder, potato chips and French fries in Addis Ababa city of Ethiopia. Food Control. 123:107727. doi: 10.1016/j.foodcont.2020.107727.
- Benford D, Bignami M, Chipman JK, Ramos Bordajandi L, 2022. Assessment of the genotoxicity of acrylamide. Efsa J. 20(5):e07293. doi: 10.2903/j.efsa.2022.7293.
- Elmore JS, Xu F, Maveddat A, Kapetanou R, Qi H, Oruna-Concha M-J. 2019. Acrylamide Content of Vegetable Chips. In: food-Borne Toxicants: formation, Analysis, and Toxicology. American Chemical Society. p. 15–26.
- Foot RJ, Haase NU, Grob K, Gondé P. 2007. Acrylamide in fried and roasted potato products: a review on progress in mitigation. Food Addit Contam. 24 Suppl 1(sup1):37–46. doi: 10.1080/02652030701439543.
- Gielecińska I, Mojska H. 2023. Trends in the acrylamide content of potato products in Poland in the years 2004–2020. Food Control. 152:109877. doi: 10.1016/j.foodcont.2023.109877.
- Gökmen V, Palazoğlu TK, Şenyuva HZ. 2006. Relation between the acrylamide formation and time–temperature history of surface and core regions of French fries. J Food Eng. 77(4):972–976. doi: 10.1016/j.jfoodeng.2005.08.030.
- González-Mulero L, Mesías M, Morales FJ, Navajas-Porras B, Rufián-Henares JA, Delgado-Andrade C. 2023. Acrylamide bioaccessibility in potato and veggie chips. Impact of in vitro colonic fermentation on the non-bioaccessible fraction. Food Res Int. 164:112409. doi: 10.1016/j.foodres.2022.112409.
- Graff RE, Cho E, Preston MA, Sanchez A, Mucci LA, Wilson KM. 2018. Dietary acrylamide intake and risk of renal cell carcinoma in two large prospective cohorts. Cancer Epidemiol Biomarkers Prev. 27(8):979–982. doi: 10.1158/1055-9965.EPI-18-0320.
- Halford NG, Muttucumaru N, Curtis TY, Parry MA. 2007. Genetic and agronomic approaches to decreasing acrylamide precursors in crop plants. Food Addit Contam. 24 Suppl 1:26–36. doi: 10.1080/02652030701403093.
- Health Canada’s Revised Exposure Assessment of Acrylamide in Food: Health Canada (HC). 2012. Available from http://www.hc-sc.gc.ca/fn-an/alt_formats/pdf/securit/chem-chim/food-aliment/acrylamide/rev-eval-exposure-exposition-eng.pdf.
- Hendriksen HV, Kornbrust BA, Østergaard PR, Stringer MA. 2009. Evaluating the potential for enzymatic acrylamide mitigation in a range of food products using an asparaginase from Aspergillus oryzae. J Agric Food Chem. 57(10):4168–4176. doi: 10.1021/jf900174q.
- Hogervorst JG, Schouten LJ, Konings EJ, Goldbohm RA, van den Brandt PA. 2007. A Prospective Study of Dietary Acrylamide Intake and the Risk of Endometrial, Ovarian, and Breast Cancer. Cancer Epidemiol Biomarkers Prev. 16(11):2304–2313. doi: 10.1158/1055-9965.EPI-07-0581.
- IARC. 1994. Some industrial chemicals. Monogr. 60.
- JECFA 2011. Safety evaluation of certain food additives and contaminants.
- Kafouris D, Stavroulakis G, Christofidou M, Iakovou X, Christou E, Paikousis L, Christodoulidou M, Ioannou-Kakouri E, Yiannopoulos S. 2018. Determination of acrylamide in food using a UPLC-MS/MS method: results of the official control and dietary exposure assessment in Cyprus. Food Addit Contam Part A Chem Anal Control Expo Risk Assess. 35(10):1928–1939. doi: 10.1080/19440049.2018.1508893.
- Konings EJM, Ashby P, Hamlet CG, Thompson GAK. 2007. Acrylamide in cereal and cereal products: a review on progress in level reduction. Food Addit Contam. 24 Suppl 1(sup1):47–59. doi: 10.1080/02652030701242566.
- Lineback DR, Coughlin JR, Stadler RH. 2012. Acrylamide in foods: a review of the science and future considerations. Annu Rev Food Sci Technol. 3(1):15–35. doi: 10.1146/annurev-food-022811-101114.
- LoPachin Richard M, Gavin T. 2012. Molecular mechanism of acrylamide neurotoxicity: lessons learned from organic chemistry. Environ Health Perspect. 120(12):1650–1657. doi: 10.1289/ehp.1205432.
- Martínez Steele E, Buckley JP, Monteiro CA. 2023. Ultra-processed food consumption and exposure to acrylamide in a nationally representative sample of the US population aged 6 years and older. Prev Med. 174:107598. doi: 10.1016/j.ypmed.2023.107598.
- Mesias M, Delgado-Andrade C, Holgado F, Morales FJ. 2019. Acrylamide content in French fries prepared in food service establishments. LWT. 100:83–91. doi: 10.1016/j.lwt.2018.10.050.
- Mesias M, Delgado-Andrade C, Morales FJ. 2022. An updated view of acrylamide in cereal products. Curr Opin Food Sci. 46:100847. doi: 10.1016/j.cofs.2022.100847.
- Mesías M, Morales FJ. 2015. Acrylamide in commercial potato crisps from Spanish market: trends from 2004 to 2014 and assessment of the dietary exposure. Food Chem Toxicol. 81:104–110. doi: 10.1016/j.fct.2015.03.031.
- Michalak J, Gujska E, Klepacka J. 2011. The effect of domestic preparation of some potato products on acrylamide content. Plant Foods Hum Nutr. 66(4):307–312. doi: 10.1007/s11130-011-0252-2.
- Mucci LA, Dickman PW, Steineck G, Adami HO, Augustsson K. 2003. Dietary acrylamide and cancer of the large bowel, kidney, and bladder: absence of an association in a population-based study in Sweden. Br J Cancer. 88(1):84–89. doi: 10.1038/sj.bjc.6600726.
- Nguyen KH, Fromberg A, Duedahl-Olesen L, Christensen T, Granby K. 2022. Processing contaminants in potato and other vegetable crisps on the Danish market: levels and estimation of exposure. J Food Compos Anal. 108:104411. doi: 10.1016/j.jfca.2022.104411.
- Normandin L, Bouchard M, Ayotte P, Blanchet C, Becalski A, Bonvalot Y, Phaneuf D, Lapointe C, Gagné M, Courteau M. 2013. Dietary exposure to acrylamide in adolescents from a Canadian urban center. Food Chem Toxicol. 57:75–83. doi: 10.1016/j.fct.2013.03.005.
- NTP. 2011. Report of carcinogenics: carcinogen Profiles. US Dept of Health and Human Services. 12:270–271.
- Oddy J, Addy J, Mead A, Hall C, Mackay C, Ashfield T, McDiarmid F, Curtis TY, Raffan S, Wilkinson M, et al. 2023. reducing dietary acrylamide exposure from wheat products through crop management and imaging. J Agric Food Chem. 71(7):3403–3413. doi: 10.1021/acs.jafc.2c07208.
- Oellig C, Gottstein E, Granvogl M. 2022. Analysis of acrylamide in vegetable chips after derivatization with 2-mercaptobenzoic acid by liquid chromatography–mass spectrometry. Eur Food Res Technol. 248(4):937–946. doi: 10.1007/s00217-021-03898-5.
- Pedreschi F, Mariotti MS, Granby K. 2014. Current issues in dietary acrylamide: formation, mitigation and risk assessment. J Sci Food Agric. 94(1):9–20. doi: 10.1002/jsfa.6349.
- Powers SJ, Mottram DS, Curtis A, Halford NG. 2013. Acrylamide concentrations in potato crisps in Europe from 2002 to 2011. Food Addit Contam Part A Chem Anal Control Expo Risk Assess. 30(9):1493–1500. doi: 10.1080/19440049.2013.805439.
- Powers SJ, Mottram DS, Curtis A, Halford NG. 2021. Progress on reducing acrylamide levels in potato crisps in Europe, 2002 to 2019. Food Addit Contam Part A Chem Anal Control Expo Risk Assess. 38(5):782–806. doi: 10.1080/19440049.2020.1871083.
- Rapp M, Schwadorf K, Leiser WL, Würschum T, Longin CFH. 2018. Assessing the variation and genetic architecture of asparagine content in wheat: what can plant breeding contribute to a reduction in the acrylamide precursor? Theor Appl Genet. 131(11):2427–2437. doi: 10.1007/s00122-018-3163-x.
- Sanny M, Luning PA, Jinap S, Bakker EJ, van Boekel MAJS. 2013. Effect of frying instructions for food handlers on acrylamide concentration in French Fries: an explorative study. J Food Prot. 76(3):462–472. doi: 10.4315/0362-028X.JFP-12-049.
- Tareke E, Rydberg P, Karlsson P, Eriksson S, Törnqvist M. 2002. Analysis of acrylamide, a carcinogen formed in heated foodstuffs. J Agric Food Chem. 50(17):4998–5006. doi: 10.1021/jf020302f.
- Törnqvist M. 2005. Acrylamide in food: the discovery and its implications: a historical perspective. Adv Exp Med Biol. 561:1–19. doi: 10.1007/0-387-24980-X_1.
- Tsukakoshi Y, Ono H, Kibune N, Isagawa S, Yamazaki K, Watai M, Yoshida M. 2012. Monitoring of acrylamide concentrations in potato chips in Japan between 2006 and 2010. Food Addit Contam Part A Chem Anal Control Expo Risk Assess. 29(8):1212–1218. doi: 10.1080/19440049.2012.684890.
- Virk-Baker MK, Nagy TR, Barnes S, Groopman J. 2014. Dietary acrylamide and human cancer: a systematic review of literature. Nutr Cancer. 66(5):774–790. doi: 10.1080/01635581.2014.916323.