
ABSTRACT
In recent years, a growing body of literature on social inclusion on an individual level has emerged. Yet, there is no common understanding of the concept itself and how to measure it. The objective of this study was to document the development of the Experiences of Social Inclusion Scale (ESIS), including the theoretical framework used for this purpose, which draws strongly on the capability approach. The ESIS is a brief closed survey instrument to assess self-reported experiences of social inclusion, and the aim was to evaluate its psychometric properties. The sample used for this consisted of 847 adults aged 18–87 years from all over Finland, most of them affected by or at immediate risk of social exclusion. The results indicated good internal reliability and consistency (Cronbach’s alpha = 0.89). Furthermore, factor analyses suggested a one-dimensional factor structure for the ten items of the ESIS. The mean score on the ESIS was not statistically significantly different between male and female respondents, whereas a weak positive association with age and statistically significant differences for experiences of poverty were found. Analyses for convergent validity showed that the ESIS was statistically significantly associated with instruments measuring related concepts. All correlations were in the expected direction and rather substantial in magnitude but did not indicate that the same construct was being measured (r = .409 to r = .678). These promising results indicate a broad applicability of the ESIS in self-administered questionnaires, and its use in future research is encouraged.
Introduction
The concept of social inclusion has a long-standing history in social sciences, particularly within sociological theories, and has found its way to social policy (Allman Citation2013; Leemann and Hämäläinen Citation2016; Silver Citation1994). In recent years, social inclusion has gained attention as an outcome on an individual level associated with health and well-being (Coombs, Nicholas, and Pirkis Citation2013). As the promotion of social inclusion has increasingly been formulated not only as an aim of social policy but also as a targeted outcome of specific programmes and interventions aimed at improving health and well-being, the urge to develop measures of social inclusion on an individual level have emerged (Cordier et al. Citation2017).
Recent reviews have listed a variety of indicators for social inclusion (Baumgartner and Burns Citation2014; Coombs, Nicholas, and Pirkis Citation2013; Cordier et al. Citation2017). However, a major finding of these reviews has been that there is no commonly agreed definition of social inclusion on an individual level, and, thus, how it should be measured (Baumgartner and Burns Citation2014; Coombs, Nicholas, and Pirkis Citation2013; Cordier et al. Citation2017). Many of the reviewed instruments were not explicitly developed to measure social inclusion per se but rather concepts such as social capital, social integration, connectedness, empowerment, and social participation, which are seen to be conceptually closely related to social inclusion (Cordier et al. Citation2017). It has been criticised that the instruments often lack sufficient theoretical underpinnings (Baumgartner and Burns Citation2014) and have been developed as assessment tools for specific interventions and programmes (Coombs, Nicholas, and Pirkis Citation2013; Cordier et al. Citation2017), resulting in context- and target group-specific instruments, which are hard to apply outside their particular context or to a general population.
Despite the lack of a commonly agreed definition of social inclusion, Cordier et al. (Citation2017) highlight three domains emerging from the literature: (a) participation, (b) social connectedness and sense of belonging, and (c) citizenship and rights, including notions of agency and responsibility. Furthermore, some authors have argued to include both objective and subjective aspects when measuring social inclusion (Coombs, Nicholas, and Pirkis Citation2013). Objective elements usually refer to quantifiable material resources and the degree of individual participation in various life domains, whereas subjective aspects refer to the perceived satisfaction of needs and feelings associated with being included. The distinction between the objective and subjective aspects of social inclusion can also be found throughout the conceptual work by Huxley et al. (Citation2012) used for the development of the Social and Community Opportunities Profile (SCOPE). However, they found that objective and subjective domains of social inclusion were not highly correlated (Huxley et al. Citation2012). In particular, the role of participation has been critically discussed in the literature. E.g. Baumgartner and Burns (Citation2014) argued that a simple distinction between participation and non-participation is insufficient and analyses should rather focus on an individual’s sense of agency.
Aim of the Study
The objective of this study was to document the development of a survey instrument for assessing self-reported experiences of social inclusion and to evaluate its psychometric properties. Regarding the distinction found in Coombs, Nicholas, and Pirkis (Citation2013) and Huxley et al. (Citation2012), the focus was exclusively on subjective aspects. Considering the domains listed in Cordier et al. (Citation2017), our instrument was intended to capture subjective aspects of social connectedness and sense of belonging and notions of agency and responsibility. We acknowledge the importance of objective domains in measuring social inclusion, but besides weak correlations between objective and subjective domains (Huxley et al. Citation2012) and criticisms towards using participation (Baumgartner and Burns Citation2014), the focus on subjective aspects also had practical reasons. The objective was to develop a short scale which could be placed in self-administered questionnaires. In Finland, major population studies (e.g. the National FinSote or FinHealth surveys) usually include various aspects of socio-economic background and living conditions as well as quantifiable aspects of participation and social contact.
Theoretical Framework
Our approach is based on a synthesis of theories and incorporates findings from previous studies on the effects of poverty and social exclusion. We have published an extensive theoretical framework in Finnish, which covers both objective and subjective aspects of social inclusion (Isola et al. Citation2017; Leemann et al. Citation2018). Objective elements in this theoretical framework include education, knowledge, skills, income, housing, social and political participation, social networks, and access to services. However, the main focus of our approach is how people experience social inclusion.
The theoretical backbone for our understanding of social inclusion is the capability approach (CA). The fruitfulness of the CA as a theoretical framework in researching social inclusion has been pointed out in the literature, particularly because it builds on the interrelationship between individuals and their social environment and emphasises quality aspects of agency and social interaction (Ware et al. Citation2007; Baumgartner and Burns Citation2014). When formulating the CA, Amartya Sen aimed at moving the space of analysis from utilities and primary goods to capabilities. He argued in favour of “shifting attention from goods to what goods do to human beings” (Sen Citation1980, 218–219). Hence, the CA sets a strong focus on people and their well-being. Monetary and material resources are important means to achieve well-being, but analyses are encouraged to reach beyond material deprivation. Sen (Citation1999; Citation2009; Robeyns Citation2006) defines that capability is what people are able to do and be, that is a person’s ability to function in different social contexts. Sen outlines capabilities and the ability to function as not restricted to individuals themselves and argues to include social interaction and equal engagement in the social life of the community, i.e. experiences of being part of and belonging to the community (Sen Citation1980, Citation1985). Capabilities are described as essential freedoms to achieve functionings which are commonly valued in neighbourhoods, communities, and societies (Sen Citation1999). Thus, the CA underlines the importance of social interaction and embeddedness for experiencing social inclusion.
Agency is a prominent element within the CA and it is considered to be tightly connected to well-being (Sen Citation1985; Crocker and Robeyns Citation2009). The CA has shown to be fruitful in researching agency and it has been applied to concepts related to social inclusion, such as empowerment or health inequalities (Abel and Frohlich Citation2012; Ibrahim and Alkire Citation2007). A central notion of the CA is that an agent chooses valuable functionings to pursue. In our approach, we regard human beings as relational agents when it comes to choosing pursuable functionings amongst the available opportunities. In the CA, capabilities are conceptualised as sensed potentials, i.e. perceived abilities to achieve rather than achievements themselves (Hofmann, Schori, and Abel Citation2013; Sen Citation1985). Hence, we argue that experiences of social inclusion are largely determined by what we call agency beliefs, which are shaped by interpersonal and external factors. This comes close to the concept of self-efficacy (Bandura Citation1977), but in our approach agency beliefs are primarily determined by social forces, e.g. how the agent is positioned in a variety of situations and relations. Deneulin (Citation2008) and Deneulin and McGregor (Citation2010) draw attention to this kind of relational interpretation of the CA. A number of studies demonstrate that individuals who believe in their opportunities formulate more goals and plans for the future and also achieve them more often than peers with poor agency beliefs (e.g. Hankonen Citation2011; Kavanagh and Bower Citation1985).
Recent studies suggest that experiencing meaningfulness is a central human need and is highly social in nature. According to Martela and Steger (Citation2016), meaning in life is composed of coherence, purpose, and significance. Coherence, which they describe as comprehensibility and descriptive in nature, relates to the construction of meaning, whereas purpose and significance are normative and constitutive of meaningfulness. Purpose and significance are shaped in social interaction. Martela, Ryan, and Steger (Citation2018) found that meaningfulness is determined by the satisfaction of basic psychological needs according to the self-determination theory (Deci and Ryan Citation2000), namely autonomy, competence, and relatedness and by pro-social behaviour, namely beneficence. Autonomy and competence refer to volition and a sense of mastery, which are both related to agency beliefs. Relatedness is described as a sense of belonging which has previously been shown to be a source of meaningfulness (e.g. Hicks and King Citation2009; Lambert et al. Citation2013). Pro-social behaviour has been shown to be crucial to human well-being (Martela and Ryan Citation2016) and an independent predictor of meaningfulness (Martela, Ryan, and Steger Citation2018). Thus, meaningfulness is largely shaped by social factors. Taken together, we regard meaningfulness as crucial to experiencing social inclusion.
The importance of meaningfulness in experiencing social inclusion also gains support from qualitative research on the effects of poverty. A number of studies (e.g. Isola, Turunen, and Hiilamo Citation2016; Isola, Siukola, and Kukkonen Citation2019) have found that people living in prolonged poverty experience a sense of worthlessness and a lack of meaningfulness. These studies also show that in such a situation people do not try to influence their environment. In this sense, the experienced lack of meaningfulness also appears as a reduction in agency beliefs.
Methods
Initial Development of the Questionnaire Instrument
The development of the ESIS was guided by the protocol for developing indicators issued by the National Expert Network on Measurement of Functioning (TOIMIA), which is administered by the Finnish Institute for Health and Welfare. The guidelines are based on the procedures outlined in De Vet et al. (Citation2011) and McDowell (Citation2006).
On a conceptual level, the roots of the development of the ESIS can be seen in extensive and long-standing qualitative research on the consequences of poverty in Finland, reaching back to 2006. Major findings indicated that people in prolonged poverty experienced exclusion as a lack of meaningfulness, a narrow conception of their ability to influence their own life and the living environment, and low levels of social support and contact (Isola, Virrankari, and Hiilamo, CitationForthcoming). This was the starting point for first developing our theoretical framework and then operationalising its key elements as items for the ESIS.
The formulation of initial statements was deductive in nature and driven by our theoretical framework on experiences of social inclusion. The items were formulated by experts from the Finnish Institute for Health and Welfare (Anna-Maria Isola, Mariitta Vaara, Raija Lääperi, and Lars Leemann) and the University of Jyväskylä (Tuija Kotiranta, Kaisa Haapakoski, and Sami Ylistö) as positive statements depicting feelings associated with social inclusion. In order to obtain realistic possibilities for the ESIS to get included in major Finnish population studies, we decided that the maximum length of the scale should not exceed 10 items. We formulated possible items, discussed and refined them, and carefully chose 10 items for the ESIS. We were ready to omit items if pre-testing and psychometric evaluation indicated reasons to do so.
Pre-testing and Scale Revisions
The initial scale was tested among people in vulnerable labour market positions (n = 26) to check for face validity. These were long-term unemployed with reduced working ability and functional capacity due to physical and psychological reasons. After having answered the items of the scale the participants were interviewed in 5 groups. The focus group interviews included a cognitive debriefing and in-depth feedback aimed at evaluating single items as well as the whole instrument. Based on the results, the scale was revised. Statements which were perceived as too abstract, difficult, or which were understood inconsistently were reformulated using the received comments.
The revised scale was pre-tested in a second round among random participants at Terve-SOS (a national fair on health and well-being in Finland). Participants had the possibility to answer the instrument on their own and discuss their experience with the researcher or provide written comments. Based on the feedback some fine adjustments to the statements were made.
As a third step, the newly revised scale was tested in a pilot study for the questionnaire providing the data of the present study. Most of the participants (n = 11) were people for whom it was assumed to be particularly challenging to fill in the questionnaire form. The pilot study included in-depth feedback and personal interviews with each participant. Based on the positive feedback, no further revisions were made.
Final Version of the Scale
The final version of the Experiences of Social Inclusion Scale (ESIS) comprises 10 items, which are formulated as positively directed statements. The statements are assessed on a 5-level Likert scale. The final version of the ESIS is presented in the “Appendix”.
Data Collection and Survey Participants
The data for this study were gathered within a nation-wide survey on living conditions, well-being, and health conducted among projects funded by the European Structural Fund’s priority axis 5 (social inclusion and combating poverty, European Social Fund, ESF) in Finland. A total of 847 people participated in the research, of which 789 were participants in these projects, mostly people outside paid employment and affected or threatened by social exclusion, poverty, and marginalisation from a wide range of projects. Consequently, the participants were diverse and included, e.g. long-term unemployed and people not in education, employment, or training (NEET), homeless people, former substance abusers, and people with disabilities, long-term sicknesses, and mental health problems. Fifty-eight respondents were professionals and students working on the projects. The survey was conducted between September and December 2017.
There is a lack of empirical knowledge about the target group as it is a hard-to-survey population (Tourangeau Citation2014) and known to be underrepresented in population studies. In order to increase the number of respondents, researchers and assistants especially trained for this purpose were sent out to the project sites all over the country, e.g. food distribution points, open meeting spaces, training and counselling sites, workshops, course rooms, etc. They met the potential respondents in person and informed them of the aims of the research, confidentiality, voluntary participation, and other rights of the participants concerning the research. The same information was handed out in written form along with a consent form. The participants could answer the questionnaire during their regular presence in the projects. The preconditions for participation were sufficient proficiency in Finnish, to be of full age, and not to be under guardianship because of an intellectual disability.
The age of the participants ranged from 18 to 87 years. However, the age distribution was rather skewed as the projects were predominantly aimed at people of working age, and only a small number of participants were aged 65 or more (n = 37). Additionally, projects aimed at younger adults in difficult life situations were a priority for the funding of the ESF, and therefore young people were overrepresented in the sample. In contrast, the gender distribution was fairly equal between female and male participants (53.5 and 46 percent, respectively), while 0.5 percent chose the third option “other”.
Instruments for Assessing Convergent Validity
In absence of a “gold standard” measure (Cordier et al. Citation2017), convergent validity was assessed using 5 scales and 2 single item variables. The scales were the 8 item Quality of Life Scale (EuroHIS-8), the Mental Health Inventory 5-item scale (MHI-5), an abbreviated version of the Social Provisions Scale consisting of 12 items (SPS-12), the 7-item Sense of Mastery Scale (SOMS-7), and the full Warwick Edinburgh Mental Well-Being Scale (WEMWBS) consisting of 14 items. In addition to these scales, we used single item questions for self-rated health (SRH) and experienced loneliness. The scales and variables were chosen because they were thought to measure different dimensions of experiences of social inclusion based on our theoretical framework. However, because the instruments were assumed to measure only certain aspects associated with experiences of social inclusion, we hypothesised rather moderate correlations and did not set a lower limit.
The 8 items of the EuroHIS-8 Quality of Life Scale were extracted from the 26-item scale (WHOQOL-BREF) developed by the WHO Regional Office for Europe (Power Citation2003; for psychometric properties see Schmidt, Mühlan, and Power Citation2006). The four domains of quality of life captured by the EuroHIS-8 are physical health, psychological well-being, social relations, and environment. These domains are associated with our theoretical understanding of the experiences of social inclusion, especially the items on social relations and satisfaction with the local environment. The positively phrased items are assessed on a 5-level Likert scale, from which the mean is calculated. Higher values refer to a higher quality of life.
The MHI-5 is a brief screening instrument for the self-assessment of general mental health (Berwick et al. Citation1991) derived from the Short-Form Health Survey (SF-36; see Ware and Sherbourne Citation1992). It has been found to perform particularly well at detecting anxiety and mood disorders (Rumpf et al. Citation2001). The sum score of the 5 items is calculated after recoding negatively phrased statements, resulting in a range from 5 to 30 points. This is then transformed into a final score ranging from 0 to 100 using a standard linear transformation. Higher scores indicate better mental health.
The SPS was developed by Cutrona and Russell (Citation1987) based on the theoretical model of the provisions of social relationships (Weiss and Rubin Citation1974). The scale consists of six domains: attachment, social integration, reassurance of worth, reliable alliance, guidance, and opportunity of nurturance. This focus makes the SPS conceptually relevant for the ESIS. The full SPS consists of 24 items which are assessed on a 4-level Likert-style scale. However, in this study we used an abbreviated 12-item version containing the two positively phrased items per domain, resulting in a total score between 12 and 48. Higher scores stand for better social provisions.
Sense of mastery has been conceptualised as a coping mechanism for stress reduction, and the SOMS-7 was developed as an instrument to measure individuals’ perceptions of control over their lives, i.e. their sense of mastery, as opposed to being fatalistically ruled (Pearlin and Schooler Citation1978; Pearlin et al. Citation1981). This is particularly related to agency beliefs in our theoretical framework and the ESIS. The seven items are assessed on a 4-level Likert-style scale, resulting in a score from 7 to 28. Higher scores indicate a higher sense of mastery.
The WEMWBS is an instrument developed for measuring positive aspects of mental well-being and has been validated with good results (Tennant et al. Citation2007; Steward-Brown et al. Citation2009). The scale measures key concepts of mental well-being, such as positive affect, various aspects of psychological functioning, and interpersonal relationships. Many domains covered by the WEMWBS are reflected in our theoretical framework, specifically: perceived competence, autonomy, and satisfying interpersonal relationships (Tennant et al. Citation2007). The 14 positively phrased statements are assessed on a 5-point Likert scale, leading to a sum score between 14 and 70 points. Higher scores indicate higher levels of mental well-being.
SRH is a commonly used question to assess a summary of various aspects of health and it has been shown to be predictive of mortality, functional capacity and associated with socio-economic position (e.g. Jylhä Citation2009). SRH provides a good overview of a respondent’s health based on symptoms and possible diagnosed illnesses but also experiences and expectations originating from social comparisons (Manderbacka Citation1998). In this study SRH was assessed by the question “How would you describe your state of health at present?” and the presented answers were good, fairly good, average, fairly poor, and poor. For the analyses, the initial scoring was reversed so that higher scores referred to better SRH.
Loneliness is considered a central aspect of social exclusion and a key risk factor regarding social well-being. Studies have found mechanisms by which loneliness impairs health (Cacioppo et al. Citation2002) both physical, e.g. coronary heart disease and stroke (Valtorta et al. Citation2016) and mental health, e.g. depression (Heikkinen and Kauppinen Citation2004). Although correlating somewhat more strongly with the emotional dimension, the single question has been found to measure both social and emotional aspects of loneliness (Routasalo et al. Citation2006). In this study, loneliness was assessed by the question “Do you feel lonely?” to which the options never, very rarely, sometimes, fairly often, and all the time were presented. Higher scores indicate stronger experiences of loneliness.
Statistical Analysis
All analyses were conducted using SAS version 9.3 (SAS/STAT 9.3 User’s Guide Citation2011). The statistical analyses followed the steps presented in the next sections.
Results
Descriptive Statistics and Missing Data
Descriptive statistics for the items of the ESIS are presented in . The proportion of missing values varied between 1.3 percent (item 05) and 2.6 percent (items 06 and 07). 92.9 percent (787 participants) responded to all 10 items. Another 38 people (4.5 percent) answered 9 of the 10 items. We considered the number of missing values among the items to be acceptable and, because the sample size was large enough, we did not replace the missing values. Instead, we omitted participants with missing values in the ESIS from all further analyses.
Table 1. Descriptive statistics for the ten items of the Experiences of Social Inclusion Scale (ESIS).
The item scores and correspondingly the mean values for all ten items were generally closer to the positive end of the scale. The means ranged from 3.662 (“I can strive for things that are important for me”) to 3.942 (“I feel trusted”). The standard deviations were rather high, ranging from 0.863 (“I feel trusted”) to 1.091 (“I feel that my life has purpose”), indicating sufficient variance of the values. The median score for all of the items was 4. The participants used the full range of the 5-level Likert scale for all items.
Internal Consistency
In order to assess the internal consistency of the ESIS, we considered Cronbach’s alpha, item-total correlations, and changes of Cronbach’s alpha if single items were deleted. We expected Cronbach’s alpha (α) to reach at least 0.7 (Clark and Watson Citation1995). We set the minimum for item-total correlations to be 0.3 (Ferketich Citation1991) and the improvement of the standardised α to be less than 0.05 if an item was deleted (DeVellis Citation2003).
When computed, we found Cronbach’s alpha to be high (α = 0.89). Since α tends to increase with a larger number of items (Clark and Watson Citation1995), this indicates good internal reliability considering that the ESIS consists of only 10 items. In we present the item-total correlations and changes of α when items were deleted. All items had a standardised item-total correlation between 0.52 and 0.70, and 7 out of 10 showed values higher than 0.6. These values exceeded the expected minimum. The lowest item-total correlation was found for “I can influence some things in my living environment” (0.52), whereas “I can strive for things that are important for me” showed the highest correlation (0.70). Furthermore, we tested the criterion of increasing α by more than 0.05 if an item was deleted. Such cases were not detected. Instead, for all statements, a deletion resulted in a reduction of α. These satisfactory results gave no reason to delete any items from the scale, and we considered the internal consistency of the ESIS to be good.
Table 2. Item-total correlations and Cronbach’s alpha if items deleted for the Experiences of Social Inclusion Scale (ESIS).
Inter-item Correlations
In we present the Spearman rank correlations for all inter-item correlations. We considered correlations higher than 0.2 and lower than 0.8 to be reasonable – correlations exceeding 0.8 would indicate that two items were associated too tightly and the deletion of one should be considered (Tennant et al. Citation2007). However, we found all the correlation coefficients to be in a range from 0.33–0.64. All associations were statistically highly significant (p < 0.0001). The lowest value was found between the statements “I get positive feedback on what I do” and “I can influence some things in my living environment”. The highest association was between “I feel that my life has purpose” and “I can strive for things that are important for me”. In general, the weakest associations were found for “I can influence some things in my living environment” (0.33–0.48) and the strongest associations for “I can strive for things that are important for me” (0.42–0.64). All in all, the inter-item correlations gave no reason to delete any of the 10 statements.
Table 3. Spearman rank correlations between the items of the Experiences of Social Inclusion Scale (ESIS).
Factor Analysis
In order to assess the suitability of the data for factor analysis, we considered the results of the Kaiser–Meyer–Olkin Measure of Sampling Adequacy (KMO) and Bartlett’s Test of Sphericity. With a value of 0.905, the KMO was clearly higher than the recommended minimum of 0.6 (Kaiser Citation1974). Bartlett’s Test of Sphericity was highly significant with χ2 = 3383.283 and p < 0.0001. These results were supportive of conducting factor analyses. We randomly split the sample into two groups of equal size and conducted exploratory factor analysis (EFA) on the first subsample and confirmatory factor analysis (CFA) on the other.
In the EFA we used the principal factor method and applied Kaiser’s criterion to retain only factors with eigenvalues higher than 1 and factors that lay clearly above the “elbow” using graphical results of the scree plot (DeVellis Citation2003). When conducting the EFA on the first subsample (n = 393), we found a single common factor solution for the ESIS. shows the scree plot of eigenvalues of the extracted factors in the EFA. The scree plot unambiguously showed the elbow on factor 2. Only one factor had an eigenvalue greater than 1 (4.175). The extracted factor explained 95.8 percent of the common variance. reports the factor loadings of the ten items of the ESIS on this single factor. All ten items loaded between 0.51 and 0.79 on the extracted single factor. This means that all the items exceeded the recommended minimum loading of 0.3, under which an item should not be assigned to a factor (Hair et al. Citation2014). The lowest factor loading was found for “I can influence some things in my living environment” and the highest for “I feel that my life has purpose”.
Figure 1. Scree plot of eigenvalues of the extracted factors in the EFA.
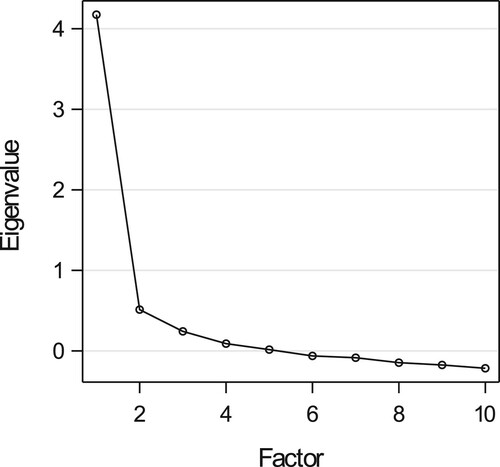
Table 4. Factor loadings of the ten items of the ESIS.
We then applied CFA on the second subsample (n = 394) to confirm the suggested single factor model. For the CFA we used diagonally weighted least squares estimation (DWLS), which has been shown to be the most reliable parameter estimation method for ordinal data, and generally when variables are not normally distributed (Flora and Curran Citation2004; Brown Citation2006; Li Citation2016). We assessed the goodness of fit index (GFI) as an absolute index, the adjusted goodness of fit index (AGFI), based on a correction for degrees of freedom as a parsimony index, and the normed fit index (NFI) as an incremental index. Additionally, we examined the Standardised Root Mean Square Residual (SRMR). We expected the GFI, AGFI, and NFI to be above 0.9 and the SRMR to be below 0.1, ideally below 0.05 (Hair et al. Citation2014).
The single factor model received support from the CFA. With standardised factor loadings between 0.58 and 0.77 on this single factor, the values for all items were above the recommended lower limit of 0.5 (). The GFI, AGFI, and NFI were all above their desired levels (GFI = 0.991, AGFI = 0.986, NFI = 0.985). The SRMR was 0.053, i.e. clearly below 0.1 and very close to the conservative limit of 0.05.
Sum Score
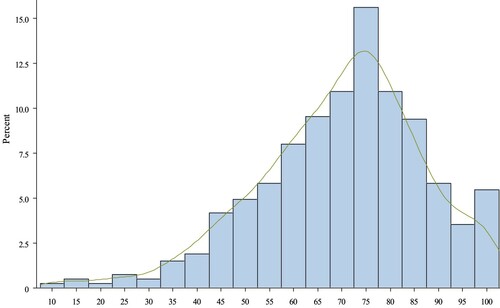
To measure a person’s overall experience of social inclusion with the ESIS, we constructed a sum index of the 10 items. Given the scoring of 1–5 points per statement, the sum index of the raw points had a range of 40, with a minimum of 10 and a maximum of 50 points. We transformed the scale to a range of 0–100 points using a standard linear transformation. Higher scores on the scale express greater experiences of social inclusion. shows the histogram of the distribution together with the kernel density plot of the scale. In general, the scores were towards the positive end of the scale. However, the ESIS score did not appear to suffer from floor or ceiling effects (i.e. >20 percent, see ). All scores were between 10 and 100 points. The mean score was 69.498 (SD: 17.056) while the median was 72.5 points.
Figure 2. Histogram and kernel density plot of the sum score of the ESIS.
Associations with Socio-demographic and Socio-economic Background of the Participants
shows the mean ESIS scores by gender, age group and experiences of poverty. We assessed measurement invariance between the groups by first running EFA on each group separately to replicate the single factor solution found in the factor analyses. Then we computed differences in the goodness of fit indices (ΔGFI, ΔAGFI, ΔNFI) between the groups conducting CFA using DWLS estimation. For gender and poverty measurement invariance could be established (single factor solution in EFA, ΔGFI < 0.01, ΔAGFI < 0.01, ΔNFI < 0.01). For the age groups, the differences in the goodness of fit indices were > 0.01 (max. 0.042) which was mainly due to small group sizes. When age was dichotomised (18–39 vs. 40 +) measurement invariance could be established as well.
Table 5. Mean scores on the Experiences of Social Inclusion Scale (ESIS) by gender, age group and experiences of poverty.
The analyses revealed no statistically significant differences between female and male respondents in the mean ESIS scores (p = 0.251). Participants who chose “other” when asked for gender were omitted due to the low number of answers (n = 4). For age, the mean ESIS score increased monotonically until the second highest age group. The results of the one-way ANOVA indicated that the differences were statistically significant (F = 3.37, p = 0.005). However, the increases from one age group to another were quite moderate and steps from one age group to the following were not statistically significant. Additionally, we checked the association between age and ESIS score, and the Pearson’s correlation coefficient was low but statistically significant (r = 0.151, p < 0.0001). In order to capture socio-economic differences, we used a poverty variable measuring difficulties in meeting basic needs. We grouped those who reported that in the previous 12 months they had either feared that they would run out of food before they had money to buy more, or had left necessary medication unpurchased due to a lack of money, or had not consulted a doctor due to lack of money or any combination of the above-mentioned items. The analyses showed statistically highly significant differences between these two groups (p < 0.0001).
Convergent Validity
We assessed the convergent validity of the ESIS using five scales and two single question variables. We computed Pearson’s correlation coefficients as measures of association. As shown in , the coefficients ranged between r = 0.409 (SRH) and r = 0.678 (WEMWBS) and all associations were statistically highly significant (p < 0.0001). The two scales measuring well-being in a broad sense, i.e. the EuroHIS-8 Quality of Life Scale and the WEMWBS yielded associations above r = 0.6, and the three scales measuring more specific domains of well-being (SOMS-7, SPS-12, MHI-5) showed associations above r = 0.54 with the ESIS. Loneliness was associated with the ESIS with r = −0.427. The weakest association was found for SRH with r = 0.409. However, it should be taken into consideration that both loneliness and SRH were assessed only by one single question.
Table 6. Pearson correlation coefficients between the Experiences of Social Inclusion Scale (ESIS) and instruments used for assessing convergent validity.
Discussion
Our results show good psychometric properties, a unitary factor structure, and good convergent validity for the ESIS. We found the internal reliability of the ESIS to be high with a Cronbach’s alpha coefficient of 0.89. Moreover, all other parameters used to assess the internal consistency of the ESIS (item-total correlations, the change of Cronbach’s alpha if an item was deleted, and inter-item correlations) were very satisfactory, indicating good internal consistency. Results from the factor analysis indicated that all ten items could be grouped under a single common factor. The factor loadings of the items were high.
The analyses to assess the convergent validity yielded good results. The ESIS was statistically highly significantly associated with the instruments used for this purpose. All correlations were in the expected direction and substantial in magnitude. Still, none of the other instruments was associated with the ESIS so strongly that it could be concluded to approximate the ESIS too closely, i.e. assumed to measure the same construct. The strongest associations were found for two scales measuring well-being in a broad sense, i.e. including personal and social aspects of well-being. This is in line with our expectations, as we understand experiences of social inclusion to include both personal and social domains. The ESIS was also strongly associated with three scales measuring more specific domains of well-being (mental health, social provisions, sense of mastery), which cover central parts of the ESIS. The correlation coefficients between the ESIS and the two single item questions on loneliness and self-rated health were somewhat lower but statistically highly significant. The main theoretical foundation of the ESIS was the CA, and these results can also be seen as corresponding to the central assumptions of the CA and its multidimensionality. As outlined in section Theoretical Framework, in the CA the consequences of poverty include strong impacts on both personal and social aspects of well-being. Capabilities, i.e. what people feel that they are able to do, are strongly linked to perceptions of agency and personal well-being. Still, this is seen as strongly determined by social interaction, and social exclusion should not refer primarily to low social participation but to low quality of social interaction and support, low appreciation, a weak sense of belonging and a lack of meaningfulness. In this sense, the findings that the ESIS was more tightly associated with instruments measuring well-being in a broad sense also reflect the multidimensional conception of well-being in the CA.
We found no statistically significant difference between female and male respondents in their mean ESIS scores. This result supports the applicability of the ESIS. However, we found a moderate monotonic rise in the mean ESIS scores with increasing age. It might be hypothesised that this is due to a true age effect, i.e. with increasing age, people could engage more often in activities they consider meaningful, maintain and interact with more stable social networks, etc. On the other hand, this might also be due to the nature of our data. Many projects from which the data were gathered focused on young people experiencing severe difficulties. This explanation gained support from preliminary analyses showing that the prevalence of severe mental strain (MHI-5 ≤ 52) was substantially higher among participants below 40 years compared to the other age groups. To further assess a possible age effect, more research is needed.
Our theoretical assumptions were supported when examining the mean ESIS scores according to the socio-economic position. Participants who had experienced poverty during the previous year scored statistically significantly lower on the ESIS compared to those who had not experienced poverty. This is consistent with central assumptions of the CA and with the results of previous studies on the effects of poverty.
A growing body of literature shows the fruitfulness of applying the CA to measure health and well-being (Ruger and Mitra Citation2015). Various instruments have been developed in this field, e.g. the ICECAP capability measures (Coast et al. Citation2008; Al-Janabi et al. Citation2013), the original OCAP instrument (Anand et al. Citation2009), which has been reduced and refined for the OCAP-18 instrument (Lorgelly et al. Citation2008), and further developed to the OxCAP-MH instrument intended specifically for mental health contexts (Simon et al. Citation2013). The ESIS joins these instruments as the CA was specifically applied to assess experiences of social inclusion. Despite this specific focus, some results correspond to those reported for the capability instruments mentioned above, e.g. strong associations with the quality of life, mental health, and socio-economic position (Al-Janabi et al. Citation2013; Simon et al. Citation2013; Anand et al. Citation2009).
Strengths and Limitations
It is worth mentioning that the present study represents the first attempt to quantify experiences of social inclusion in a population study in Finland by using the ESIS. The present study addressed some points of criticism mentioned in recent reviews on measures of social inclusion. Many instruments attempting to measure social inclusion on an individual level were initially not explicitly developed to assess social inclusion per se but rather they addressed concepts which are close to social inclusion, e.g. social participation, social integration, or social capital (Cordier et al. Citation2017). This is also reflected in the lack of commonly agreed definitions and insufficient theoretical underpinnings for instruments measuring social inclusion on an individual level (Baumgartner and Burns Citation2014). In this study, we briefly presented a theoretical framework for measuring experiences of social inclusion which was used for the development of the ESIS. Consequently, the ESIS has a clear focus on subjective aspects of social inclusion (Coombs, Nicholas, and Pirkis Citation2013).
The focus on subjective experiences distinguishes the ESIS from other instruments in the field, which usually attempt to capture subjective and objective aspects. Examples of such instruments for which psychometric properties have been assessed with satisfactory results include the Social and Community Opportunities Profile (SCOPE) (Huxley et al. Citation2012) and the Social Inclusion Scale (SIS) (Secker et al. Citation2009; Wilson and Secker Citation2015). Both scales include a mix of items on subjective and objective aspects. However, Huxley et al. (Citation2012) found that objective and subjective domains were not highly correlated. Furthermore, in their extensive theoretical background, Huxley et al. (Citation2012) summarised positive feelings of social inclusion such as purpose, trust, belonging, achievement, or being valued. Still, the questions of the SCOPE do not address these aspects as such. The ESIS on the other hand aims to capture just these subjective aspects of social inclusion.
In most cases, the reviewed instruments were developed for the assessment of a specific intervention, resulting in context- and target group-specific instruments (Cordier et al. Citation2017; Baumgartner and Burns Citation2014; Coombs, Nicholas, and Pirkis Citation2013). The SIS can be seen as an example of such an instrument. It was developed to assess the impacts of arts participation for people with mental health problems (Secker et al. Citation2009). As a consequence, three items of the SIS address the mental health context directly (“My social life has been mainly related to mental health or people who use mental health services”, “I have been involved in a group not just for mental health”, “I have felt some people look down on me because of my mental health needs”). These items had to be rephrased or omitted for other target groups (Wilson and Secker Citation2015). Our theoretical framework with a focus on general social well-being and the subsequent formulation of the items not directed at any particular target group make the ESIS broadly applicable for evaluation and population studies. This broad applicability is further facilitated by the brief form of the ESIS, consisting of just 10 items.
Compared to previous studies, the sample of the present study was quite diverse and large (see Cordier et al. Citation2017). This allowed the systematic assessment of various psychometric properties of the ESIS, including factor analyses. In this sense, the present study attempts to respond to the reported lack of knowledge on psychometric data for previously published instruments measuring social inclusion, which would be needed for their validation (Cordier et al. Citation2017).
However, there are also some limitations. Despite being large and diverse, the sample for this study was skewed regarding the age of the participants. Most of the participants were people outside paid employment who participated in projects funded by the ESF. To improve the generalisability of the findings, the psychometric assessment should be repeated among other population groups and samples representative of the general population. Additionally, the use of longitudinal data would provide important additional information. Furthermore, we are aware that some psychometric properties could not be assessed in this study. Last but not least, the psychometric properties were evaluated for the Finnish language version of the ESIS, and the English translations presented in this study have not been tested so far. We recommend that all these points should be addressed in future research.
Conclusion
The present study contributes to the growing body of research on social inclusion on an individual level by introducing the Experiences of Social Inclusion Scale (ESIS). The psychometric properties of the ESIS are very promising. The analyses suggest that the ESIS is a valid instrument for measuring subjective aspects, i.e. experiences of social inclusion. The results encourage the use of the ESIS in future research. Such studies should examine the applicability of the ESIS in other populations and further elaborate the role of socio-economic and socio-demographic factors and the associations between experiences of social inclusion and health, well-being, and living conditions. As the ESIS focuses on the subjective aspects, it may be used to examine the associations between subjective and objective aspects of social inclusion, such as different forms of participation.
Ethical Approval
All procedures performed in this study involving human participants were in accordance with the ethical standards of the institutional research committee and with the 1964 Helsinki declaration and its later amendments or comparable ethical standards and were approved by the Institutional Review Board (IRB) of the Finnish Institute for Health and Welfare (Ethical Review Board 4/2017 §765). This article does not contain any studies with animals performed by any of the authors. Informed Consent: Informed consent was obtained from all individual participants included in the study.
Acknowledgements
We would like to thank the members of The Social Inclusion Coordination Project (Sokra) for their support, particularly Anna Keto-Tokoi for general supervision of this research and Minna Kukkonen for the important contribution to the data collection. We would like to express our thankfulness to the managers of the projects from which the data was collected. Last but not least, we thank all the participants in this study.
Disclosure statement
No potential conflict of interest was reported by the author(s).
Additional information
Funding
Notes on contributors
Lars Leemann
Lars Leemann (licentiatus philosophiae) is a researcher at the Finnish Institute for Health and Welfare (THL). He received his licentiate with a major in sociology from the University of Zurich in 2008. His licentiate work was examining the effects of transnational corporations’ foreign direct investments on countries’ income inequality in the world system. Since 2010 Leemann works at THL. His current research interests include social inequality, poverty, social and digital inclusion, and employment, and particularly their impacts on health and well-being, as well as the measurement of social inclusion.
Tuija Martelin
Tuija Martelin (PhD) is a research manager at the Finnish Institute for Health and Welfare (THL). Before taking up her career at THL and its predecessor the National Public Health Institute in 1998, she worked at the University of Helsinki, Department of Sociology (1980–1998). She received her PhD in sociology and demography from the University of Helsinki in 1996. Martelin is the author or co-author of about 200 scientific articles, reports and book chapters on multiple aspects of health and well-being as well as their social determinants. Her recent work examines inequalities in health and well-being according to socio-economic position, family structure, gender, and ethnic origin.
Seppo Koskinen
Seppo Koskinen (MD, PhD, MPolSci, MSci (epidemiology)), is the Director of the Research Programme “Challenges and solutions to population health and welfare” at the Finnish Institute for Health and Welfare (THL). He is the PI of several large research projects and has authored over 300 peer-reviewed articles, hundreds of other scientific articles and authored or edited nearly forty monographs on the health, functioning and well-being of the population. His research focuses on functioning and well-being of the working-aged and older population, their subgroups and their determinants amenable to policy measures.
Tommi Härkänen
Tommi Härkänen (PhD) is a research manager at the Finnish Institute for Health and Welfare (THL) and an adjunct professor in statistics at the University of Helsinki. His fields of expertise include statistical methods on handling of missing data and analysing longitudinal data. He has been involved in the statistical method development and analysis of various large population studies in Finland such as the Mini-Finland, Health 2000, Health 2011 and Maamu surveys.
Anna-Maria Isola
Anna-Maria Isola (PhD) is a research manager at the Finnish Institute for Health and Welfare (THL), where she heads the research of The Social Inclusion Coordination Project (Sokra). She received her PhD in social sciences from the University of Helsinki in 2013. Her current research interests include various aspects of poverty and social inclusion, e.g. intergenerational characteristics of poverty and disadvantage.
References
- Abel, T., and K. Frohlich. 2012. “Capitals and Capabilities: Linking Structure and Agency to Reduce Health Inequalities.” Social Science & Medicine 74 (2): 236–244.
- Al-Janabi, H., T. J. Hunter, J. Brazier, S. Bryan, T. N. Flynn, S. Clemens, A. Moody, and J. Coast. 2013. “An Investigation of the Construct Validity of the ICECAP – A Capability Measure.” Quality of Life Research 22 (7): 1831–1840.
- Allman, D. 2013. “The Sociology of Social Inclusion.” SAGE Open 3 (1): 1–16.
- Anand, P., G. Hunter, I. Carter, K. Dowding, F. Guala, and M. van Hees. 2009. “The Development of Capability Indicators.” Journal of Human Development and Capabilities 10 (1): 125–152.
- Bandura, A. 1977. “Self-efficacy: Toward a Unifying Theory of Behavioral Change.” Psychological Review 84 (2): 191–215.
- Baumgartner, J. N., and J. K. Burns. 2014. “Measuring Social Inclusion – A Key Outcome in Global Mental Health.” International Journal of Epidemiology 43 (2): 354–364.
- Berwick, D. M., J. M. Murphy, P. A. Goldman, J. E. Ware, A. J. Barsky, and M. C. Weinstein. 1991. “Performance of a Five-Item Mental Health Screening Test.” Medical Care 29 (2): 169–176.
- Brown, T. A. 2006. Confirmatory Factor Analysis for Applied Research. New York: The Guildford Press.
- Cacioppo, J. T., L. C. Hawkley, L. E. Crawford, J. M. Ernst, M. H. Burleson, R. B. Kowalewski, W. B. Malarkey, E. Van Cauter, and G. G. Berntson. 2002. “Loneliness and Health: Potential Mechanisms.” Psychosomatic Medicine 64 (3): 407–417.
- Clark, L. A., and D. Watson. 1995. “Constructing Validity: Basic Issues in Objective Scale Development.” Psychological Assessment 7 (3): 309–319.
- Coast, J., T. Flynn, L. Natarajan, K. Sproston, J. Lewis, J. J. Louviere, and T. J. Peters. 2008. “Valuing the ICECAP Capability Index for Older People.” Social Science & Medicine 67 (5): 874–882.
- Coombs, T., A. Nicholas, and J. Pirkis. 2013. “A Review of Social Inclusion Measures.” Australian & New Zealand Journal of Psychiatry 47 (10): 906–919.
- Cordier, R., B. Milbourn, R. Martin, A. Buchanan, D. Chung, and R. Speyer. 2017. “A Systematic Review Evaluating the Psychometric Properties of Measures of Social Inclusion.” PLoS ONE 12 (6): e0179109.
- Crocker, D. A., and L. Robeyns. 2009. “Capability and Agency.” In The Philosophy of Amartya Sen, edited by C. Morris, 60–90. Cambridge: Cambridge University Press.
- Cutrona, C. E., and D. W. Russell. 1987. “The Provisions of Social Relationships and Adaptation to Stress.” In Advances in Personal Relationships, edited by W. H. Jones and D. Perlman, Vol. 1, 37–67. Greenwich: JAI Press.
- Deci, E. L., and R. M. Ryan. 2000. “The “What” and “Why” of Goal Pursuits: Human Needs and the Self-Determination of Behavior.” Psychological Inquiry 11 (4): 227–268.
- Deneulin, S. 2008. “Beyond Individual Freedom and Agency: Structures of Living Together in Sen’s Capability Approach to Development.” In The Capability Approach: Concepts, Measures and Application, edited by S. Alkire, F. Comim, and M. Qizilbash, 105–124. Cambridge: Cambridge University Press.
- Deneulin, S., and J. A. McGregor. 2010. “The Capability Approach and the Politics of a Social Conception of Wellbeing.” European Journal of Social Theory 13 (4): 501–519.
- DeVellis, R. F. 2003. Scale Development: Theory and Applications. 2nd ed. Thousand Oaks, CA: Sage Publications.
- De Vet, H. C. W., C. B. Terwee, L. B. Mokkink, and D. L. Knol. 2011. Measurement in Medicine. Practical Guides to Biostatistics and Epidemiology. Cambridge: Cambridge University Press.
- Ferketich, S. 1991. “Focus on Psychometrics. Aspects of Item Analysis.” Research in Nursing and Health 14 (2): 165–168.
- Flora, D. B., and P. J. Curran. 2004. “An Empirical Evaluation of Alternative Methods of Estimation for Confirmatory Factor Analysis With Ordinal Data.” Psychological Methods 9 (4): 466–491.
- Hair, J. F., W. C. Black, B. J. Babin, and R. E. Anderson. 2014. “Exploratory Factor Analysis.” In Multivariate Data Analysis: Pearson New International Edition. 7th ed., edited by J. F. Hair, W. C. Black, B. J. Babin, and R. E. Anderson, 89–150. Harlow: Pearson.
- Hankonen, N. 2011. “Psychosocial Processes of Health Behaviour Change in a Lifestyle Intervention: Influences of Gender, Socioeconomic Status and Personality.” PhD diss. National Institute for Health and Welfare: Helsinki.
- Heikkinen, R.-L., and M. Kauppinen. 2004. “Depressive Symptoms in Late Life: A 10-Year Follow-up.” Archives of Gerontology and Geriatrics 38 (3): 239–250.
- Hicks, J. A., and L. A. King. 2009. “Positive Mood and Social Relatedness as Information About Meaning in Life.” The Journal of Positive Psychology 4 (6): 471–482.
- Hofmann, K., D. Schori, and T. Abel. 2013. “Self-Reported Capabilities Among Young Male Adults in Switzerland: Translation and Psychometric Evaluation of a German, French and Italian Version of a Closed Survey Instrument.” Social Indicators Research 114 (2): 723–738.
- Huxley, P., S. Evans, S. Madge, M. Webber, T. Burchardt, D. McDaid, and M. Knapp. 2012. “Development of a Social Inclusion Index to Capture Subjective and Objective Life Domains (Phase II): Psychometric Development Study.” Health Technology Assessment 16 (1): 1–248.
- Ibrahim, S., and S. Alkire. 2007. “Agency and Empowerment: A Proposal for Internationally Comparable Indicators.” Oxford Development Studies 35 (4): 379–403.
- Isola, A.-M., H. Kaartinen, L. Leemann, R. Lääperi, S. Valtari, and A. Keto-Tokoi. 2017. Mitä Osallisuus on? Osallisuuden Viitekehystä Rakentamassa. Työpaperi 33/2017. National Institute for Health and Welfare: Helsinki.
- Isola, A.-M., R. Siukola, and M. Kukkonen. 2019. “Gendered Experiences of Poverty and Recognition in the Finnish Welfare State.” NORA – Nordic Journal of Feminist and Gender Research 27 (3): 152–165.
- Isola, A.-M., E. Turunen, and H. Hiilamo. 2016. “Miten Köyhät Selviytyvät Suomessa?” Yhteiskuntapolitiikka 81 (2): 150–160.
- Isola, A.-M., L. Virrankari, and H. Hiilamo. Forthcoming. “On Social and Psychological Consequences of Prolonged Poverty – A Longitudinal Narrative Study from Finland.” Journal of Social and Political Psychology. Manuscript accepted for publication.
- Jylhä, M. 2009. “What Is Self-Rated Health and Why Does It Predict Mortality? Towards a Unified Conceptual Model.” Social Science & Medicine 69 (3): 307–316.
- Kaiser, H. F. 1974. “An Index of Factorial Simplicity.” Psychometrika 39 (1): 31–36.
- Kavanagh, D. J., and G. H. Bower. 1985. “Mood and Self-Efficacy: Impact of Joy Sadness on Perceived Capabilities.” Cognitive Therapy and Research 9 (5): 507–525.
- Lambert, N. M., T. F. Stillman, J. A. Hicks, S. Kamble, R. F. Baumeister, and F. D. Fincham. 2013. “To Belong is to Matter: Sense of Belonging Enhances Meaning in Life.” Personality and Social Psychology Bulletin 39 (11): 1418–1427.
- Leemann, L., and R.-M. Hämäläinen. 2016. “Asiakasosallisuus, Sosiaalinen Osallisuus ja Matalan Kynnyksen Palvelut. Pohdintaa Käsitteiden Sisällöstä.” Yhteiskuntapolitiikka 81 (5): 586–594.
- Leemann, L., A.-M. Isola, M. Kukkonen, H. Puromäki, S. Valtari, and A. Keto-Tokoi. 2018. Työelämän Ulkopuolella Olevien Osallisuus ja Hyvinvointi. Kyselytutkimuksen Tuloksia. Työpaperi 17/2018. National Institute for Health and Welfare: Helsinki.
- Li, C.-H. 2016. “Confirmatory Factor Analysis with Ordinal Data: Comparing Robust Maximum Likelihood and Diagonally Weighted Least Squares.” Behavior Research Methods 48 (3): 936–949.
- Lorgelly, P. K., K. Lorimer, E. Fenwick, and A. H. Briggs. 2008. The Capability Approach: Developing an Instrument for Evaluating Public Health Interventions. Glasgow: University of Glasgow.
- Manderbacka, K. 1998. “Questions on Survey Questions on Health.” PhD diss. Stockholm: Swedish Institute for Social Research.
- Martela, F., and R. M. Ryan. 2016. “The Benefits of Benevolence: Basic Psychological Needs, Beneficence, and the Enhancement of Well-Being.” Journal of Personality 84 (6): 750–764.
- Martela, F., R. M. Ryan, and M. F. Steger. 2018. “Meaningfulness as Satisfaction of Autonomy, Competence, Relatedness, and Beneficence: Comparing the Four Satisfactions and Positive Affect as Predictors of Meaning in Life.” Journal of Happiness Studies 19 (5): 1261–1282.
- Martela, F., and M. F. Steger. 2016. “The Three Meanings of Meaning in Life: Distinguishing Coherence, Purpose, and Significance.” The Journal of Positive Psychology 11 (5): 531–545.
- McDowell, I. 2006. Measuring Health. A Guide to Rating Scales and Questionnaires. 3rd ed. New York: Oxford University Press.
- Pearlin, L. I., E. G. Menaghan, M. A. Lieberman, and J. T. Mullan. 1981. “The Stress Process.” Journal of Health and Social Behavior 22 (4): 337–356.
- Pearlin, L. I., and L. Schooler. 1978. “The Structure of Coping.” Journal of Health and Social Behavior 19 (1): 2–21.
- Power, M. 2003. “Development of a Common Instrument for Quality of Life.” In EUROHIS: Developing Common Instruments for Health Surveys, edited by A. Nosikov and C. Gudex, 145–164. Amsterdam: IOS Press/World Health Organization.
- Robeyns, I. 2006. “The Capability Approach in Practice.” Journal of Political Philosophy 14 (3): 351–376.
- Routasalo, P., N. Savikko, R. S. Tilvis, T. E. Strandberg, and K. H. Pitkälä. 2006. “Social Contacts and Their Relationship to Loneliness among Aged People – A Population-Based Study.” Gerontology 52 (3): 181–187.
- Ruger, J. P., and S. Mitra. 2015. “Health, Disability and the Capability Approach: An Introduction.” Journal of Human Development and Capabilities 16 (4): 473–482.
- Rumpf, H.-J., C. Meyer, U. Hapke, and U. John. 2001. “Screening for Mental Health: Validity of the MHI-5 Using DSM-IV Axis I Psychiatric Disorders as Gold Standard.” Psychiatry Research 105 (3): 243–253.
- SAS/STAT 9.3 User’s Guide. 2011. 9.3. Cary, NC.
- Schmidt, S., H. Mühlan, and M. Power. 2006. “The EUROHIS-QOL 8-Item Index: Psychometric Results of a Cross-Cultural Field Study.” European Journal of Public Health 16 (4): 420–428.
- Secker, J., S. Hacking, L. Kent, J. Shenton, and H. Spandler. 2009. “Development of a Measure of Social Inclusion for Arts and Mental Health Project Participants.” Journal of Mental Health 18 (1): 65–72.
- Sen, A. 1980. “Equality of What?” In Tanner Lectures on Human Values, edited by S. McMurrin, 195–220. Cambridge: Cambridge University Press.
- Sen, A. 1985. “Well-Being, Agency and Freedom: The Dewey Lectures 1984.” The Journal of Philosophy 82 (4): 169–221.
- Sen, A. 1999. Development as Freedom. Oxford: Oxford University Press.
- Sen, A. 2009. The Idea of Justice. Cambridge: Harvard University Press.
- Silver, H. 1994. “Social Exclusion and Social Solidarity: Three Paradigms.” International Labour Review 133: 531–578.
- Simon, J., P. Anand, A. Grey, J. Rugkåsa, K. Yeeles, and T. Burns. 2013. “Operationalising the Capability Approach for Outcome Measurement in Mental Health Research.” Social Science & Medicine 98: 187–196.
- Steward-Brown, S., A. Tennant, R. Tennant, S. Platt, J. Parkinson, and S. Weich. 2009. “Internal Construct Validity of the Warwick-Edinburgh Mental Well-Being Scale (WEMWBS): A Rasch Analysis Using Data from the Scottish Health Education Population Survey.” Health and Quality of Life Outcomes 7: Article ID 15.
- Tennant, R., L. Hiller, R. Fishwick, S. Platt, S. Joseph, S. Weich, J. Parkinson, J. Secker, and S. Stewart-Brown. 2007. “The Warwick-Edinburgh Mental Well-Being Scale (WEMWBS): Development and UK Validation.” Health and Quality of Life Outcomes 5: Article ID 63.
- Tourangeau, R. 2014. “Defining Hard-to-Survey Populations.” In Hard-to-survey Populations, edited by R. Tourangeau, B. Edwards, T. P. Johnson, K. M. Wolter, and N. Bates, 3–20. Cambridge: Cambridge University Press.
- Valtorta, N. K., M. Kanaan, S. Gilbody, S. Ronzi, and B. Hanratty. 2016. “Loneliness and Social Isolation as Risk Factors for Coronary Heart Disease and Stroke: Systematic Review and Meta-Analysis of Longitudinal Observational Studies.” Heart 102 (13): 1009–1016.
- Ware, N. C., K. Hopper, T. Tugenberg, B. Dickey, and D. Fisher. 2007. “Connectedness and Citizenship: Redefining Social Integration.” Psychiatric Services 58 (4): 469–474.
- Ware, J. E., and C. D. Sherbourne. 1992. “The MOS Short-Form Health Survey (SF-36): I. Conceptual Framework and Item Selection.” Medical Care 30 (6): 473–483.
- Weiss, R., and Z. Rubin. 1974. “The Provisions of Social Relationships.” In Doing Unto Others, edited by Z. Rubin, 17–26. Englewood Cliffs, NJ: Prentice Hall.
- Wilson, C., and J. Secker. 2015. “Validation of the Social Inclusion Scale with Students.” Social Inclusion 3 (4): 52–62.
Appendix
The Experiences of Social Inclusion Scale (ESIS)
To what extent do you agree or disagree with the following statements? For each statement, please select the alternative that best describes your personal experience.