
 ?Mathematical formulae have been encoded as MathML and are displayed in this HTML version using MathJax in order to improve their display. Uncheck the box to turn MathJax off. This feature requires Javascript. Click on a formula to zoom.
Abstract
Silk is highly susceptible to fade, often resulting in colour loss to the fabric even when displayed in controlled museum environments. This study applies the engineering-inspired Prognostics and Health Management (PHM) approach to assess the remaining useful life (RUL) of silk fabric in a museum environment, focussing on predicting colour fade as an indicator of degradation. A novel mathematical model is developed to forecast cumulative colour fade of silk upholstery exhibited at the Great Gallery in The Wallace Collection, London. Unlike traditional accelerated aging methods, this model utilises naturally aged samples to estimate the rate of colour change over time. The main contribution of this work lies in the methodology and computational framework for model development using environmental data and conditions of silk in the museum environment. The proposed PHM methodology allows for continuous modifications of the colour fade model to improve accuracy by deploying new data from different silk collections and environments. The article demonstrates a model-based approach for informed decision making in museums regarding display and storage of silk upholstery.
Resumen
“Un enfoque de pronóstico y de gestión de salud para determinar el estado de la seda en los ambientes museísticos utilizando la decoloración”
La seda es muy susceptible a la decoloración lo que a menudo provoca la pérdida de color del tejido incluso cuando se expone en entornos museísticos controlados. Centrándose en la predicción de la pérdida de color como indicador de degradación, en este estudio se aplica un enfoque inspirado en la ingeniería para evaluar la vida útil restante (RUL) del tejido de seda en los ambientes museísticos, la gestión del pronóstico y la salud (PHM). Se desarrolla un nuevo modelo matemático para predecir la pérdida acumulada de color de la tapicería de seda expuesta en la Gran Galería de la Wallace Collection de Londres. A diferencia de los métodos tradicionales de envejecimiento acelerado, este modelo utiliza muestras envejecidas de forma natural para estimar el índice de cambio de color a lo largo del tiempo. La principal aportación de este trabajo radica en la metodología y el marco computacional usado para el desarrollo del modelo a partir de los datos ambientales y las condiciones de la seda en el entorno del museo. Mediante el uso de nuevos datos procedentes de diferentes colecciones y ambientes de la seda, la metodología propuesta, PHM, permite realizar continuas modificaciones del modelo de decoloración para así mejorar su precisión. El artículo demuestra un enfoque basado en modelos para adoptar decisiones informadas en relación con la exposición y el almacenamiento de tapicerías de seda en museos.
الملخص
“ تحديد حالة الحرير المعروض في البيئة المتحفية عبر اتباع نهج التكهنات وإدارة الصحة و استخدام نموذج تلاشي الألوان ”
الحرير قابل للتلاشي بدرجة عالية، مما يؤدي غالباً إلى فقدان لون النسيج ولوعُرض في بيئات المتاحف المُحكمة. تهدف هذه الدراسة إلى استخدام منهج التكهنات وإدارة الصحة (PHM) المستوحى من مجال الهندسة لتقييم العمر الإنتاجي المتبقي/الافتراضي (RUL) لنسيج الحرير في بيئة المتحف، مع التركيز على توقع تلاشي الألوان كمؤشر على التدهور. يتم تطوير نموذج رياضي جديد لتوقع تلاشي الألوان التراكمي لتنجيد الحرير المعروض في الصالة الكبرى (Great Gallery) من مجموعة والاس (ًWallace Collection) في لندن. على عكس الأساليب التقليدية للتقادم الصناعي المعجل، يستخدم هذا النموذج عينات معمرة بشكل طبيعي لتقدير معدل تغير اللون مع مرور الوقت. يكمن المساهم الرئيسي لهذا العمل في المنهجية والإطار الحسابي لتطوير النموذج باستخدام البيانات البيئية وحالة الحرير في بيئة المتحف المحكمة. تتيح المنهجية PHM المقترحة للتعديلات المستمرة على نموذج تلاشي الألوان لتحسين الدقة عن طريق استخدام بيانات جديدة من مجموعات الحرير والبيئات المختلفة. يُظهر المقال نهجاً قائماً على النموذج لاتخاذ القرارات المستندة على البيانات بشأن عرض وتخزين تنجيد الحرير في المتاحف.
Resumo
“Uma abordagem de prognóstico e de gerenciamento da saúde utilizando desbotamento de cor para determinar o estado da seda em um ambiente de exposição de museu”
Seda é altamente suscetível a desbotar, resultando com frequência em perda de cor do tecido mesmo quando exposto em ambientes controlados de museus. Este estudo aplica a abordagem Prognósticos e Gestão da Saúde (Prognostics and Health Management—PHM), inspirado na engenharia para avaliar a vida útil remanescente (remaining useful life—RUL) do tecido de seda em ambiente de museu, focando em prever o desbotamento de cor como um indicador de degradação. Um novo modelo matemático foi desenvolvido para prever o esmaecimento cumulativo da cor de estofamento de seda exibido na Great Gallery na Wallace Collection, em Londres. Ao contrário de métodos tradicionais de envelhecimento acelerado, este modelo utiliza amostras envelhecidas naturalmente para estimar o grau de mudança da cor ao longo do tempo. A principal contribuição deste trabalho está na metodologia e no esquema computacional para desenvolvimento do modelo, utilizando dados ambientais e condições da seda no ambiente do museu. A metodologia proposta PHM permite modificações contínuas do modelo de desbotamento de cor para melhorar a precisão ao utilizar novos dados de diferentes coleções de seda e de ambientes. O artigo apresenta uma abordagem baseada em modelos para tomadas de decisão em museus fundamentadas em relação à exposição e guarda de estofamento de seda.
摘要
“一种用褪色来预判博物馆展示环境中的丝绸健康状况的管理方法”
丝绸极易褪色,即便在受控的博物馆环境中展示也往往褪色。本研究采用了受工程学启发的预测与健康管理(PHM)方法来评估博物馆环境中丝织品的剩余使用寿命(RUL),其重点在于预测作为降解指标的褪色情况。我们开发了一种新颖的数学模型,用于预测伦敦华莱士收藏馆(The Wallace Collection)大艺廊展出的丝绸装饰品的累积褪色情况。与传统的加速老化方法不同,该模型利用了自然老化样本来估算颜色随时间改变的速率。本研究的主要贡献在于基于博物馆环境数据和丝绸状况的建模方法和计算框架。所提出的PHM方法支持对褪色模型进行持续修改,并通过来自不同丝绸藏品和环境的新数据来提高准确性。本文展示了一种基于模型的方法,便于博物馆在丝绸装饰品的展示和储存方面做出明智的决策。
Introduction
Silk-based artefacts can often form a significant proportion of a museum’s collection. Amongst the natural fibres found in museums, silk is a material significantly vulnerable to photochemical damage resulting in colour fade.Footnote1 The extent of fade occurring in silk is dependent on various factors such as condition of the fabric, dye and pigment used in the fabric, manufacturing process, and the display and storage conditions.Footnote2
There is a direct influence on silk colour fade with changes in the museum microenvironment,Footnote3 with factors such as fluctuating temperature, relative humidity and light,Footnote4 and its specific rate of reaction.Footnote5 Thus, colour fade is usually the result of a combination of various factors and not any one in isolation.Footnote6
Studies on the degradation of silk have ranged from molecular and macroscopic levels focussed on the breakdown of silk,Footnote7 to photodegradation studies focussed on the fading of silk dyes.Footnote8 However, numerous studies in this field have relied on accelerated aging techniques, occasionally involving invasive or destructive sampling. These methodologies subject the fabric to extreme experimental conditions, which might not accurately reflect the real environmental conditions experienced by the fabric in a museum setting. Moreover, the periods of accelerated aging are often challenging to correlate with the durations of display under real conditions. Furthermore, comparing studies on accelerated aging proves to be arduous due to the absence of a universal methodology.Footnote9 Despite the wealth of laboratory experiments, decision makers may still doubt its relevance. The IIC/ICOM-CC guidelines urge a more active role in developing an evidence-based approach. A more tailored approach is encouraged, considering the diverse environments that artifacts encounter during storage and display, as well as their individual sensitivities to various conditions experienced in their local surroundings.Footnote10 A one-size-fits-all approach to environmental specifications for collections has been deemed as impractical, lacking evidence and has been considered potentially unnecessary. This highlights the necessity for a more realistic assessment of environmental parameters.Footnote11
Statistical modelling, aided by sensors, provides a quantitative assessment of risks by connecting them to climate conditions. Museum-specific sensors, seamlessly integrated into a modular system with servers, contribute to understanding the impact of the museum environment.Footnote12 This data-driven approach facilitates better informed decision making and offers a much encouraged, targeted object-based approach.Footnote13
This article presents the development of a Prognostic and Health Management (PHM) approach to determine the impact of the museum’s controlled environmental conditions on silk colour fade in-situ. PHM can help develop diagnostic and prognostic capabilities to assess an object’s ‘health’ in specific environmental conditions and predict its ‘remaining useful life’ (RUL) based on historical and current condition data.Footnote14 PHM has been used successfully in various industries such as electronics, aerospace, the manufacturing industry and for the building environment. The historic use of PHM has been to aid decision making for cancer survival rates.Footnote15 Recent studies conducted for COVID-19 modelling have adopted prognostics approaches for detecting elevated cardiac biomarkers such as creatine kinase isoenzyme (CK-MB), myoglobin and troponin Ι for COVID-19 patients.Footnote16 PHM has also been utilised to predict the future degradation states of nuclear power plants (NPP),Footnote17 while the aerospace industry has also adopted systems prognostics for systems health inspections on spacecraft and aircraft, mostly focussed on monitoring the condition of aircraft structures, maintenance scheduling and asset purchasing systems.Footnote18 Common across these fields is the ability for PHM to transform raw data into information that can be actioned to assist safeguarding decision making.
Case study
The silk samples used in this study are part of the ‘Shrewsbury Set’ housed at the Wallace Collection Museum, London, UK. The Shrewsbury Set is a collection of sofas and armchairs in carved and gilded walnut frames, upholstered in yellow floral silk lampas fabric. The collection is estimated to date back to the mid-eighteenth century.Footnote19 The design of the Shrewsbury Set is representative of the transition period of styles between Louis XV and Louis XVI, with straight legs and richly carved classical motifs from the latter period, and the lingering curves of the former Rococo period. Based on museum archives, the Shrewsbury Set was acquired in August 1857 and subsequently transported to Hertford House, now known as The Wallace Collection. In 1897 Hertford House underwent a transformation to officially open as a museum in 1900, however, over time, the collection suffered severe damage and the chairs were re-upholstered in the late nineteenth and twentieth centuries. The Wallace Collection image archives and the original damaged silk were used as references to commission the production of new silk. This new silk was woven to replicate the authenticity of the original pattern, ensuring a close match. In 1956, the chairs were re-upholstered with matching silk fabric to preserve continuity with their original upholstery. Subsequently, the chairs were showcased in the Great Gallery, the Collection’s main exhibition hall. A surplus piece of the 1956 silk () had been kept in controlled storage since then to safeguard its preservation, with conditions maintained at a relative humidity (RH) range of 45–55% and a temperature between 14°C and 22°C, with no exposure to light.
Fig. 1 Offcut of the surplus 1956 silk fabric of the ‘Shrewsbury Set’ kept in museum storage conditions.
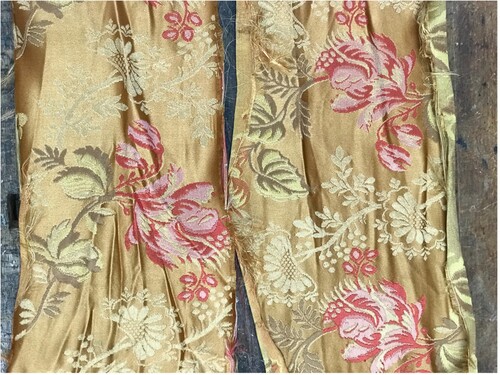
The continuous fading of silk, even when buffered by the use of costly HVAC systems, remains a challenging issue when displaying items in museums. presents the re-upholstery history of the Shrewsbury Set along with the corresponding display conditions.
Table 1 Sample references of re-upholstery with the 1956 woven silk.
Methodology
In PHM, ‘Prognostics’ is the method of predicting the future state of something by basing it on its current and historical conditions. It is a process of providing reliable predictions about the RUL of a system or component that faces degradation.Footnote20 ‘Health Management’ relates to the ability to make appropriate decisions in advance about the operational usage of a system, where the maintenance of that system is based on the diagnostic and prognostic information available from the system and its environment.Footnote21 With these elements defined, it can be seen that PHM is a methodology for the evaluation of a system, to predict and help mitigate any potential failures.Footnote22 PHM provides actionable information that aids decision making and can be seen as a method to produce economic benefits for owners, operators and the wider society. Smart sensors and ‘internet of things’ (IoT) technologies have made it easier for industries to gather important data to help make information-led decisions.Footnote23 These technologies help capture physical data, analyse these data and provide real-time insights to help industries understand trends and make informed evidence-based operational decisions.Footnote24 PHM considers the health management of an asset by supporting contextualised decision making for keeping it operational and sufficiently resourced to plan, fix and maintain it against the financial cost benefit of doing so.Footnote25 Maintenance processes have evolved from this reactive approach to those based on time-based maintenance (TBM) systems, and subsequently to reliability-based techniques. The development in machine diagnostic techniques has led to the concept of condition-based maintenance (CBM), which relies on detected symptoms of failure to enable preventative actions.Footnote26
A data-driven approach is one of general methods for using a prognostic and health management systems. Such an approach relies on the availability of observations collected during the degradation process relating to the target object or similar objects from which RUL predictions can be directly or indirectly derived. The approach provides an informative estimation of the entire degradation path, which can be checked against expert opinion to verify consistency.Footnote27 Data-driven prognostics can be conducted via algorithmic modelling and reasoning,Footnote28 for which rich datasets as training data are essential for modelling. Such a data-driven prognostic approach employs degradation models, as well as measured information to achieve better accuracy for predictions, derived from artificial neural networks (ANN) and similarity-based regression techniques.Footnote29 Data-driven approaches can be utilised to detect changes in object parameters as a result of aging or gradual deterioration, and for RUL evaluation are better suited to model situations with limited data and, in particular, for systems with no observed failure data and where no condition monitoring (CM) information exists. Statistical data-driven models rely on past observed data and can be broadly classed as two types: those that rely on the direct observed state of the object and those that use indirect parameters.Footnote30 RUL estimates are therefore based on probability as they do not rely on physical models to derive the RUL of a system or component. With respect to measurement techniques, direct condition measurement is sometimes not possible, or CM data may be scarce as most assets are not allowed to run to failure. Therefore, PHM systems must be flexible enough to be able to use data from other function-related sensors and parameters to then infer relevant degradation information.Footnote31
Prognostic and health management methodology
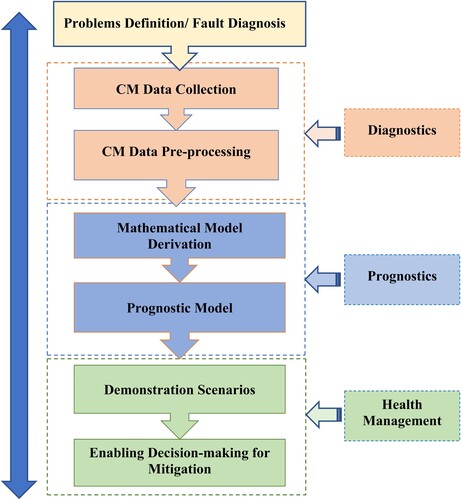
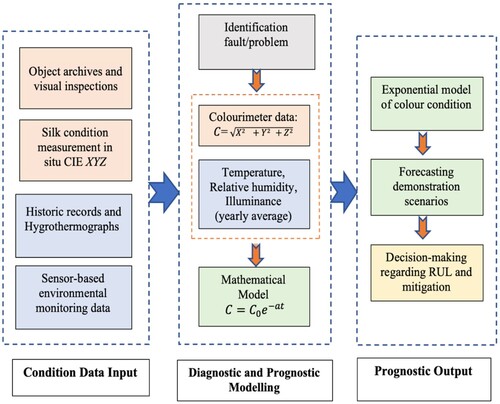
The overall PHM framework adopted for this research uses a data-driven, diagnostic and prognostic approach to predict the RUL of the silk sample. The diagnostics for the silk’s colour condition use colorimetric data to detect fade using the Euclidean distance method. Establishing the colour condition for the silk fabric was limited to four data points. The prognostic model in this work uses a new postulated mathematical colour fade model using historical environmental data. The PHM methodology, as seen in , guides the development of this model to assess silk fade in museum conditions.
Fig. 2 PHM methodology adopted.
1 Problem definition
Fault detection is defined to be the task of determining if a system or asset is experiencing problems.Footnote32 The health assessment of an asset involves estimating its health by analysing the collected data. In cases where failure data are unavailable, degradation monitoring or fault detection methods can be employed to identify gradual deterioration or sudden faults, respectively.Footnote33 The data can be objective or subjective, depending on the nature of the data and the collections method used.Footnote34
The determination of the problem definition, in this case, colour fade, was established through a combination of analysis techniques for capturing requirements, such as structured open-ended interviews with experts including conservators, observation of existing monitoring systems, data from the collection’s environmental sensors, and the use of archival material relating to the collection and specifically the care of silk. For the scope of this project, the Wallace Collection’s experts’ opinion was taken into consideration with the help of visual inspections to identify the lowest acceptable threshold for failure of the silk sample on display in the collection’s Great Gallery. For example, in the case of the silk in the collection, this meant understanding what was considered an unacceptable level of colour fade in the silk and loss of material in the form of fraying. Such thresholds of failure represented the point at which the silk had deteriorated to such an extent that it would have been taken away from display in the Great Gallery, and potentially have been re-upholstered at great cost. The 1956 silk sample used in the study was considered by everyone concerned to exhibit significant damage, including fading and fraying, that had pushed beyond its failure thresholds.
2 Data collection
Collecting information about the health of something through constant inspection is often referred to as condition monitoring (CM) data. It can be directly related or indirectly related to the asset health status and can be viewed as its health indicator.Footnote35
To determine the colour fade the International Commission of Illumination (CIE) 1931 CIE XYZ colour system was used. CIE XYZ is an international standard for colour system to quantify expression of colours as seen by the human eye.Footnote36 Y represents lightness (Hue), X and Z are colour information (Chromaticity).Footnote37
The direct CM data () were collected by measuring the silk with a digital precision handheld colorimeter, the TES-136 Chroma Meter. This can measure colour coordinates such as the tristimulus values XYZ, as well as the illuminance of light sources. This instrument meets the CIE standard of photopic spectral response and the photosensor used is a silicon photocell that has a measuring rate of one sample per second and can measure up to an accuracy level of xy. The repeatability of each measurement has an accuracy of xy
(standard illuminant A measured).Footnote38 The CIE standard illuminant A is used in photometry and colorimetry as primary reference spectrum for the calibration of the photometric and colorimetric devices ().Footnote39
Table 2 Direct condition monitoring (CM) data.
Direct CM data are likely to be insufficient and so data about the environmental conditions that might affect the degradation process, such as sensor data for temperature, relative humidity and light levels, should also be considered and used to estimate the condition of the silk. For the scope of this research, data about light levels, relative humidity and temperature have been included, as indirect CM data from the available sensors. The sensor readings were collected in Date Time variable format.
3 Condition monitoring (CM) data pre-processing
Data pre-processing or feature extraction includes data cleaning, data quality evaluation and segmentation. This helps in identifying valuable parts of data whilst increasing the efficiency of data analysis by removing unwanted segments and redundancy. The data analysis techniques for data pre-processing or signal processing can be generally classified as statistical methods and engineering knowledge-based methods. Some of these techniques, such as distance evaluation technique (DET) in its various versions, can be applied such as the Euclidean distance evaluation technique (EDET), two-stage feature selection and weighting technique (TFSWT).Footnote40 Both forms of CM data gathered, direct and indirect, were processed to remove redundancies and improve data efficiency.
To maintain the consistency of readings, equidistant multiple readings were taken of a pre-selected area of the silk. The readings were taken in-situ, using a stabilising accessory to hold the instrument in place, at a precise and repeatable distance of 10cm from the surface of the sample to minimise sampling errors and with an active diameter of 5cm. To test reproducibility of the results, three measurements were taken from the same sample area. Object archives relating to re-upholstery records suggest that the silk has not been removed from the chair since the last re-upholstery in 1956. Furthermore, the collection’s records confirm that the silk upholstery has been consistently on display in the Wallace Collection. Therefore, exposure to any other undocumented external environmental conditions cannot be fully excluded for while determining the fade rate of the silk. However, the use of the instrument in-situ provides an advantage over traditional accelerated aging methods as it facilitates the taking of multiple measurements, thereby reducing the chance of errant measurements. Furthermore, it doesn’t involve any movement of samples from their display location to a laboratory.
The three different environmental conditions to which the three silk fabric samples have been exposed to are detailed in above. In the Wallace Collection’s Great Gallery, Sample 1 stands as representing the longest-displayed artifact, showcasing the historically accurate silk replica fabric since 1956. Sample 2, also made of historically correct silk replica fabric, is from furniture that underwent re-upholstery in 1991 using the same fabric from 1956. The excess silk fabric was carefully stored and later utilised for re-upholstery purposes in 1991, enabling its continued display in the Great Gallery up until the present day. Both samples 1 and 2 have been exposed to stable controlled environments during their respective times on display with a yearly average temperature recorded as 17–21°C, a relative humidity of 45–55%, and illuminance between 45 and 55lx. Sample 3 is an offcut of the historically accurate silk replica fabric roll from 1956 and has been kept in storage since then with a protective covering and under controlled conditions: a temperature range of 16–20°C, relative humidity of 40–60%, and exposure to light being from zero to minimal.
The indirect CM value data were collected in the form of sensor readings from the collection environment. The sensor data included light levels, UV, relative humidity and temperature. Environmental data for the Great Gallery were available for the period 2014–2017, while for the period 1956–2014, data points were derived from archived thermographs and previous records at The Wallace Collection to establish a complete picture of the historical environmental conditions. Due to the absence of UV data, UV light has not been included in the prognostic modelling in this instance, however, the rest of the environmental parameters for temperature, relative humidity and illuminance were utilised. In 2007 museum grade UV light conservation filters (Sun-X MT65) were applied and these reduced UV light transmission to <0.1%.Footnote41 In 2012, these filters were supplemented with the Sun-MT35, which included heat reduction combined with reduced UV light transmission. Reduced UV light diminishes silk colour fading, possibly due to the application of effective UV conservation filters over time, hence hasn’t been included in the forecasting, although, the mathematical model allows for UV inclusion in prognostic modelling if sensor data permits.
4 Mathematical model derivation
To predict the rate of fade within the museum environment, a mathematical fade model was postulated that adopts an exponential decay model to determine the silk colour fade rate and to predict the RUL of the silk. Environmental conditions play a significant role in controlling the deterioration processes through which materials are susceptible to degradation,Footnote42 and silk discoloration is dependent on temperature, relative humidity, ultraviolet and visible light.Footnote43 Colour fade is due to the degradation of dyes in the fabric which results in different degrees of loss of intact dye molecules.Footnote44 Increased light and higher RH results in greater colour change, and dyed silks, when kept in the dark, are practically unaffected.Footnote45 Based on the published studies on silk dye fade, it can be postulated that the rate of change with time of the silk degradation, D, is defined in terms of colour fade:
(1)
(1)
(2)
(2)
(3)
(3) where RH is relative humidity (in %),
is visible light (Illuminance) (in lx), UV is ultraviolet exposure (in mW/cm2),
is a weight constant for the two light sources, and
is the Arrhenius constant. The Arrhenius constant equation is
, where A is a pre-exponential factor, Ea is activation energy, R is the universal gas constant and T is the absolute temperature in Kelvin. The Arrhenius equation is an expression of the energy required to drive a reaction due to the effect of temperature, and hence can be seen as being the reaction rate. The known universal gas constant, R, and activation energy, Ea, are the unknowns. The rate of a reaction depends upon a number of factors, including absolute temperature, and activation energy. This may be expressed in the Arrhenius equation. They can be transformed (bundled) into the formulated unknown model parameters. Although UV light may be a causal factor, it has not been included in the model development because of the use of UV filters as described.
The fading of the colours in textiles is denoted as . If
denotes the silk colour state (for example a colour measurement over an area), and dye molecules are converted from colour to non-colour by the process of discoloration
, i.e. the rate of degradation depends on how much colour is left in an area. Hence it can be postulated that:
(4)
(4) Visible light and UV light induce damage to dyed silk visually, structurally and chemically.Footnote46 Light enables the photodegradation process to activate causing structural degradation and fluctuations in RH.Footnote47 It can be assumed that light is a source of energy which could be additive in its effect,Footnote48 that relative humidity enables the photodegradation to occur chemically, and that temperature increases the rate of reaction.Footnote49
Combining the relations expressed with (1)–(4), it can be postulated that:
(5)
(5) The Arrhenius equation can re-arranged and written as:
(6)
(6)
(7)
(7)
(8)
(8)
(9)
(9)
Hence Equation (5) can be written as,
(10)
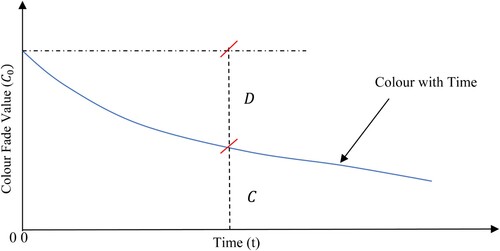
(10) An exponential decay model adopted to determine the rate of silk degradation,
as detailed in .
Where is the colour of silk at time
,
is the colour of silk fabric at time
.
(11)
(11)
(12)
(12)
(13)
(13)
(14)
(14)
Fig. 3 Exponential colour degradation model.
From Equation (10), put
(15)
(15)
(16)
(16) From Equation (14),
(17)
(17) Equation (17) is an ordinary differential equation and is widely used in growth and decay rate modelling. The solution of this equation can be derived as follows:
(18)
(18)
(19)
(19)
(20)
(20)
(21)
(21)
(22)
(22)
(23)
(23) Temperature and light are both sources of energy which could be additive in their effect and the Arrhenius constant
is written in terms of energy to drive a reaction and that RH facilitates the reaction. The Arrhenius constant can be linearised as the temperature values of the museum are fairly consistent, thus resulting in a modified expression of Equation (15):
(24)
(24) Where,
are constants which have to be solved for,
is the linearised expression of the temperature effect. For most reactions, the reaction rate doubles for each 10°C rise around room temperature.Footnote50 This approximation has also been adopted in testing biomaterials and medical devices.Footnote51 The general linear equation for the temperature effect is detailed in .
The linearised equation for the reaction rate n is expressed as:
(25)
(25) where,
is temperature,
and b are constants.
Fig. 4 Linearisation of the temperature effect.
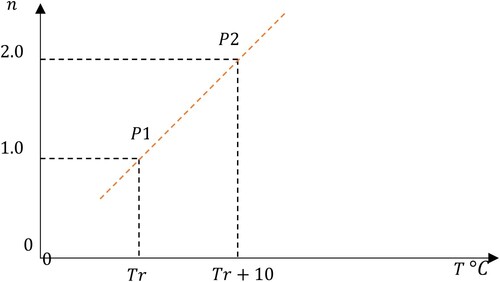
At room temperature , i.e. at
(26)
(26)
(27)
(27) Equation (26) and Equation (27) give
(28)
(28)
(29)
(29) Substituting in Equation (25) gives,
(30)
(30)
(31)
(31) Hence, the reaction rate
can be expressed as:
(32)
(32)
(33)
(33)
(34)
(34)
The minimum temperature of the room taken at , hence, it can be postulated that Equation (24) can be re-written by integrating Equation (32) as follows:
(35)
(35) where
constant which is a function of mean temperature T
linearised, Relative Humidity (RH), light levels (lx) over time t.
Therefore, integrating the values of Equation (23) and Equation (35) the fade model to be used is:
(36)
(36) Thus, the final fade model can be extrapolated as follows:
(37)
(37)
(38)
(38) where
(forecasting time horizon)
= Averaged values of temperature (in Kelvin), humidity (in %) and light (in lux) for the time period
= condition at time
the condition at time
= model constants.
Time intervals are in the unit of years, but can also be in the unit of months, weeks or days. The data points which link colour condition to time are limited. Hence, reference to causal information in publications detailing silk studies, as well as with relevant experts in museums, helps to inform the model. As such, the simplest empirical exponential decay model is derived as an optimal fit for the silk fade. The constant is the new silk condition and as a parameter this should be known. In the case of historic silk, where such a new condition is not possible to measure,
can be treated also as an unknown parameter and be estimated along with
. These unknowns are solved using the measured data in silk conditions by minimising the model prediction error for the model expression (Equation (38)). provides a detailed illustration of the model development approach.
Fig. 5 Overall data-driven model for silk colour condition.
Results
The XYZ colour space is not visually uniform, and the visual non-uniformity can be reduced by linear or non-linear mathematical transformations.Footnote52 The original measured values are combined into a single value as shown in Equation (39), to calculate the distance of the measured value from origin.
(39)
(39) Here, C is a measurement of the same silk object at a time t, detailed in .
Table 3 Colour condition reference value.
The research acknowledges the limited data linking colour condition to time, so the exponential model utilises three main data points for model building and one condition data point is used for validation. As the number of colour condition data points are so few, the simplest possible model is developed, to determine the unknown constants, ,
,
These unknown constants are solved using the measured data in conditions 1, 2 and 3. Using an optimisation method, the error between the model predictions and the measured values for these three conditions is minimised. The notion of using the superscript of (s) was adopted, to associate with the sample being calculated;
. For example,
is the reference to the silk sample being on display since 1956.
Following on from Equation (37),
(40)
(40)
(41)
(41) The measured value for silk colour condition
with the chroma meter, for silk exposed to cumulative environmental degradation condition (s) is denoted as
.
The difference between the measured colour value for sample conditions 1, 2 and 3, and the associated model predicted values
are used to define an objective function,
as follows:
(42)
(42) This is a function of the unknown model parameters,
, that needed to be identified to establish the colour degradation model. By minimising
, the values of the model parameters
which provide the best fit to the measured data were obtained. This led to a minimisation problem that was solved using non-linear optimisation methods:
(43)
(43) subject to
(44)
(44) The positive constraints posed on the three solved variables were required as
is a colourimeter measurement and is always positive.
are simply weights for the respective model terms. The exponential model utilises three main data points for model building and one condition datapoint (sample reference 4) is used for validation, as shown in , The model validation variance between model forecast and measured value is 0.9 as seen in .
Fig. 6 Model validation.
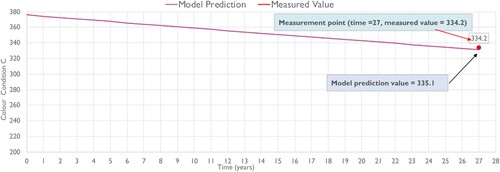
Table 4 Model validation.
It should be noted that in general the colour of a brand-new fabric can be measured and hence the model parameter would be known (this would not need to be solved). However, no brand-new silk sample was available in this case and the colour condition for the unknown brand new (1956) silk,
was postulated through numerical optimisation with a gradient-based search algorithm as depicted in .
Table 5 Model parameters used to predict remaining life.
The exponential decay model of colour fade illustrated in shows an asymptotic curve of degradation of the mathematically derived brand-new silk over time. It illustrates the overall nature of the cumulative damage of the silk fabric with a gradual loss of colour in the initial stages followed by a reduced rate in the later years. It shows predictions over time (in intervals of years) for the colour condition degradation representative for the museum display environment conditions (averaged on a yearly basis): temperature 20.7°C, RH 58% and illumination 55lx.
Fig. 7 Exponential gradient of the fade model derived with numerical optimisation gradient-based search algorithm.
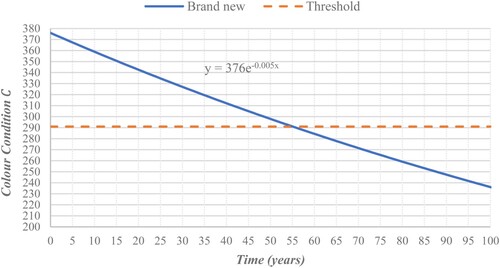
The derived colour condition of , can be assumed to be the brand new colour condition of the silk to develop the predictive model. The minimum threshold for colour fade was assumed to be set at the colour condition value of 290 as seen. The exponential model derived can help determine the cumulative fade of the colour by performing sensitivity analysis.
Predicting RUL—demonstration scenarios
To assess the sensitivity of the silk to the environmental conditions and to determine the impact on the remaining life of the silk, demonstration scenarios are hypothesised (see ). The prognostic model enables the RUL prediction of Sample 2, which has been on display since 1991. It was measured and analysed as exhibiting colour condition value .
Fig. 8 Predicted colour fade gradient of Scenarios 1–10 for Sample 2.
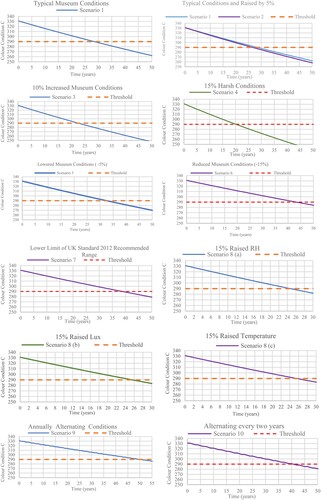
Scenario 1 illustrates the yearly average drawing from the museum’s established historical data. Scenarios 2–8 encompass environmental conditions that substantially differ from Scenario 1.
The simulations are influenced by factors such as the presence of buffering mechanisms, human activity and external influences that impact their outcomes. For instance, events like flooding, leaks, seasonal changes during the rainy season, higher temperatures and increased moisture from rainfall can result in elevated levels of both temperature and relative humidity. Human activity can introduce moisture into the air through actions like perspiration, exhalation or other sources. This additional moisture can affect the absolute humidity, consequently affecting the relative humidity. Scenarios 2–8 involve modelling a closely regulated environment, where the temperature–relative humidity relationship can be independently adjusted. This flexibility enables the creation of risk-based scenarios, as determined by museum professionals, allowing for the possibility of simultaneous increases or decreases in both temperature and relative humidity levels.
Scenarios 9–10 are designed to model the impact of alternating between typical display conditions and storage conditions, based on historical data. This approach aims to understand the potential effects of object rotation on the remaining useful life of the silk within the typical display environment. By simulating these scenarios, we can gain valuable insights into how rotation strategies may influence the silk colour fade over time. provides an overview of the scenarios developed and the results.
Table 6 Overview of the hypothetical scenarios developed for predicting RUL.
Discussion
In Scenario 1, temperature, RH and illuminance are maintained at typically recommended conditions. It can be observed that the RUL, defined at the point that it has reached the acceptable threshold of 290 (defining the minimum acceptable colour condition of the silk, beyond which point it would require replacement), will be reached within 28 years.
In Scenario 2 it can be observed that silk is relatively sensitive to a one unit increase for all three environmental conditions and predicts a reduction by approximately 2 years in the RUL of the silk. This confirms previously published studies suggesting the increased fragility of fabric to marginal increases in the conditions of temperature, humidity and illuminance.Footnote53
Scenario 3 was developed to determine the sensitivity of the silk fabric to an increase of 10% in yearly averages of all three museum environmental conditions. Under this scenario, there is seen to be an adverse impact on the longevity of the silk, reducing the RUL of the fabric by almost 6 years.
In Scenario 4 harsher environmental conditions have been developed. The impact was to see a reduction in the RUL of the silk by 8 years, confirming that the harsher display conditions have a significantly detrimental impact on the longevity of the silk.
Scenarios 5 and 6 reversed the direction in the change of the conditions from the previous scenarios, this time modelling a decrease in the typical museum environmental conditions by 5% and 15%, respectively. A 5% reduction leads to a predicted extension by 4 years in the RUL. Lowering all environmental conditions by 15% prolonged the RUL by 15 years from 28 to 43 years.
Scenario 7 looks to predict the RUL based on conditions at the lower end of acceptable museum standards. Under this scenario, the results showed a marked increase in the RUL by 16 years, from 28 to 44 years.
Scenario 8 seeks to model the sensitivity of the silk to individual parameters, increasing each condition by 15%. It can be observed that the impact of harsher RH conditions decreases the RUL by 3 years, compared to 2 years for temperature and lux. The result indicates that RH impacts the colour fade more than either temperature or lux separately. Further, as seen in Scenario 4 where all the parameters combined were raised by 15%, the predicted RUL decreased more significantly by 8 years, thus reflecting the significance of the combined impact of the environmental conditions on the cumulated fade of silk.
Scenarios 9 and 10 detail the impact of alternating the silk between the typical environmental display conditions of the gallery, and the environmental conditions in museum storage, on an annual basis or on display for 2 years before storing for 1 year. If the silk is annually rotated from display to storage it seems to have a significant impact in prolonging the life of the silk sample fabric from 28 years to approximately 50 years. When the silk is displayed for a longer period, as seen in Scenario 10, the silk fabric fades by a greater amount, whereas Scenario 9 shows that the fabric accumulates less damage when it spends greater time under storage conditions. The most detrimental conditions were demonstrated in Scenario 4, which showed a reduction in the RUL to 20 years.
It should also be noted that, during the research, the opinion of the relevant experts was that colour fade in the silk became observable at the 12–15-year stage when under display conditions. Subjectively, it can be seen that the RUL is roughly double the point at which fade is observable by experts, and anecdotally, there seems therefore to be some consistency between expert opinion and the predicted model, under typical conditions.
Predictive results show the RUL of the fabric in ambient conditions seemed to be prolonged significantly when the object was moved away from museum display conditions. If the silk is rotated annually from display to storage, it has an almost doubling effect on the remaining life of the fabric, although this option would be detrimental to the museum visitor, who, quite reasonably in the case of the Wallace Collection, may want to see the Shrewsbury Set. Indeed, its movement into storage would involve extra staff time and cost, the inconvenience and cost of which can be compared with associated costs of restoring the chairs more frequently.
Conclusion
The originality of the proposed methodology is a novel PHM approach to predict cumulative silk colour fade within monitored environmental conditions. It provides options for prolonging the life of the silk before it reaches the lowest acceptable threshold or point of failure when the silk will no longer be fit for display and may need interventive action. Rather than relying on accelerated aging methods, this study utilises naturally aged samples of the same silk over time to inform the prognostic model. There is an active debate in the conservation community about maintaining museum standards and about the impact of lending artefacts to other museums. The suggestion here is that museum professionals can utilise the prognostic model to assess the impact of environmental parameters on the rate of silk colour fade by adjusting temperature, relative humidity and lighting conditions based on real-time data for the silk artifacts in-situ. This research attempts to provide an empirical method demonstrated through qualitative data relating to the natural aging of silk artefacts on display, under controlled museum environmental conditions.
The research on silk conservation reviewed in this work was found to rely on accelerated aging methods to determine fade, with limited study on other non-invasive and non-destructive in-situ techniques. Most of the techniques discussed have proved their effectiveness in laboratory tests, however these have invariably still required the use of micro-sampling, such as fibres in most studies. This is not necessarily a practical and efficient methodology when dealing with artefacts such as upholstery or tapestries, which cannot be easily moved from their display for analysis.
To enhance the proposed PHM methodology, it is strongly advised to extend the approach by systematically gathering colour condition data from various silk collections at regular intervals. This process will establish a comprehensive repository of direct colour fade data and correlate it with specific environmental conditions. This could involve incorporating new fabric samples from recent re-upholstery projects or sourcing original samples of historical significance. It is crucial to ensure that a systematic process for regularly documenting natural colour fade data is kept. To enhance the proposed approach for predicting silk degradation, it is suggested to broaden the causal parameters to include pollutants and the impact of footfall on silk artifacts. This extension will enrich the methodology and enable a more comprehensive understanding of the deterioration factors affecting silk. While the current approach focusses on colour fade, there is the potential to apply this novel method to other coloured textiles and artifacts, such as painted wood objects or marquetry.
Acknowledgements
The authors extend their heartfelt gratitude to The Wallace Collection for generously providing invaluable environmental sensor data and granting access to the ‘Shrewsbury Set’. Additionally, we wish to express our appreciation to Jürgen Huber for his invaluable contributions, engaging in insightful discussions surrounding the historical and economic implications of conserving silk within museum collections.
Additional information
Notes on contributors
Aditi Rawal
Aditi Rawal is an Academic Portfolio Lead for Computer Science at the University of Greenwich, London. She has over 21 years experience in systems analysis and design, including software development methodologies. She obtained her PhD in 2021 with her research, ‘Diagnostic and Prognostic Methodology for Monitoring Silk Fade in a Museum Environment’ from the University of Greenwich. She developed a non-invasive and non-destructive methodology for condition-based monitoring of silk. Her research interests revolve around system analysis methodologies, data analysis and prognostic modelling for historic artefacts in museum settings. She is a Senior Fellow of the Higher Education Academy (SFHEA) and is a member of the British Computing Society (BCS).
Peter Mason
Peter Mason is a civil engineer, now retired and until recently a visiting professor at the universities of Greenwich and Surrey. He has worked on many heritage structures, including the Cutty Sark, SS Great Britain and the Clifton Suspension Bridge. Throughout his long and varied career as an engineering designer, he has paid particular attention to the predictive mathematical modelling of degradation so that quantified correlations with environmental conditions could be found, leading to planned-for maintenance and extended useful life.
Stoyan Stoyanov
Stoyan Stoyanov is a Reader in Computational Engineering and Head of the Computational Mechanics and Reliability Group at the School of Computing and Mathematical Sciences. His research interests include the development and application of modelling and simulation tools for numerical analysis of the performance, degradation and reliability of materials, with a focus on mechatronics physical systems, physics-of-failure modelling, computational intelligence for data-driven and prognostic modelling, and heritage digital conservation. He has published over 130 peer-reviewed articles.
Chris Bailey
Chris Bailey earned a PhD in computational modelling from Thames Polytechnic, UK in 1988. He served as a Research Fellow at Carnegie Mellon University from 1988 to 1991, and later joined the University of Greenwich, London, where he became a professor in computational mechanics and reliability from 2001 to 2022. He currently serves as Professor and Centre Director at Arizona State University, USA. His research focusses on multi-physics modelling, engineering reliability, optimisation, and prognostics and health management. With over 400 publications, he is a Senior Member of IEEE and a Member of the IEEE Electronic Packaging Society Board of Governors.
Jurgen Huber
Jurgen Huber is Senior Furniture Conservator at The Wallace Collection (ACR), where he is responsible for preventive and interventive conservation of furniture and related works. After completing a 3-year apprenticeship in cabinetmaking in 1987, and following the journeyman tradition in Germany and France, he gained a ‘Meister im Tischlerhandwerk’ in 1992. Having learned a very practical approach to restoration, he completed a 3-year conservation course, gaining a postgraduate diploma in conservation studies in 1998. Since then he has had the opportunity to work for various other institutions abroad and in the UK.
Notes
1 See, for example, Rui Dang et al., ‘Spectral Damage Model for Lighting Paper and Silk in Museum’, Journal of Cultural Heritage 45 (2020): 249–53, https://www.sciencedirect.com/science/article/pii/S1296207419307228 (accessed 10 February 2024).
2 Cf. Patricia Annis, ‘Silk Durability and Degradation’, in Understanding and Improving the Durability of Textiles (Oxford: Woodhead/Elsevier, 2012), 205–31.
3 Cf. Margaret J. Smith and Karen Thompson, ‘Forensic Analysis of Textile Degradation and Natural Damage’, in Forensic Textile Science, ed. Debra Carr (Oxford: Woodhead/Elsevier, 2017), 41–69.
4 See, for example, Samaneh Sharif and Vahid Esmaeili, ‘Effects of Temperature and Relative Humidity on Permanence of Buyid Silk’, Journal of Cultural Heritage 27 (2017): 72–9.
5 Cf. Tim Padfield, The Preservation Index and the Time Weighted Preservation Index, https://www.conservationphysics.org/twpi/twpi_01.html (accessed 10 February 2024).
6 Cf. Smith and Thompson, ‘Forensic Analysis of Textile Degradation and Natural Damage’, 41–2.
7 See, for example, Francisco Vilaplana et al., ‘Analytical Markers for Silk Degradation: Comparing Historic Silk and Silk Artificially Aged in Different Environments’, Analytical and Bioanalytical Chemistry 407 (2015): 1433–49.
8 Beata Gutarowska et al., ‘Historical Textiles—A Review of Microbial Deterioration Analysis and Disinfection Methods’, Textile Research Journal 87, no. 19 (2017): 2388–406; Paul Garside et al., ‘An Investigation of Weighted and Degraded Silk by Complementary Microscopy Techniques’, Heritage Science 11 (2014): 15–21. See, for example, Julio M. del Hoyo-Meléndez and Marion F. Mecklenburg, ‘Micro-Fading Spectrometry: A Tool for Real-Time Assessment of the Light-Fastness of Dye/Textile Systems’, Fibers and Polymers 13 (2012): 1079–85.
9 Cf. Naomi Luxford, David Thickett, and Paul Wyeth, ‘Preserving Silk: Reassessing Deterioration Factors for Historic Silk Artefacts’, in Natural Fibres in Australasia: Proceedings of the Combined (NZ and AUS) Conference of The Textile Institute, Dunedin 15–17 April 2009, ed. Cheryl Anne Wilson and Raechel Laing (Dunedin, New Zealand: The Textile Institute 2009), 151–7; cf. for example, Naomi Luxford and David Thickett, ‘Designing Accelerated Ageing Experiments to Study Silk Deterioration in Historic Houses’, Journal of the Institute of Conservation 34, no. 1 (2011): 115–27.
10 Cf. Roman Kozlowski, ‘Collection Environments and Evidence-Based Decision-Making’, Conservation Perspectives, The GCI Newsletter (Fall 2018): 13–5, https://www.getty.edu/conservation/publications_resources/newsletters/pdf/v33n2.pdf (accessed 12 February 2024).
11 Cf., for example, Foekje Boersma et al., ‘The Managing Collection Environments Initiative: A Holistic Approach’, Conservation Perspectives, The GCI Newsletter (Fall 2018): 10–2, https://www.getty.edu/conservation/publications_resources/newsletters/pdf/v33n2.pdf (accessed 12 February 2024).
12 Cf. for example, Jaroslav Valach et al., ‘Everything Is Data—Overview of Modular System of Sensors for Museum Environment’, International Archives of the Photogrammetry, Remote Sensing and Spatial Information Sciences—ISPRS Archives 40, no. 5W7 (2015): 439–42.
13 Cf. Kozlowski, ‘Collection Environments and Evidence-Based Decision-Making’.
14 See, for example, Bo Sun et al., ‘Benefits Analysis of Prognostics in Systems’, Prognostics and System Health Management Conference, Macao, China (2010): 1–8, https://ieeexplore.ieee.org/document/5413503 (accessed 12 February 2024).
15 Cf. for example, Cheng Lu et al., ‘A Prognostic Model for Overall Survival of Patients with Early-Stage Non-Small Cell Lung Cancer: A Multicentre, Retrospective Study’, The Lancet Digital Health 2, no. 11 (2020): e594–e606, [online] http://www.sciencedirect.com/science/article/pii/S2589750020302259 (accessed 12 February 2024).
16 See, for example , Jie Yang et al., ‘Elevated Cardiac Biomarkers May be Effective Prognostic Predictors for Patients with COVID-19: A Multicenter, Observational Study’, The American Journal of Emergency Medicine 39 (2021): 34–41, https://doi.org/10.1016/j.ajem.2020.10.013 (accessed 12 February 2024).
17 See, for example, Gibeom Kim et al., ‘Application of Particle Filtering for Prognostics with Measurement Uncertainty in Nuclear Power Plants’, Nuclear Engineering and Technology 50, no. 8 (2018): 1314–23, http://www.sciencedirect.com/science/article/pii/S1738573318302742 (accessed 12 February 2024).
18 See, for example, Abhinav Saxena et al., ‘Metrics for Evaluating Performance of Prognostic Techniques’ (presented at 2008 International Conference on Prognostics and Health Management, Denver, CO, 2008): 1–17, https://ieeexplore.ieee.org/document/4711436 (accessed 12 February 2024).
19 See, for example, The Wallace Collection (no date), The Collection, https://www.wallacecollection.org/collection/ (accessed 15 July 2021). Part of the ‘Shrewsbury Set’ is shown here: https://wallacelive.wallacecollection.org:443/eMP/eMuseumPlus?service=ExternalInterface&module=collection&objectId=63397&viewType=detailView (accessed 12 February 2024).
20 See for example, Piero Baraldi et al., ‘Model-Based and Data-Driven Prognostics under Different Available Information’, Probabilistic Engineering Mechanics 32 (2013): 66–79.
21 See, for example, Dennis Hoffman, ‘Prognostics and Health Management (PHM )/Condition Based Maintenance’, IEEE Reliability Society 2007 Annual Technology Report (2007): 1–7, https://rs.ieee.org/images/files/Publications/2007/2007-15.pdf (accessed 12 February 2024).
22 Cf. Sun et al., ‘Benefits Analysis of Prognostics in Systems’, 1.
23 See, for example, Behnoush Rezaeianjouybari and Yi Shang, ‘Deep Learning for Prognostics and Health Management: State of the Art, Challenges, and Opportunities’, Measurement 163 (2020): 107929, https://doi.org/10.1016/j.measurement.2020.107929 (accessed 12 February 2024).
24 See, for example, Huiguo Zhang, Rui Kang, and Michael Pecht, ‘A Hybrid Prognostics and Health Management Approach for Condition-Based Maintenance’ (presented at the 2009 IEEE International Conference on Industrial Engineering and Engineering Management, Hong Kong, China, 2009): 1165–9, https://doi.org/10.1109/IEEM.2009.5372976 (accessed 12 February 2024).
25 See, for example, Olga Fink et al., ‘Potential, Challenges and Future Directions for Deep Learning in Prognostics and Health Management Applications’, Engineering Applications of Artificial Intelligence 92 (2020), https://doi.org/10.1016/j.engappai.2020.103678 (accessed 12 February 2024).
26 See, for example, Gregory W. Vogl, Brian A. Weiss, and Moneer Helu, ‘A Review of Diagnostic and Prognostic Capabilities and Best Practices for Manufacturing’, Journal of Intelligent Manufacturing 30, no. 1 (2019): 79–95.
27 Cf. Baraldi et al., ‘Model-Based and Data-Driven Prognostics under Different Available Information’.
28 See Zhang, Kang, and Pecht, ‘A Hybrid Prognostics and Health Management Approach for Condition-Based Maintenance’.
29 See, for example, Chao Hu et al., ‘Ensemble of Data-Driven Prognostic Algorithms for Robust Prediction of Remaining Useful Life’, Reliability Engineering & System Safety 103 (2012): 120–35.
30 See, for example, Xiao-Sheng Si et al., ‘Remaining Useful Life Estimation—A Review on the Statistical Data Driven Approaches’, European Journal of Operational Research 213, no. 1 (2011): 1–14.
31 See Vogl, Weiss, and Helu, ‘A Review of Diagnostic and Prognostic Capabilities and Best Practices for Manufacturing’.
32 See, for example, Kwok L. Tsui et al., ‘Prognostics and Health Management: A Review on Data Driven Approaches’, Mathematical Problems in Engineering 2015 (2015): 793161, https://doi.org/10.1155/2015/793161 (accessed 12 February 2024).
33 See, for example, Jay Lee et al., ‘Introduction to Data-Driven Methodologies for Prognostics and Health Management’, Probabilistic Prognostics and Health Management of Energy Systems (2017): 9–32, https://doi.org/10.1007/978-3-319-55852-3_2 (accessed 12 February 2024).
34 Si et al., ‘Remaining Useful Life Estimation’.
35 Tsui et al., ‘Prognostics and Health Management’.
36 See, for example, Hidehiko Murata, Kotaro Saitoh, and Yasuhiko Sumida, ‘True Color Imagery Rendering for Himawari-8 with a Color Reproduction Approach Based on the CIE XYZ Color System’, Journal of the Meteorological Society of Japan 96B (2018): 211–38.
37 See, for example, Noor Ibraheem et al., ‘Understanding Color Models: A Review’, ARPN Journal of Science and Technology 2, no. 3 (2012): 265–75.
38 See, for example, TES Electrical Electronic Corporation, TES 136 Chronometer Product Information, 2020, http://www.tes.com.tw/en/product_detail.asp?seq=363 (accessed 13 March 2024).
39 International Ciommiion on Illumination (CIE), ‘Colorimetry—Part 2: CIE Standard Illuminants’, http://cie.co.at/publications/colorimetry-part-2-cie-standard-illuminants (accessed 14 November 2022).
40 Tsui et al., ‘Prognostics and Health Management’.
41 Sun-X (n.d), ‘Conservation: Window Films and Blinds’, https://www.sun-x.co.uk/conservation (accessed 17 June 2021).
42 Cf. Susan M. Bradley, ‘Do Objects have a Finite Lifetime?’, in Care of Collections: Leicester Readers in Museum Studies (Oxford: Routledge, 1994), 51–8.
43 Cf. J.N. Chakraborty, Fundamental and Practices in Colouration of Textiles (New Delhi; CRC Press, 2015), 453.
44 Cf. Cheunsoon Ahn et al., ‘Thermal Degradation of Natural Dyes and their Analysis using HPLC-DAD-MS’, Fashion and Textiles 1, no. 22 (2014), https://doi.org/10.1186/s40691-014-0022-5 (accessed 13 March 2024).
45 Cf. for example, Paul Garside and Emma Richardson, Conservation Science: Heritage Materials (Cambridge: RSC Publishing, 2006), 331–87; David Saunders and Jo Kirby, ‘National Gallery Technical Bulletin: The Effect of Relative Humidity on Artists’ Pigments’, National Gallery Technical Bulletin 25 (2004): 62–72.
46 See, for example, Athina Vasileiadou, Ioannis Karapanagiotis, and Anastasia Zotou, ‘UV-Induced Degradation of Wool and Silk Dyed with Shellfish Purple’, Dyes and Pigments 168 (April 2019): 317–26.
47 See, for example, Hongling Liu et al., ‘Secondary Structure Transformation and Mechanical Properties of Silk Fibres by Ultraviolet Irradiation and Water’, Textile Research Journal 89, no. 14 (2019): 2802–12, https://doi.org/10.1177/0040517518803788 (accessed 13 March 2024).
48 Cf. Harry Spaling, ‘Cumulative Effects Assessment: Concepts and Principles’, Impact Assessment 12, no. 3 (1994): 231–51.
49 Cf. Robert Eliason and Terence McMahon, ‘Temperature Effect on Reaction Rates’, Journal of Chemical Education 58, no. 4 (1981): 354, https://doi.org/10.1021/ed058p354.1 (accessed 13 March 2024).
50 See, for example, Eliason and McMahon, ‘Temperature Effect on Reaction Rates’.
51 See, for example, David Hukins, Aziza Mahomed, and Stephen Kukureka, ‘Accelerated Aging for Testing Polymeric Biomaterials and Medical Devices’, Medical Engineering & Physics 30, no. 10 (2008): 1270–4, https://doi.org/10.1016/j.medengphy.2008.06.001 (accessed 13 March 2024).
52 Cf. Asim Kumar Roy Choudhury, ‘3-Colour-Difference Assessment’, in Principles of Colour and Appearance Measurement (Oxford: Woodhead Publishing, 2015), 55–116, https://doi.org/10.1533/9781782423881.55 (accessed 13 March 2024).
53 Cf. Eric May and Mark Jones, Conservation Science: Heritage Materials (Cambridge: RSC Publishing, 2006), 73–83; Sharif and Esmaeili, ‘Effects of Temperature and Relative Humidity on Permanence of Buyid Silk’.