
 ?Mathematical formulae have been encoded as MathML and are displayed in this HTML version using MathJax in order to improve their display. Uncheck the box to turn MathJax off. This feature requires Javascript. Click on a formula to zoom.
Abstract
Resilient historical cities are the product of evolution and they have been shaped by incremental adaptation to fluctuations and by shocks of various magnitudes. Adaptive complex cities operate as systems and they obey certain universal laws: the distribution of elements reflects organic growth processes, such as the ones described by allometric growth and inverse power laws in biology. Their elements and connections organization does not obey Gaussian laws (concentration around averages). They are not aggregates of inert elements but integrated highly differentiated self-organized wholes. They exhibit a hierarchical configurational order characteristic of complex adaptive systems, with nested subsystems ordered in a hierarchy of scales united by mathematical regularities. Planners need to be aware of these laws of adaptive complexity and plan with rather than counter to these emergent properties in order to enhance resilience. Understanding the universality of complex systems order, which characterizes living systems, and which modernist city planning has violated, would allow planning more resilient cities.
1. Introduction: planning for urban resilience requires a systemic approach
1.1. The paradox of modern planning: what is the role of planners in complex systems with emerging properties?
In a recent essay, Michael Batty and Stephen Marshall (Citation2016) identify the key paradox of modern urban planning which seeks to intervene in systems that have enormous complexity, growing and evolving rather than being designed in any top-down fashion. This has fundamental implications for examining the resilience of cities not as engineered optimized systems but as organic evolving systems which follow the laws of resilient natural systems. The present article elaborates this question through the identification of universal laws organizing space and connectivity in resilient complex systems and derives from these laws the implications for planning.
1.2. The tension between efficiency and resilience
Managing cities for resilience – the capacity to maintain function in response to perturbation – and for efficiency is among the most pressing socioeconomic and ecological imperatives of our time. Urban resilience measures the capacity of a system to maintain function and make structure evolve in the face of disturbance. The variability of urban systems at multiple scales in time and space makes understanding urban resilience a task even more challenging.
In complex systems, organization at system’s level emerges from the feedback loops that characterize the system as a whole. This makes optimization of separate parts for specific goals having unexpected effects on the efficiency and resilience of the system as a whole.Footnote1 The challenges of urban resilience are thus by nature deeply systemic. Although each city is unique, there are however several recurring patterns, processes, and properties common to all urban and ecological complex adaptive systems. One of these key patterns is scale hierarchy.
1.3. Scaling laws in complex systems enhance resilience: the watchmakers’ parable
To a Platonic mind, everything in the world is connected to everything else – and perhaps it is. Everything is connected but some things are more connected than others. The world is a large matrix of interactions in which most of the entries are close to zero, and in which, by ordering those entries according to their orders of magnitude, a distinct hierarchic structure can be discerned. (Simon Citation1977)
Diverse cities display striking mathematical regularities similar to those of biological and ecological systems. These regularities take the form of scaling laws, which describe how the structure and function of the system change systematically with scale. Kerkhoff & Enquist (Citation2007) have argued that scaling laws provide a powerful tool for understanding resilience and change in ecological systems. They have demonstrated that systematic departures from expected ecological scaling relationships may indicate particular structuring processes or the perturbation and reorganization of ecosystems. Understanding these regularities and deviations from the regularities may help planning cities for resilience.
Scaling laws emerge from the fact that resilient systems in nature and in human artefacts are wholes built of sub-assemblies (Salat & Bourdic Citation2011). Simon (Citation1962) beautifully captured in the two watchmakers’ parable how hierarchy must be a fundamental property to hold systems together, make them persist, and be resilient to outside influences. The two watchmakers had to construct watches out of 1000 parts each. Tempus’ watch was designed so that if he had partly assembled it and had to put it down to answer the phone, it immediately fell into pieces. On the contrary, Hora’s watch was designed so that he could put together sub-assemblies of about ten elements each, then put together ten of those sub-assemblies into a larger sub-assembly, and so on. Whereas a phone call caused Tempus’ work to fall entirely into pieces, it only caused Hora a sub-assembly to reconstruct. No need to argue further that the probability for Hora to finish a watch was much higher than for Tempus. This parable was meant by Herbert A. Simon to highlight the fact that a complex system made up of coherent sub-assemblies has a greater ability to evolve and adapt quickly to change, accident and fluctuation. For a system to be resilient, it should be developed incrementally and bottom up from the smaller scales. Each spatial scale supports the higher scales in the ascending hierarchy of a complex whole.
2. Background: cities are systems of organized complexity
2.1. Wholeness, organized complexity, and resilience
Cities cannot be resolved into constituted or reconstituted from their parts put together. Interactions are strong enough to create feedback loops, so that relations between parts are far from being linear. Hence the equations describing the behaviour of the whole are not of the same form as the equations describing the behaviour of the parts. Partial processes cannot be superimposed to obtain the total process. To quote von Bertalanffy General Systems Theory (von Bertalanffy Citation1969):
In the contrast between wholeness and sum lies the tragic tension in any biological, psychological, and sociological evolution. (…) As long as a system is a unitary whole, a disturbance will be followed by the attainment of a new stationary state, due to the interactions within the system. The system is self-regulating. If, however the system is split into independent causal chains, regulability disappears ().
Figure 1. Complication versus complexity. Complexity is generated by simple relational or generational rules. Relations between elements generate networks that are scale-free, and exhibit a hierarchical order in their connectivity and in their spatial organization.
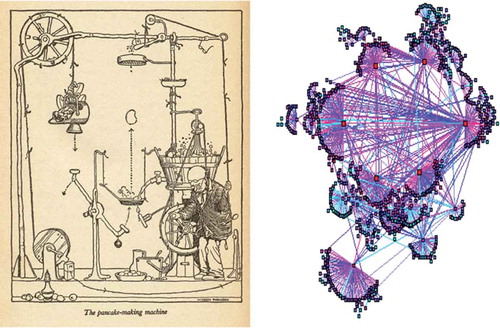
Because of this wholeness, cities are problems of organized complexity, a formulation due to the mathematician and founder of information theory, Warren Weaver (Citation1948). Classical physics, Weaver said, was highly successful in developing the theory of an unorganized complexity. In contrast, cities are systems of organized complexity. These systems have a higher resilience than simple aggregates. Their emerging properties create patterns, which, once established, demonstrate an extraordinary capacity to return to steady states across spatial scales and through time.
2.2. Modernist top-down planning has reduced resilience by suppressing intermediary scales: Le Corbusier’s Radiant City and its application in China
From its very dawn, modernist planning of the twentieth century has been explicitly based on the elimination of complexity and on an additive approach of building the whole as an addition of simplified and enlarged parts while eliminating all intermediary scales. Le Corbusier proposed assembling his Radiant City (Corbusier Citation1933, (1964)) from isolated infrastructures, segregated functions, and a minimal typology of three stand-alone building forms. A supergrid of arterials defines 400 m side superblocks occupied in their centre by mega-building forms standing in isolation. For Le Corbusier, they were the embodiment of Order, with a capital ‘O’: the authoritarian order that was rising in Europe in the 1930s (Jarcy Citation2015; Perelman Citation2015). This creates a summative process but not a complex whole. The Radiant City has no scaling hierarchy, no relationships between scales, no linkages, and no capabilities of further evolution ().
Figure 2. Le Corbusier’s Radiant City, 3D model by Urban Morphology and Complex Systems Institute.
Many variations of Le Corbusier’s Radiant City have been built in China and in emerging cities during the last decades. Between 2000 and 2010, Shanghai only has built the equivalent of the land area of 125% New York City or two-thirds Greater London (World Bank & Chreod Ltd Citation2015) in the form of superblocks with 11 street intersections/km2 and giant blocks more than 400 m side separated by oversized arterials from 60 to 100 m width and filled by high rise widely spaced towers, that is the very morphological features of Le Corbusier Radiant City. These urban forms need two times more energy per household for operation of the built environment, for transportation, and for embodied energy in infrastructures than any other form of urban fabric in China (Yang Citation2010; MIT, Tsinghua University, and Energy Foundation Citation2011). They are not resilient as well as they lack the sublayers of small and medium scales and the nested hierarchies of elements composing sub-assemblies at many different scales that enhance resilience of urban systems.
2.3. Quite the opposite to twentieth-century top-down planned cities, cities designed before the modernist movement grew up bottom up through incremental processes
Historical cities are complex adaptive systems that cannot be separated into elements ( and ). The eighteenth-century map of Roma does not create a division between interior and exterior, between solid masses and empty spaces, between streets and buildings, as we would do today, but rather between:
In black, the complex continuity of streets, squares, large churches interiors, monumental interiors such as the Pantheon (top left) and interior palace courtyards – resulting from the over-layering of centuries and millennia of evolution.
In white, the compact mass of built form, which is the negative space out of which positive public space stands out.
Figure 3. (Left) Map of Roma drawn by Giambattista Nolli in 1748.
Figure 4. (Right) Brasilia. In the modernist movement, the continuous public space is replaced by a formless empty space between buildings – a space divested of its positivity and complexity and which thereby becomes pure negativity.
Source: Salat et al. (Citation2011).
In many historical European cities, the land plots and the street grid can be traced back to the Middle Ages, and even to the Roman Empire. These cities were slowly transformed by incremental phenomena of destruction and reconstruction of the urban fabric through many spatial and temporal scales. In a process of self-organization to adapt their forms to fluctuations in their environment, historical cities acquired the capacity to absorb fluctuations by reinforcing their structure and order, and becoming more complex. Quite the opposite, modernist reductionist approach aims at assembling cities once and for all like machines made of giant components at only one scale.
3. Methodology: scaling and power laws in urban systems
3.1. Complex urban systems, scaling laws, and resilience
Cities and ecological systems exhibit collective dynamics that emerge from the behaviours of individual agents, mediated through levels of interaction and aggregation.2 At the scales of cities and systems of cities, corresponding to the scale of ecosystems, new properties emerge and characterize the collective entity: universal laws in spatial patterns that order urban space as a whole with mathematical regularities across a huge variety of different cities. In spite of their variety, they present simple statistical ordering patterns of population or economic densities and similar patterns of connectedness and flows.
Is the essence of these urban hierarchies social and political, or is it the product of physical constraints generating the same kind of statistical distributions in urban systems as are found in natural systems? Among the proposed explanations are: ‘an intentional functional organisation for the purpose of controlling a territory; the application of a spatial economic equilibrium principle; the statistical addition of Pareto-like elementary phenomena; a ‘purely’ random growth process; self-organisation of settlement subsystems under a space-time optimisation principle; co-evolution of competing subsystems under territorial and social constraints, and so forth’ (Pumain Citation2006). These regularities and their proposed explanations suggest strong similarities between urban dynamics and ecological systems.Footnote3
Scaling studies in cities as well as in ecosystems begin with the premise that these systems will exhibit strong, quantitative regularities, and that aspects of these regularities (e.g. the values of scaling exponents) will be predictable on the basis of theories describing the relevant underlying processes (Brown & West Citation2000). Once established, scaling laws can be used to generate further predictions (Peters Citation1980) and hypotheses. Scaling highlights mathematical regularities and the predictable characteristics towards which the urban or ecological system will tend to come back after perturbation. Our research hypothesis about urban resilience is similar to that of Kerkhoff & Enquist (Citation2006) for ecosystems:
Ecological scaling relationships may serve as baselines or attractors describing the steady-state structure and functioning of ecological systems; and, as a result, departures from scaling (i.e., the patterning or the magnitude of the residual variation) may serve as indicators of the disproportionate influence of particular structuring processes and their role in organizing, or reorganizing, the ecosystem.
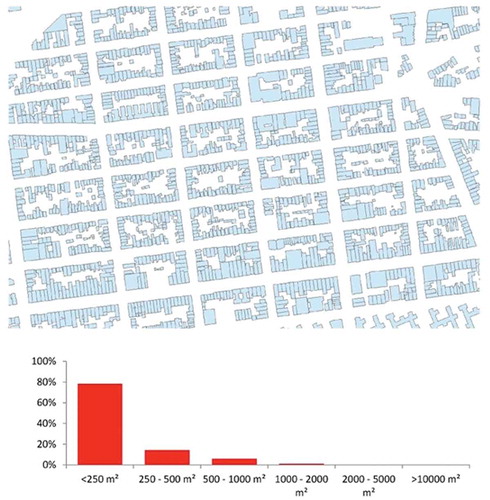
One of these deviations is, for example, in the scaling laws in the size of lot patterns. Salat (Citation2015) has demonstrated the universality of scaling laws relating the size and frequency of land lots across eight centuries of evolution in Paris and two centuries in New York. Ranking the land lots in different neighbourhoods according to their size reveals that the frequency of each size follows an inverse power law of exponent −0.5, a mathematical regularity we will explain in further detail below for New York. This regularity characterizes also Hong Kong, and it is even more striking to notice that it corresponds to the distribution of sizes in a plan scattered randomly. This strong regularity characterizes cities with a high level of fine grain diversity. Quite the opposite, Johannesburg neighbourhoods (Salat et al. Citation2017) diverge strongly from this universal law with lot patterns presenting no or very little differentiation of the size of lots (all identical small lots with no evolution after a century in Soweto, for example, all identical very large lots in Houghton Estate). This divergence to scaling laws points out to regulatory and fiscal barriers to evolution in townships and to the excessive inequality in South African cities that make their urban fabrics locked in the time of their creation with little capability of evolution and adaptation to change.
3.2. Growth and allometric relationships
Allometry is the study of size and its consequences. The term ‘allometry’ designates the differences in proportions correlated with changes in absolute magnitude of the total organism.Footnote4 Allometric scaling in biology is the change of a property at a power function: y = kxa or, in the logarithmic form, log y = a log x + log k, where a is the coefficient of allometry of the organ, or in case of a city of urban property whose growth is expressed as a function of the x, the size of the organism or city to which they relate. This type of scaling in complex adaptive cities is the result of evolutionary growth. These laws reflect cities’ evolutionary processes and underpin the city’s evolutionary architecture, opening up our theory and models of the city to the world of resilience built-in systems by evolutionary processes (Simon Citation1962).
Urban systems exhibiting these properties are not summative. They are the products of growth and integrate the memory of their morphogenesis in their spatial organization. Thus, like living organisms, they cannot be understood by studying the behaviour of their separated parts but by studying the behaviour of the whole.
3.3. Scale hierarchy in urban space and inverse power laws
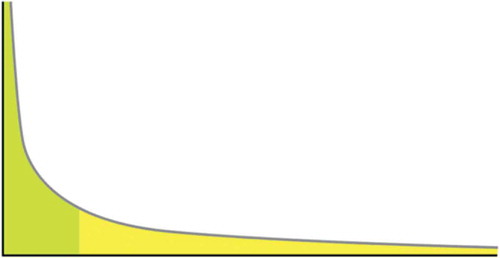
An inverse power law is a continuously decreasing curve, implying that many small events (in size, intensity, density, or connectivity) coexist with a few large events in a mathematical highly structured way () Morphology and Complex Systems Institute, and. An inverse power law relates the very large (or very dense, or very accessible, or very connected), the intermediary (or medium dense, etc.), and the small (or low density, etc.) The frequency of a component of size (density, accessibility, centrality, etc.) x is proportional to the inverse of its size (density, accessibility, centrality) at an exponent m characteristic of the system, , where m is the hierarchy exponent. Inverse power laws in urban space and networks are the mathematical formulation of scaling properties deriving from evolution similar to Herbert Simon’s hierarchical organisation in the watchmakers’ parable. They are connected with processes of differentiation created by the dynamics of evolution, which derive from the laws of systems far from the equilibrium (Prigogine et al. Citation1972, Citation1977). Cities for Prigogine et al. (Citation1972) are like living systems that exhibit a coherent behaviour.Footnote5
Figure 5. The generic form of inverse power laws with peaking values on the left and a ‘long tail’ of low values on the right.
4. Allometry and evolutionary growth: how networks shape cities, the example of Paris
Cities are networks from which locations emerge (Batty Citation2013). Locations are the product of interactions. Thus, we can use the new science of networks (Barabasi Citation2014) to study cities. Power laws characterize also networks in cities; and in biology, in the interaction of molecules within the cell, and in the connections of neurons within the brain. To understand how the allometric growth of networks shapes the distribution of densities in urban space, we will take the example of Paris.
4.1. The allometry of Paris subway network
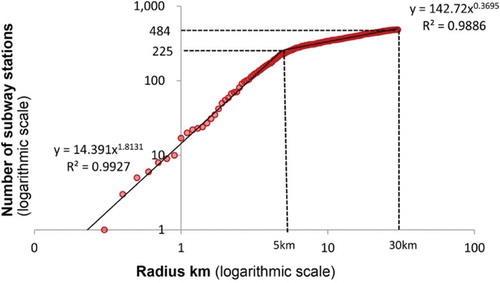
Most subway networks worldwide tend to a long-term limit shape with a core (where a multiplicity of criss-crossing interconnected lines ensure a high level of connectivity and centrality) and radiating branches (Roth et al. Citation2012) ( and ). These two regimes present very different allometric properties. This allometric structure has been first revealed for Paris by Benguigui and Daoud (Citation1991). Allometric analysis of Paris urban rail system reflects the system growth from an initial compact core in 1900–1910 of about 25 km2 and 3 km radius and successive radial branches that initially started from a circular line of about 27 km in length. Within the present core of 5 km radius, the number of stations varies almost at the same power (exponent: 1.8) as the surface (exponent: 2) showing an almost constant density of stations with many highly interconnected criss-crossing lines. At the core limit, a sudden break occurs and the regime changes for radials and a sparser organization: the number of stations decreases sharply with the urban size with an allometric coefficient of 0.37 relating the number of stations to the radius, thus a very rapid decrease in stations density with a −1.63 negative exponent. This huge allometric difference between the core of the network and the branches shapes different levels of accessibility and thus different population density gradients
Figure 6. Density of subway stations in Paris within successive circles with 500 m increments.
Source: Urban Morphology and Complex Systems Institute.
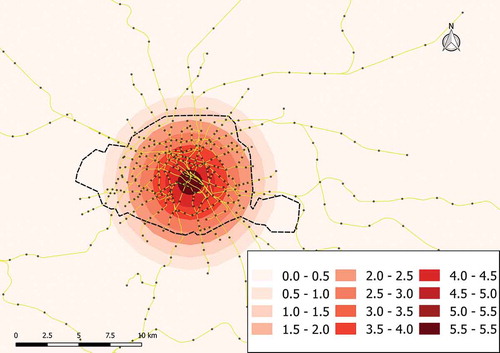
Figure 7. Allometric analysis of Paris subway and urban rail in 2015. On x-axis, radius of successive circles with 500 m increments. On y-axis, number of stations within circle of radius R (logarithmic scale).
Source: Urban Morphology and Complex Systems Institute.
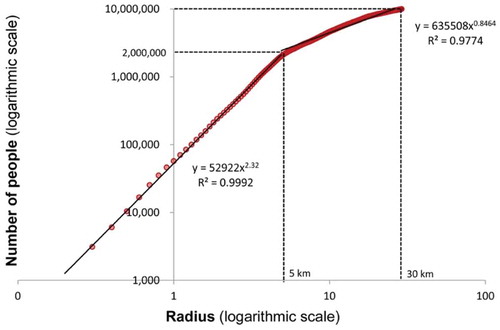
4.2. The allometry of residential densities
In the allometric pattern of population, a dense and uniform compact centre contrasts sharply with a vast diluted periphery with a density decay exponent of −1.16 ( and ). However, the population decreases more slowly than the rail transport network density (−1.63 for stations density). The ratio of the two (1.4) expresses increasing stations lacunarity compared to people number. This reinforces the lack of accessibility in the suburbs beyond the core.
Figure 8. Residential density in Paris within successive circles with 500 m increments.
Source: Urban Morphology and Complex Systems Institute.
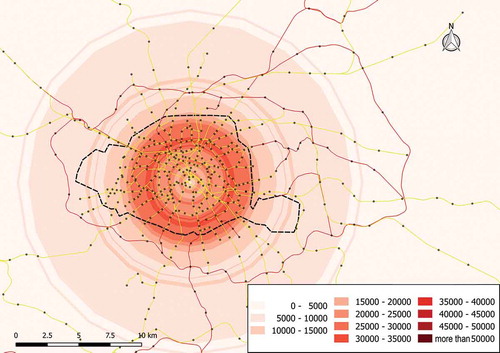
Figure 9. Allometric analysis of Paris population in 2015. On x-axis, radius of successive circles with 500 m increments. On y-axis, number of people within circle of radius R (logarithmic scale).
Source: Urban Morphology and Complex Systems Institute.
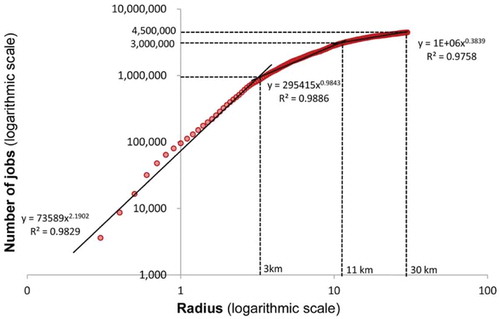
4.3. The allometry of job densities
The allometric analysis of number of jobs in Paris within successive circular increments reveals a ternary system comprising ( and ):
A compact, dense and uniform centre 3 km radius containing a peak of 1 million jobs with an allometric coefficient of 2.2, corresponding to the peak of accessibility of the initial phase of subway construction around 1900, which has determined the entire future trajectory of the city’s concentration patterns of economic activity. Key lesson is that early stages of network construction have lock in effects on urban growth trajectory: a phenomenon that characterizes also Tokyo, London, and New York (Salat & Ollivier Citation2017). The concentration of jobs is stronger in the subway core under the impact of forces of agglomeration that determine firms’ locational choices (Rosenthal & Strange Citation2004).
A peripheral ring from 3 to 11 km radius where the number of jobs decreases with the radius with an allometric coefficient of 0.98 (meaning that the density of jobs decreases with the radius at the exponent −1).
A vast periphery where the number of jobs is diluted very quickly between 11 and 30 km radius with an allometric coefficient of 0.38, that is a job density decreasing at the power −1.4.
Figure 10. Job density in Paris within successive circles with 500 m increments.
Source: Urban Morphology and Complex Systems Institute.
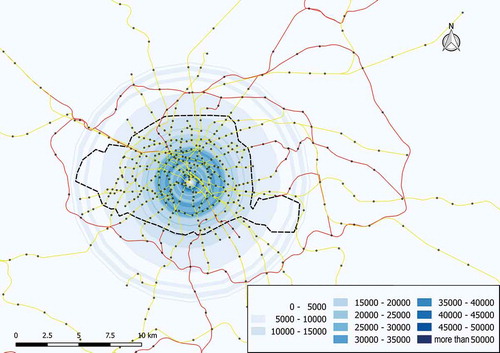
Figure 11. Allometric analysis of Paris jobs in 2015. On x-axis, radius of successive circles with 500 m increments. On y-axis, number of jobs within circle of radius R (logarithmic scale).
Source: Urban Morphology and Complex Systems Institute.
This allometric analysis of Paris shows two systemic consequences of urban growth: the structure of networks (here the subway) and the patterns of densities (here people and jobs) are correlated with similar cores and boundary conditions across time reflecting the successive concentric growth of urban space.
The size and densities of cities put severe constraints on the feasibility of connecting them by transit. Atlanta for example has about the same population as Barcelona but a built footprint 26.5 times larger. Urban rail is accessible at 600 m to 60% of the population in Barcelona but only to 4% in Atlanta. The size and low density of Atlanta renders this city improper for rail transit. Length of metro lines that would be required to reach the same level of rail transit accessibility in Atlanta as in Barcelona would be 3,400 km and the number of stations would be 2,800 (Bertaud Citation2003). The consequence for planning resilient and efficient cities is to combine a dense core and densification along the branches in order to avoid the dilution of population at low density beyond the core and to ensure high levels of accessibility to transit and high levels of transit ridership. This is what has been done through decades of integrated planning of transport and land use in Stockholm and Copenhagen with the positive consequence of decoupling economic growth and resource use (thus increasing efficiency) and increasing resilience (Floater et al. Citation2013, Citation2014).
5. Inverse power laws in urban networks
To understand cities, we must view them not simply as places in space but as systems of networks and flows (Batty Citation2013). To understand space, we must understand flows, and to understand flows, we must understand networks. In this section, we will see that ‘there is an intrinsic order in the number, size, and shape of the various attributes of networks and thus, in turn, of spaces and places that depend on them’ (Batty Citation2013).
5.1. Inverse power laws in subway network centralities
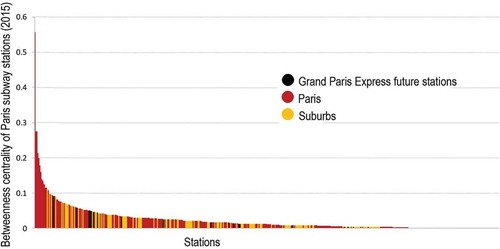
Power laws in networks mathematically formulate the fact that in most real networks, the majority of nodes have only a few links and coexist with a few big hubs, nodes with an anomalously high number of links. The few links connecting the smaller nodes to each other are not sufficient to ensure that the network is fully connected. The relatively rare hubs that keep real networks from falling apart secure this function. Some nodes are also special because many routes through the network pass through them. This is called betweenness centrality and captures the fact that these nodes articulate different parts of the network. In Tokyo, for example, these between-central stations have become the seeds of highly intense urban development along the Yamanote line. Betweenness centrality is also a network property that follows an inverse power law as we will see below.
Subway stations in Paris ranked in the order of their betweenness centrality follow an inverse power law with an exponent of −1 ( and ). This property is universal and we found it in London, New York, and Tokyo. This shows that although the ranking of the centralities in urban networks changes with investments in new infrastructures, the overall hierarchical pattern does not change and even shows a form of universality manifested by a pure Zipf’s law of exponent −1 (Zipf Citation1949). Urban networks do not evolve randomly but readjust continually, restoring hierarchical patterns of organization, thus showing structural resilience.
Figure 12. Map of betweenness centrality of subway stations in Paris.
Source: Urban morphology and Complex Systems Institute.
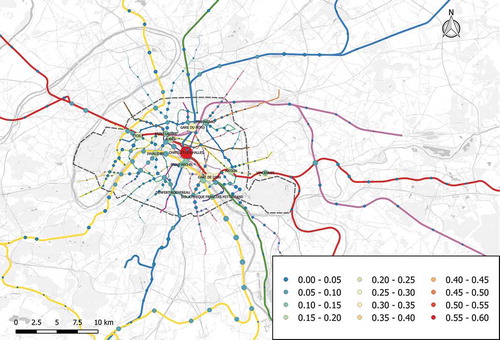
Figure 13. Subway stations in Paris – ranked in the order of their betweenness centrality – follow an inverse power law of exponent −1.
Source: Urban Morphology and Complex Systems Institute.
5.2. Inverse power laws in commuting flows
This section investigates the hierarchical structure of the ‘space of flows’ of contemporary cities (Castells Citation1989). The hierarchical organization of subway networks translates into a hierarchical structure for flows organized by power laws as demonstrated below on the example of Paris ( and ).
Figure 14. The number of commutes between house and jobs is a highly structured graph with a scale hierarchy for the volume of flows.
Source: Urban morphology and Complex Systems Institute.
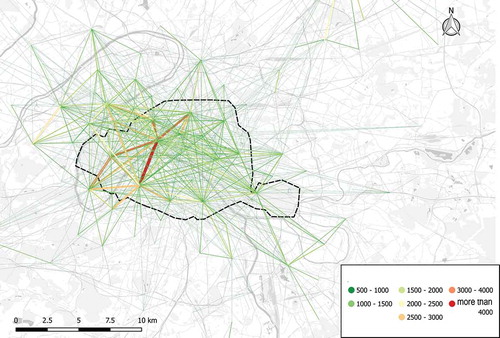
Figure 15. On the x-axis, cumulated number of routes; on the y-axis flow volume of the route (number of commuters). The flows within the graph of commuting in Paris follow an inverse power law.
Source: Urban morphology and Complex Systems Institute.
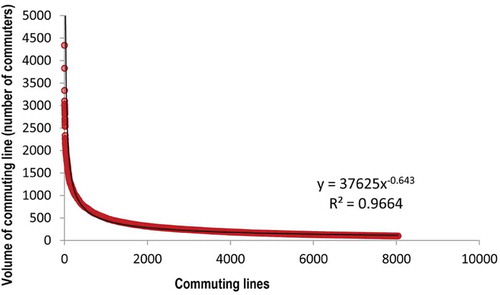
What this analysis of commuting flows tells us is that cities connect people to people in a highly hierarchical manner with a power law that is the signature of an organized complex system.
5.3. Inverse power laws in accessibilities
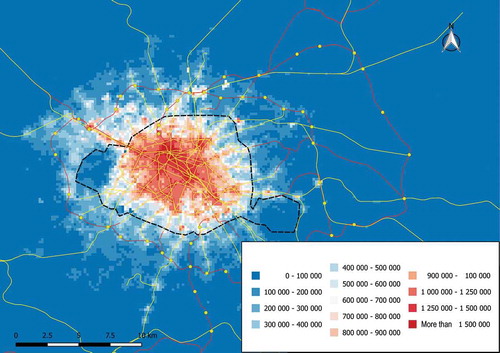
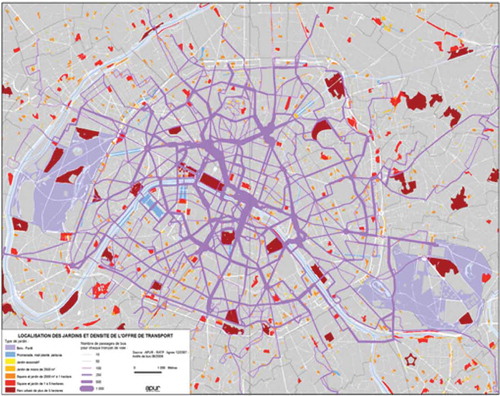
The scale hierarchy in the structure of urban networks translates into the structure of accessibilities to jobs and people across urban space. All places in a city are not equal in terms of accessibility. We give below the example of accessibility to jobs in Paris and we have equally mapped the accessibility to people in Paris, and to office and commercial space in New York. We have demonstrated that this hierarchical order of accessibilities is strongly correlated to the development potential in terms of human density (i.e. the sum of densities of people and jobs) of the different urban places (Salat & Bourdic Citation2015).
The number of accessible jobs () from a given location in Paris varies from more than 1.5 million in 1% of the urban area (in red) to less than 100,000 in 91% of the urban area (in blue) with a peak over 2 million around quartier de l’Opéra. The distribution of number of accessible jobs follows an inverse power law of hierarchy exponent close to −1.3. The hierarchy of jobs accessibility is steeper than the hierarchy of job densities distribution, which has a hierarchy exponent of −1.
Figure 16. Number of accessible jobs in Paris in less than 30-min door to door by transit from any location on a grid 200 m side.
Source: Urban Morphology and Complex Systems Institute.
These multiple inverse power laws with the universality revealed by their exponents emphasize a notion of spatial order with relevance for future research and planning that design cities as the never-ending evolving product of collective action.
6. Inverse power laws in the distribution of densities across urban space
This section examines the internal order of cities, and the hierarchy of locations that define them. The perspective here is about space and about order in space. The hierarchy of locations that we will see in this section reflects the hierarchy of networks that we have seen in the previous section.
6.1. Inverse power laws in residential and job densities distributions
The functioning of cities in space and time is based on multiple processes of spatial choice in which individuals and groups in the population locate with respect to one another and their wider activities in the form of land use types. These activities tend to be dominated by trade-offs between agglomeration economies and diseconomies, which are often represented in terms of relative accessibilities between different locations. These trade-offs give rise to patterns of activity that reflect different levels of clustering, and in turn these imply different density levels associated with different locations. This section shows that these patterns manifest self-similarity or spatial invariance across different scales, which imply that similar sort of processes are operating across scales (Batty Citation2013) (, , and ).
Figure 17. Greater London residential density map.
Source: Urban Morphology and Complex Systems Institute.
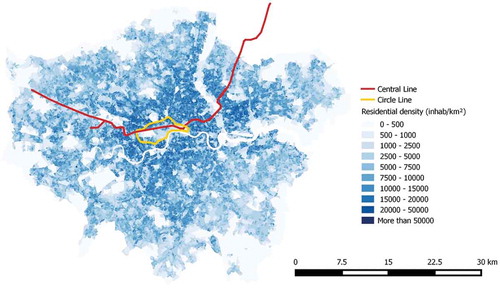
Figure 18. Greater London presents a distribution of residential densities that follow an inverse power law of exponent −0.48. One-third of people (2.72 million) are concentrated in the densest 145 kmFootnote2 at a quite high density of 18,760 people/km2 in the densest areas of the city. The spatial hierarchy is less steep than in Paris and New York where the population is more concentrated at high densities with an exponent of 0.7.
Source: Urban Morphology and Complex Systems Institute.
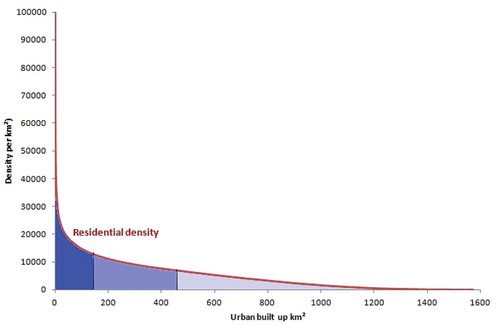
Figure 19. Greater London jobs density map.
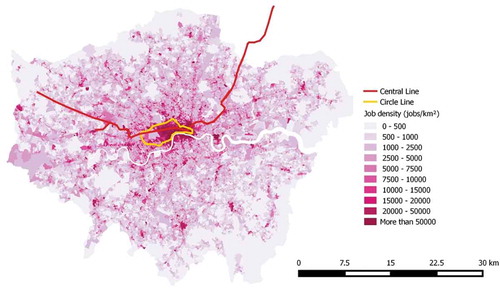
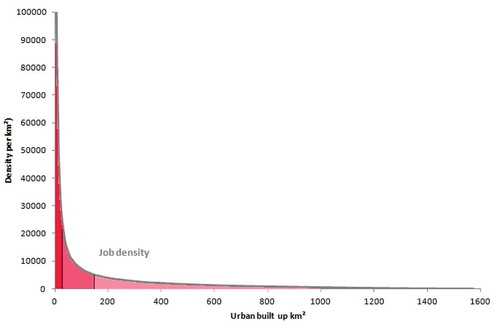
Figure 20. Greater London job density is more concentrated in London core. Central London on 1% of Greater London area (16 km2) concentrates one-third of Greater London jobs (1.5 million jobs). The distribution of jobs follows an inverse power law of exponent – 1 similar to New York, where one-third of jobs is also concentrated at high densities in 1% of the land area. In both cities, job densities peak at 150.000 jobs/km2.
Source: Urban Morphology and Complex Systems Institute.
The universality of power laws in jobs densities across urban space with an exponent of −1 in New York, London, and Paris brings a deeper understanding on a key spatial economics concept about cities, agglomeration, as Marshall (Citation1890) defined it more than 100 years ago. Agglomeration is less about the size of cities than about jobs and economic density peaking in spatially limited areas. The dense clusters of jobs in New York and London are agglomerated in a few square kilometres representing only 1% of the land area. They are the growth engines of these two cities. As individuals and firms come together in these dense clusters, the close proximity increases the number of potential interactions. The combination of high density of jobs in Manhattan Midtown and accessibility to 3.3 million jobs and 1.6 million people in less than a 30-min transit trip increases returns of density and accessibility.
6.2. Inverse power laws in economic densities
Urban economic theory is important in understanding the way competition orders space, and the work of Fujita et al. (Citation1999) must be noted at regional and international scales. The results presented below extend this ordering of the space economy at intra-urban scale with a fine resolution and demonstrate through the patterns they reveal that locational competition shapes cities at all scales through evolutionary processes.
In The Economy of Cities, Jane Jacobs states her conviction that ‘a city grows by a process of gradual diversification and differentiation of its economy’ (Jacobs Citation1970, p. 129). Her descriptions sound like evolution over multiple generations of reproduction, specialisation, speciation, and adaptation. In The Nature of Economies, she explicitly drew attention to the comparability of economies and ecosystems (Jacobs Citation1999, p. 8) and learning about economics from nature.
These were deep intuitions that can be verified by the fact that economic concentration across urban space follows the same type of inverse power law patterns that we have observed so far for populations and jobs, with surprisingly universal patterns. GDP distributions () across urban space in a socially planned economy like Zhengzhou in China, and in the most market-driven, most competitive world global city, London, follow also the same power law of exponent −0.9.
Figure 21. Distribution of GDP in London (at borough level granularity), here ranked from the most productive km2 to the less productive, follows an inverse power law of exponent −0.9 similar to Zhengzhou in China.
Source: Urban Morphology and Complex Systems Institute.
6.3. Inverse power laws in energy productivity across urban space
Power laws organize as well the distribution of energy density and of energy productivity across urban space. Maps of energy density (operational energy of the built environment per unit of urban land) in New York, Boston, and London have revealed that this demand varies 100-fold in New York when measured at fiscal lot level (i.e. with a fine resolution level of 200 m2). Behind these extraordinary variations, energy density follows inverse power laws (Salat Citation2016) that reflect patterns of economic density. Economic concentration translates into spikes of high energy density.
As shown in the following maps, London’s energy and economic landscapes reflect each other.
Urban GDP density and urban density are concentrated in peaks in the cores of global cities while peripheries are less energy intensive but produce much less added value ( and ). Does this pattern increase or does it decrease the productivity of energy? We can approach this question by analyzing the ratio of added value to energy inputs, which measures the different energy productivities across the urban space. Not surprisingly, spatial patterns of energy density follow patterns of residential and jobs densities with different patterns depending on the type of energy. Gas consumption pattern in London follows a similar hierarchy as that of residential density, while industrial and commercial energy consumption density follows a pattern of steep spatial concentration similar to that of GDP (, , and ).
Figure 22. London energy landscape is characterized by a high spike of energy density (here electricity per unit of land) of more than 300 MW/km2 in the City of London.
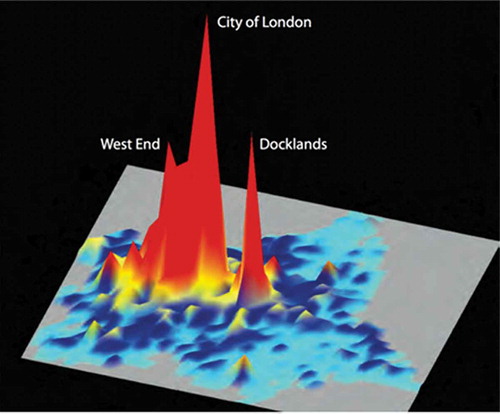
Figure 23. Distribution of workplace densities in London, using Census Output Areas, with a peak of 150,000 jobs/km2 in the Square Mile of the City of London.
Source: Urban Morphology and Complex Systems Institute.
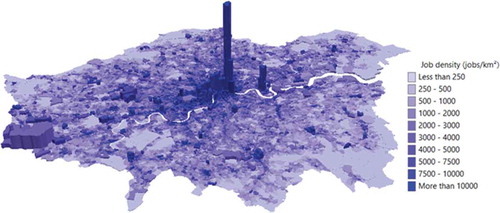
Figure 24. London gas consumption is distributed according to an inverse power law similar to the smooth distribution of population with a hierarchy coefficient of −0.52 to be compared to −0.48 for population density. Source: Urban Morphology and Complex Systems Institute.
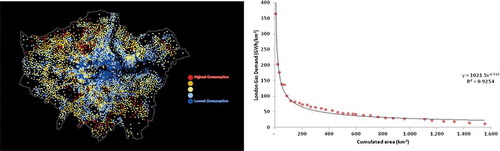
Figure 25. Commercial and industrial energy hierarchy (each km2 of London land is ranked from the highest energy demand/km2 to the lowest, the area under the curve is the total energy demand of London) through London space (hierarchy coefficient of 0.89) in London is similar to GDP hierarchy pattern (hierarchy coefficient of 0.9).
Source: Urban Morphology and Complex Systems Institute.
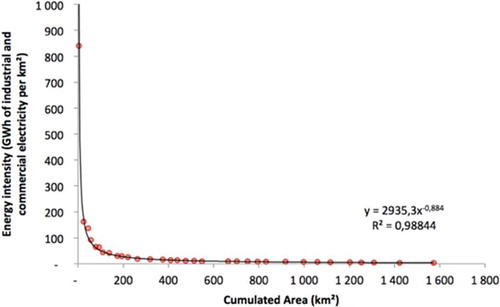
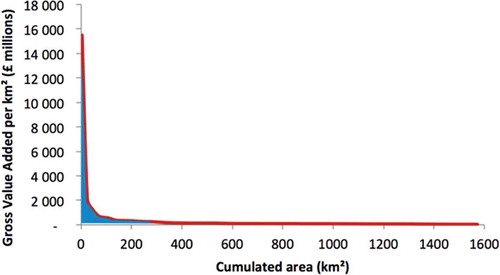
Figure 26. Energy productivity (GVA/energy) in London follows an inverse power law distribution with a few highly efficient boroughs and a long tail of less and less efficient boroughs. Each unit of energy is ranked on the x-axis from the most economically productive to the less economically productive. The area under the curve is the total London GVA.
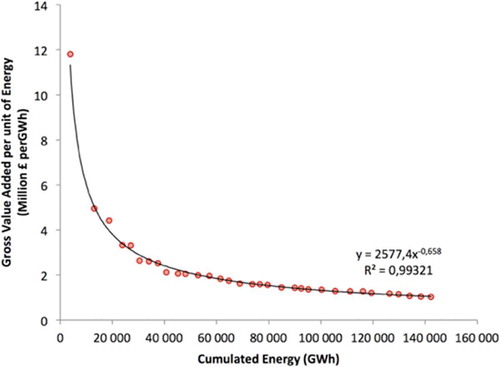
Energy productivity, that is the gross value added (GVA) per unit of energy spent, is unequally distributed across London urban space. Forty-one per cent of GVA is generated on 4.5% of the land area (72 km2) with 19% of the energy. As a comparison, in Tokyo 23 wards (600 km2), 18% of the energy is used in 25 km2 (4.1% of the land area), showing similar patterns of concentration of energy density.
7. Power laws and universality classes: the ‘signature’ of resilient systems in transition from disorder to order
Analysis of scaling hierarchies in urban network centralities and in urban flows, in accessibilities (number of people, jobs, office space), and in densities (people, jobs, energy, energy productivity) reveals the universality of these power laws in urban connectivity, spatial economics, and in energy economic productivity. Complexity science allows representing cities, as they are in the real world, with their heterogeneity, their different historical trajectories, their different societies and economies, their different strategies and policies, the many ways their subsystems are coupled together, while capturing all this diversity into surprisingly simple laws: these inverse power laws are the signature of scale-free properties in complex systems that have followed a long evolutionary process.
In statistical mechanics, a universality class is a collection of mathematical models, which share a single-scale invariant limit. While cities, such as Paris, London, and New York, may differ dramatically at small scales, their behaviour will become increasingly similar as the limit scale is approached. In particular, asymptotic phenomena such as critical exponents will be the same for all cities in the class. Studies of cities as percolation systems with phase transition points may explain these universality classes in urban systems. Power laws do not emerge in systems completely dominated by randomness. Physicists have learned that most often they signal a transition from disorder to order. Power laws speak of order and emerging behaviour. Power laws are at the heart of some of the most stunning conceptual advances in the second half of the twentieth century, emerging in fields like chaos, fractals, and phase transitions. Spotting them in urban economies, in urban networks, flows and spaces, signals unsuspected links between cities and other natural or artificial phenomena such as the Web, the brain, and the cell.
We have found these universality classes to be ubiquitous in urban space and networks. Maps of centralities in subway networks have provided insights into how networks shape densities, economic productivity, and agglomeration forces in cities. Maps of land lots have shed light on the mechanisms of efficient land markets (Salat Citation2015). Maps of energy density per unit of urban land in cities like New York or London have revealed the hidden mathematical order behind the heterogeneity of energy demand across urban space. But the real surprise has come from placing these maps side-by-side and from comparing different cities across continents, civilizations, and time spans of one millennium. We have learned that these diverse maps follow a common blueprint. A string of recent discoveries, about natural and urban networks, has forced us to acknowledge that amazingly simple and far-reaching natural laws govern the structure and evolution of the complex networks that cities are.
Universality classes in urban properties reveal that systemic architectures of efficient and resilient complex systems have long-term limits that are attractors stronger than the historical, social, or economic specificities of each city. Universality clases are the equivalent of an attractor in dynamic systems. They can be reached through many trajectories. That does not mean that, once established, the inverse power law pattern is an inflexible, rigid organization. What still keeps on changing constantly within the pattern is, for example, the ranking of different intra-city locations under intense competition between urban locations. This discovery of universality classes allows seeing top-down processes and bottom-up processes in cities as less contradictory than complementary and brings a beginning of answer to the question raised by Michael Batty that we have recalled at the beginning of this article. This has deep implications for planning. Resilient cities are dynamic systems constantly in transition from disorder to order, meaning that they constantly reconfigure their patterns as they are far from the equilibrium, but they do not reconfigure them randomly but within patterns of order in space that act as attractors.
8. Implications for planning
The discovery of the universality of power laws in resilient cities has deep implications for a resilient and efficient interplay of planning and emerging properties that achieves constantly a high level of configurational organization and a high capability of evolution and adaptation. This implies building the whole incrementally from a subtle balance between planning and emergence. One example of such planning is the Manhattan grid.
8.1. Building the whole incrementally from a subtle balance between planning and emergence: the Manhattan grid
Le Corbusier did not like New York, which he defined as la ‘ville pèle mêle’ (Le Corbusier Citation1924) (the higgledy-piggledy city) by opposition to his ‘ordered’ Radiant City. Meantime, complex systems theory has shown us that the apparently messy, creative, and emerging New York was shaped by a complex form of order with a deeper adaptive potential than the reductionist mechanistic order of Le Corbusier. Complex adaptive systems are not frozen in time. They generate an endless variety and diversity from simple rules, in the way New York Commissioners’ Plan generated from a grid the endless variety of Manhattan and New York (Salat Citation2015). The Commissioner’s plan of 1811, 1 year before Napoleon invaded Russia, planned for a sevenfold increase of the city, which was achieved in 1900, while ensuring a striking variety in forms and purpose and adapting to technologies and built forms that could never have been even imagined in 1811, such as the automobile, electricity, elevators, skyscrapers, etc. By absorbing change and constantly transforming through differentiation and integration, New York has evolved towards wholeness and organized complexity.
In New York, the simple act of drawing lines on a map by the Commissioners in 1811 created one of the highest capability of generative differentiation in recent history of planning. But what was so special in these lines on the map? And what have been the economic and legal conditions that made this plan so resilient? From this seemingly uniform grid of lines, drawn on the rugged and inhospitable rocky hills and marshlands of Manhattan, how such diversity, such capacity for the city to reinvent itself, decades after decades, did emerge? Scale hierarchy is one of the answers.
New York’s Commissioners’ plan is a hierarchical system of nested scales. Quite the opposite to Le Corbusier’s Radiant City, New York Commissioners’ plan is made of a spatial hierarchy of nested subsystems: first the Island of Manhattan itself is reconfigured by the grid in a series of urban blocks, divided in turn in land lots. This is clearly a scaling pattern with the elements becoming more frequent when they become smaller. The plan had the unexpected effect to make another hierarchical level emerge bottom up with the multiplicity of spatially defined neighbourhoods with a strong cultural identity through processes described in Salat (Citation2015).
From the Manhattan grid, we can derive a few implications for planning resilient cities:
Connectivity matters: a grid of densely connected streets connects Manhattan with 18 km of streets/km2 and 80 intersections/km2
Fine granularity in land markets (land lots of 200 m2) enables high levels of diversification and market demand responsiveness
Subway lines structure patterns of accessibility and economic concentration
Intense economic agglomeration fosters competitiveness
Jobs and residential densities are aligned with levels of transit accessibility
Flexible zoning for very high densities with fine granularity creates value
The implications of building the whole incrementally from a very fine grain texture with different scales (land lot/urban block/community/district) appear in a striking way when we compare the number of basic units for urban development between small blocks subdivided in lots, like in Manhattan plan, and Chinese current developments superblocks ( and ). The number of initial land lots in Manhattan is about 300,000, while the number of 500 m side superblocks in the same 66 km2 area in a typical Chinese new development is only 250. That huge difference in the number of the ‘building bricks’ of the city explains why a diverse and resilient city cannot emerge from a superblock pattern while it emerges from traditional small lots and small blocks when the planning instruments are flexible and market-responsive enough.
Figure 27. (Left) New York energy density map (built environment energy density per unit of land in kW h/m2 at fiscal lot level) around Madison Square. Building energy density per unit of land is a good proxy of the intensity of development of Manhattan lots. Even in a highly developed district such as Madison Square, the map reveals a high variety of development at lot scale.
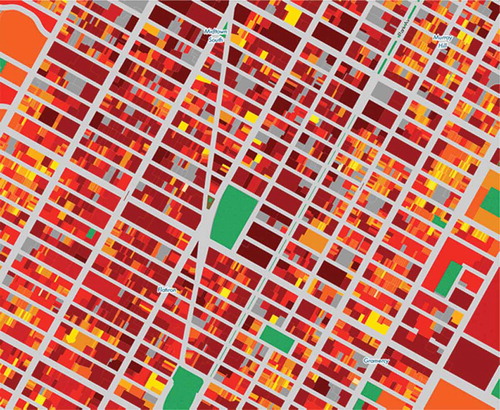
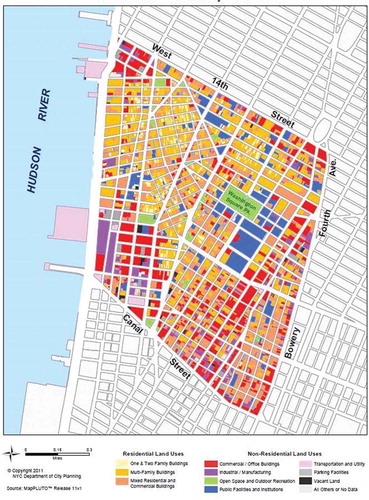
Figure 28. (Right) Diversity of land uses in New York happens at small block level and in many cases at lot level as well. The orange buildings of the map in Figure 28 are mixed residential and commercial buildings.
Inverse power laws in the distribution of sizes of land lots with the same exponents are another striking universality ( and ). An inverse power law with an exponent of −0.5 characterizes land lot patterns in Medieval Paris, nineteenth-century Paris, Hong Kong, and Lower Manhattan (i.e. the area of Manhattan with organic street patterns corresponding to the seventeenth-century New Amsterdam) (Salat et al. Citation2014). When the fragmentation of land is constrained by an overarching geometry of rectangular urban blocks such as in Manhattan’s Commissioners’ Plan or in Brooklyn, the distribution of sizes follows a steeper inverse power law. An evolving resilient city is made of many small blocks and small lots of diverse sizes that allow for a diversity of uses at micro-scale. It is also made of a multiplicity of interconnections at different scales and through scales. This was the traditional way of connecting cities and it was mirroring the most resilient connective patterns in nature: those of leaves.
Figure 29. (Left) Lot sizes around Madison Square have diversified over time. There is a combination of a few large lots up to a quarter or half block, some medium scale lots, and 40% of the lots have retained their original size. This distribution of sizes is not random. It follows an inverse power law distribution of exponent −0.6.
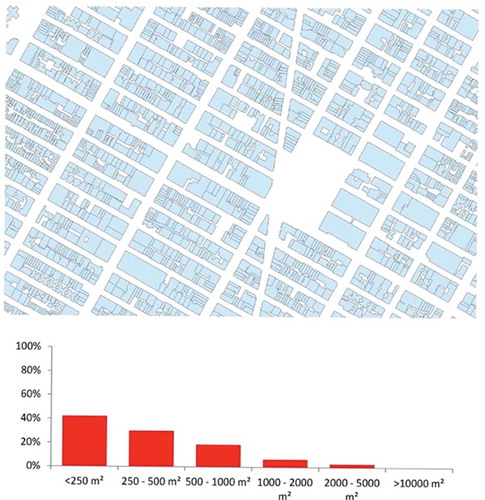
Figure 30. (Right) Lot sizes in Brooklyn. This distribution of sizes follows also an inverse power law distribution of exponent −0.6. This area of New York has retained 80% of its original lots and presents much smaller lots; in this century, development in Brooklyn most accessible areas from the high concentrations of jobs in Midtown and Lower Manhattan may experience a diversification of lot sizes analogous to the one in Madison Square in the last century.
8.2. Reconnecting the city through scales with leaf patterns
One of the most resilient network structures is that of leaves. To understand the topology of vein architecture, Katifori and Magnasco (Katifori et al. Citation2010) built a simple network model trying to capture its essential features. They modelled the veins, called xylem, as a network of pipes with varying flow and pressure. Given limited amounts of pipe, they asked, how should the pipe be distributed to minimize drops in water pressure and to make the system as resilient as possible to damage? Hierarchically nested loops architectures – meaning loops within loops – are most resistant to damage. Loops make the network redundant. If you have damage, water can be rerouted to other channels. Loop networks can also better handle fluctuations in fluid flow as environmental conditions change as demonstrated by Francis Corson of Rockefeller University in New York (Corson Citation2010).
Like leaves, street patterns of European cities embed a scaling hierarchy ( and ). We find an inverse power law when we plot on the x-axis the street width and on the y-axis the cumulated length of a given street type (i.e. the relative frequency of a given type) (,, and ). This inverse power law is the underlying mathematical order distributing for the entire city of Paris and for each district the frequency of 30- and 20-m wide boulevards ‘cut’ in the urban fabric by Baron Haussmann in the late nineteenth century, 12-m wide streets, 10-m wide, and the narrow 8-m wide, opened for many of them at the turn between the twelfth and the thirteenth centuries when King Philip Augustus built his wall. The scale invariance in the street patterns embeds the successive morphological layers of the city’s growth (Salat et al. Citation2011). At each period of growth creating a larger city, such as during the construction of the wall of Philip Augustus, which defined above all an area to urbanize as stated in the King’s orders, or such as Haussmann late nineteenth-century urban expansion, which integrated a rural periphery made of many villages to the city, in a new wave of urbanization expanding the city, fewer, wider, and longer range connections were created, adding a higher connectivity scale to the existing scales, some of them being medieval streets, other streets opened in the eighteenth century, others streets created at the end of nineteenth century. Though this evolutionary process, local and global scales have been linked by a successive series of connections that show structure and organization at each scale. In such a structure, a complex order is created from the bottom-up evolution of the small scale and its integration at higher scales. This mathematical structure of urban networks is the same as that of leaves, of neuronal networks or the Internet. They are all scale-free.
Figure 31. (Left) Alternate routes. The veins in a lemon leaf contain loops that allow coloured die to reach distant parts of the leaf beyond a circular hole.

Figure 32. (Right) A ginkgo leaf has no loops to bypass the hole. Loops arose to handle such damage and the fluctuations in nutrient needs.
Source: E. Katifori, Rockefeller University.
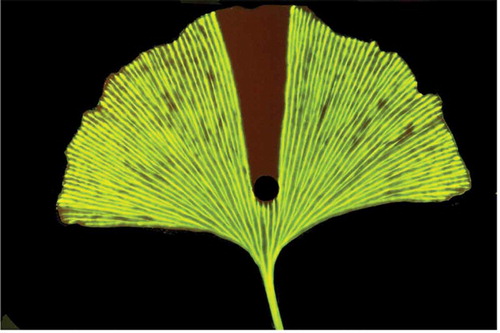
Figure 33. (Left) Map of Sebastian Münster (1572). In blue, the walls of Philip Augustus (The Right Bank was fortified from 1190 to 1209 and the Left Bank from 1200 to 1215), dubbed on the Right Bank by the wall of Charles V. The map shows the street pattern of Paris at the end of sixteenth century. This street pattern is still today the underlying network of high–frequency, short-range connections.
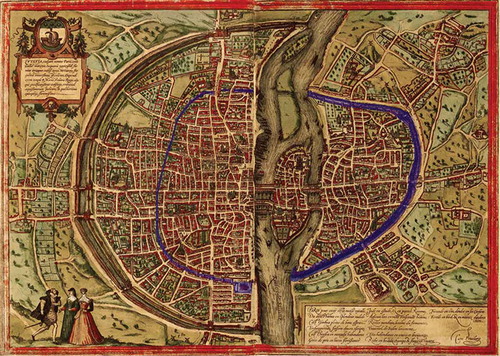
Figure 34. (Right) Turgot Map of Paris between 1744 and 1739 showing Paris in the era of Enlightenment before the wide-scale reorganization of nineteenth century.
Figure 35. (Left) Haussmann ‘cuts’ through Paris urban fabric at the end of nineteenth century create a larger-scale connectivity with the new territory annexed to the city. As a result of this over-layering of morphological periods, street patterns in Paris follow scaling laws and are connected across scales. The frequency (measured by the length) of streets of a given width follows an inverse power law (Salat et al. Citation2011). This is the ‘signature’ of a complex ‘grown system’ in spite of Haussmann’s interventions at the end of nineteenth century.Footnote6
Figure 36. (Right) Urban networks and flows are also connected across scales and distributed according to inverse power laws. Bus frequencies in Paris. Source: Urban Morphology and Complex Systems Institute, and APUR (Atelier Parisien d'Urbanisme).
9. Conclusion: what should planners do and must not do?
Cities are dense webs of connections where everything is linked to everything else. These dense webs have a strict architecture captured by a few simple mathematical regularities. Networks open a novel perspective on the interconnected urban world around us. Counteracting the vulnerability of contemporary cities requires a paradigm reversal, and a shift from a mono-scale conception to a scale-free conception of cities. Only multi-connected scale-free structures, similar to natural leaves, can secure optimal efficiency and resilience of variable flow networks, while limiting the propagation of local perturbations. A scale-free distribution of connections, where one can find a complex web of connections of different intensities at any degree of resolution, creates a high connectivity at all scales. The local levels of the city are as densely connected by short-range connections as the intermediary and global levels. There is a scaling hierarchy of connections.
Power laws do not imply a vision of cities as static systems in equilibrium. Quite the opposite, the hierarchical order between individual elements may deeply changeFootnote7 but power laws remain as attractors in a constantly evolving urban world. Although far from the equilibrium, and constantly submitted to forces of growth or decline, the elements of the city do not evolve randomly but readjust continually, restoring hierarchical patterns of organization, thus showing structural resilience.
Increasing interactions in systems made of a multiplicity of small-scale elements organized in sub-assemblies (such as New York urban lots in the Commissioners’ plan of 1811 organized in small elongated blocks) generates the phenomenon of emergence, which largely contributes to the system’s regulation and resilience. Emergence is the opposite of the utopian simplified orders that architects such as Le Corbusier have tried to impose on cities (Salingaros Citation2014). Huge quantities of energy are needed in such artificial repetitive orders to maintain urban systems in a stable state. Modernist cities, with abstract giant forms imposed from the outside, obstruct the emergence of small-scale connections, whereas the continuous creation of connections in historical cities favoured their evolution. The continuous fabric of traditional buildings with courtyards, because of its connective forces developing inwards, has a stabilizing impact on the urban system. Giant modernist buildings standing in loneliness isolation do not connect into the urban fabric. They have a destabilizing impact and fail to create an evolving adaptive structure. Modernist architects turned their back to the universal laws of urban evolution by working with large-scale elements only and making the urban land a blank slate devoid of the incremental successive layers of historical traces. The Utopian machinist juxtaposition of vast homogeneous zones, made of a repetition of very big objects, hinders the appearance of emerging properties that were not integrated or even forecasted or predictable into the initial framework of the system (Salat et al. Citation2014).
Planners should create the framework for future evolution. They should not constrain this evolution.
Planners should understand that the future cannot be controlled and that attempts to control it leads to dead cities, to ghost towns. Living cities are like chessboards where an endless number of different games can be played. It is the role and responsibility of the planner to design the chessboard, not to play the game. Life should play the game. (Salat et al. Citation2014)
Disclosure statement
No potential conflict of interest was reported by the author.
Additional information
Notes on contributors
Serge Salat
Serge Salat: is an architect, urban planner, scientist and historian. He is President of the Urban Morphology and Complex Systems Institute, Paris. He has worked on network analysis and complexity science in urban studies, spatial planning and spatial economics. He advises United Nations and international organizations on urban policies transitions.
Notes
1. Walker & Salt (Citation2006) underline the fact that ‘the more you optimize elements of a complex system of humans and nature for some specific goal, the more you diminish that system’s resilience. A drive for an efficient optimal state outcome has the effect of making the total system more vulnerable to shocks and disturbances.’
2. This has been analysed for ecological systems in Holling (Citation1992), Levin (Citation1992, Citation1999), Peterson et al. (Citation1998), and Chave & Levin (Citation2003).
3. These regularities in ecological systems take also the form of scaling laws (Peters Citation1980; Brown & West Citation2000; Chave & Levin Citation2003; Ernest et al. Citation2003; Brown et al. Citation2004; Kerkhoff & Enquist Citation2006).
4. It is in D’Arcy Thomson’s On Growth and Form (first edition, Thompson Citation1917) that the principle was given its first application. Size-required shape changes are the object of an in-depth study in biology to elucidate the morphological adaptation of living organisms’ metabolisms and networks with size (Gould Citation1966).
5. They show ‘the characteristic features of biological systems (ordered structures), reflective of structures acquired during long periods of evolution’ (Prigogine et al. Citation1972).
6. As stated by Barthelemy et al. (Citation2013), ‘Paris, during the 19th century experienced large modifications supervised by a central authority, the “Haussmann period”. An empirical analysis of more than 200 years (1789–2010) of the evolution of the street network of Paris shows nevertheless a smooth behaviour and that the most important quantitative signatures of central planning is the spatial reorganization of centrality and the modification of the block shape distribution. Such effects can only be obtained by structural modifications at a large-scale level, with the creation of new roads not constrained by the existing geometry. The evolution of a city thus seems to result from the superimposition of continuous, local growth processes and punctual changes operating at large spatial scales’.
7. For example, betweenness centrality of subway stations in Paris between 2015 and 2030 after construction of the new lines of Grand Paris Express will be strongly modified (Salat & Bourdic Citation2015). But even if the order of the elements changes, the global hierarchical pattern, in this case the form and exponent of a power law of exponent −1, remains unchanged.
References
- Barabasi A-L. 2014. Linked: how everything is connected to everything else and what it means for business, science, and everyday life. Cambridge, MA: Basic Books.
- Barthelemy M, Bordin P, Henri Berestycki H, Gribaudi M. 2013. Self-organization versus top-down planning in the evolution of a city. Nature, Scientific Reports. 3:2153.
- Batty M. 2013. The New Science of Cities. MIT Press.
- Batty M, Marshall S 2016. Thinking organic, acting civic: the paradox of planning for cities in evolution. Landscape urban plan. (2016), http://dx.doi.org/10.1016/j.landurbplan.2016.06.002
- Benguigui L, Daoud M. 1991. Is the suburban railway system a fractal?. Geogr Anal. 23, 362–368.
- Bertalanffy LV. 1969. General systems theory. Foundations, development, applications. New York: George Braziller.
- Bertaud A. 2003. Clearing the air in Atlanta: transit and smart growth or conventional economics?.
- Brown JH, Gillooly JF, Allen AP, Savage VM, West GB. 2004. Toward a metabolic theory of ecology. Ecology. 85:1771–1789.
- Brown JH, West GB. 2000. Scaling in biology. New York: Oxford University Press.
- Carpenter S, Walker B, Anderies JM, Abel N. 2001. From metaphor to measurement: resilience of what to what?. Ecosystems. 4:765–781.
- Castells M. 1989. The informational city: information technology, economic restructuring, and the urban regional process. New York: Wiley-Blackwell.
- Chave J, Levin S. 2003. Scale and scaling in ecological and economic systems. Environ Resource Econ. 26:527–557.
- Corbusier L. 1924. Urbanisme, Paris, édition originale: G. Crès, coll. L’Esprit Nouveau. 1924:284.
- Corbusier L. 1933, (1964). The radiant city. London: Faber and Faber.
- Corson F. 2010. Fluctuations and redundancy in optimal transport networks. Phys Rev Lett. 104:048703. [published 2010 Jan 29].
- Ernest SKM, Enquist BJ, Brown JH, Charnov EL, Gillooly JF, Savage VM, White EP, Smith FA, Hadly EA, Haskell JP, et al. 2003. Thermodynamic and metabolic effects on the scaling of production and population energy use. Ecol Lett. 6:990–995.
- Floater G, Rode P, Zenghelis D. 2013. Stockholm, green economy leader report. London: LSE Cities.
- Floater G, Rode P, Zenghelis D, Ulterino M, Smith D, Baker K, Heeckt C. 2014. Copenhagen: green economy leader report. London: LSE Cities.
- Fujita M, Krugman P, Venables AJ. 1999. The spatial economy: cities, regions, and international trade. Cambridge (MA): MIT Press.
- Gould SJ. 1966. Allometry and size in ontogeny and phylogeny. Biol Rev. 41:587–638.
- Holling CS. 1992. Cross-scale morphology, geometry, and dynamics of ecosystems. Ecol Monogr. 62:447–502.
- Jacobs J. 1970. The economy of cities. New York: Vintage Books.
- Jacobs J. 1999. The nature of economies. New York: Random House.
- Jarcy XD. 2015. Le Corbusier, un fascisme français. Albin Michel.
- Katifori E, Szöllősi GJ, Magnasco MO. 2010. Damage and fluctuations induce loops in optimal transport networks. Phys Rev Lett. 104:048704. [published 2010 Jan 29].
- Kerkhoff AJ, Enquist BJ. 2006. Ecosystem allometry: the scaling of nutrient stocks and primary productivity across plant communities. Ecol Lett. 9:419–427.
- Kerkhoff AJ, Enquist BJ. 2007. The implications of scaling approaches for understanding resilience and reorganization in ecosystems. BioScience. 57:489–499.
- Krob D. 2014. Éléments de systémique. Architecture des systèmes. In: Berthoz A, Petit J-L, editors.. Complexité, Simplexité. Collège de France.
- Levin SA. 1992. The problem of pattern and scale in ecology: the Robert H. MacArthur Award Lecture. Ecology. 73:1943–1967.
- Levin SA. 1999. Fragile dominion: complexity and the commons. Reading (MA): Perseus Books.
- Marshall A. 1890. Principles of economics. London: Macmillan.
- MIT, Tsinghua University, and Energy Foundation. 2011. Designing clean energy cities. New approaches to urban design and energy performance.
- Mumford L. 1961. The city in history, harcourt. San Diego (CA): Brace and World.
- Perelman M. 2015. Le Corbusier, Une froide vision du monde. Paris: Michalon.
- Peters RH. 1980. Useful concepts for predictive ecology. Synthese. 43:257–269.
- Peterson G, Allen CR, Holling CS. 1998. Ecological resilience, biodiversity, and scale. Ecosystems. 1:6–18.
- Prigogine I. 1977. Time, structure and fluctuations. Nobel Lecture. Available at: http://www.nobelprize.org/nobel_prizes/chemistry/laureates/1977/prigogine-lecture.pdf
- Prigogine I, Nicolis G, Babloyantz A. 1972. Thermodynamics of evolution”. (part I). Phys Today. 25:23–28. (part II). Phys Today 25: 38–44, December.
- Pumain D. 2006. Alternative explanations of hierarchical differentiation in urban systems. In: Pumain D, editor. Hierarchy in natural and social sciences. (Vol. 3). Springer Netherlands; p.169–222. 2006, Methodos series. <halshs-00145933>.
- Rosenthal S, Strange W. 2004. Evidence on the nature and sources of agglomeration economies. In: Henderson V, Thisse J, editors.. Handbook of regional and urban economics (Vol. 4). Amsterdam: North-Holland; p. 2119–2171.
- Roth C, Kang SM, Batty M, Barthelemy M. 2012. A long-time limit for world subway networks. J Royal Soc Interface. doi:10.1098/rsif.2012.0259
- Salat S. 2015. Paris/New York 1215-1811-2015. Eight centuries of hierarchies of scale in urban land lots. Territorio Italia, Year XV, n.1, June 2015, 7-19.
- Salat S 2016. “The break-even point. Impact of urban densities on value creation, infrastructure costs and embodied energy”. SBE 16 Turin Conference Proceedings.
- Salat S, Bourdic L. 2011. Power laws for energy efficient and resilient cities. Procedia Eng. 21: 1193–1198.
- Salat S, Bourdic L. 2015. L’Économie spatiale du grand Paris. Connectivité et création de valeur. Paris: Urban Morphology Institute and Complex Systems Institute and Caisse des Dépôts.
- Salat S, Bourdic L, Kamiya M. 2017. Economic foundation for sustainable urbanization: a study on three-pronged approach: planned city extension, legal framework, and municipal finance. Urban Morphology Institute, Paris /Urban Economy Branch, UN-HABITAT, Nairobi, Kenya.
- Salat S, Bourdic L, Labbe F. 2014. Breaking symmetries and emerging scaling urban structures. A morphological tale of 3 cities: Paris, New York and Barcelona. ArchNet IJAR. 8 (2): 77–93 – Regular Section.
- Salat S, Labbé F, Nowacki C. 2011. Cities and forms: on sustainable urbanism. Paris: Hermann.
- Salat S, Ollivier G. 2017. Transforming Urban Space with Transit-Oriented Development: The 3V Approach. World Bank, Washington, DC: License: Creative Commons Attribution CC BY 3.0 IGO.
- Salingaros N. 2014. Principles of urban structure. Kathmandu: Vajra Books.
- Simon H. 1977. Models of Discovery and Other Topics in the Methods of Science, p 258.
- Simon HA. 1962. The architecture of complexity. Proc Am Phil Soc. 106. December.
- Thompson DW. 1917. On growth and form. Cambridge: University Press, 467–482.
- Walker B, Salt D. 2006. Resilience thinking: sustaining ecosystems and people in a changing world. Washington: Island Press.
- Weaver W. 1948. Science and complexity. Am Sci. 36:536–544.
- World Bank & Chreod Ltd. (2015). Spatial Transformation of Shanghai to 2050, Final Report prepared for the World Bank, December 2015
- Yang J 2010. “Does Energy Follow Urban Form? An Examination of Neighbourhoods and Transport Energy Use in Jinan, China”. Master in City Planning & MSc in Transportation. Massachusetts Institute of Technology.
- Zipf GK. 1949. Human behaviour and the principle of least-effort. Cambridge (MA): Addison-Wesley.