
ABSTRACT
Establishing green roofs has been used as a method to mitigate urban environmental quality problems. In this study, the effect of Tehran Nature Bridge green roof as a sustainable structure on its surrounding microclimate is investigated using urban microclimate model, ENVI-met, on a hot summer day in July 2015. For this purpose, two simulation scenarios were generated to assess the impact of extensive and intensive green roofs on some climate variables. A comparison was made between the scenarios at two different heights, 1.5 and 40.5 m and two times including 10 am and 4 pm. Based on the predicted results, the second scenario showed a 10.47% increase in relative humidity (RH) compared to the first scenario on bridge level at 10 am. In the second scenario, air temperature dropped by 0.8°C at 10 am compared with the first scenario, which is equivalent to 2.87%. The presence of intensive green roof caused a decrease in wind velocity on bridge level by 1.75 m/s and changed its direction. Furthermore, green roof also influenced velocity and direction of the wind, RH, and air temperature in different ways at ground level. Overall, green roof altered climatic parameters such as air temperature, RH, and wind velocity and direction at both bridge and ground level.
1. Introduction
Despite providing a better way of living for citizens in the twenty-first century, the urban life has faced many problems. One of the most important outcomes of industrial life is a disconnection between humans and nature, which has led to numerous physical and mental disorders (UNDESA Citation2012).
Before human development began disturbing natural habitats, soil and vegetation constituted a part of a balanced ecosystem that managed precipitation and solar energy effectively. As forests, agricultural fields, and suburban and urban lands are replaced with impervious surfaces resulting from development, the necessity to recover green space is becoming increasingly critical to maintain environmental quality (Getter and Rowe Citation2006).
As the human population began expanding, more construction ensued and disturbed these natural habitats. Cities, towns, and suburbs all add more impervious surfaces as we construct buildings, roads, and parking lots. Today, two-thirds of all impervious area is in the form of parking lots, driveways, roads, and highways (Water Resources Group Citation1998), and this loss of natural areas causes many problems. Vegetated or green roofs are among the potential remedies for this problem. The initial concept of green roof rooted to Babylon’s hanging gardens; whoever, ever since they can be seen almost everywhere in different types including intensive and extensive green roof (Weiler and Scholz-Barth Citation2009). Berardi (Citation2016) focused on the benefits of the local microclimate and the building energy saving resulting from green roof retrofits.
In his study, a virtual model validated using multi-year data of a local network of different weather stations was employed to simulate the effects of the green roof retrofit over the outdoor microclimate. Results indicate that increasing the leaf area index would lead to an increased cooling effect of the air temperature up to 0.4°C during the day at pedestrian level, while a more significant temperature reduction would be obtained only at the rooftop level. Green roofs also represent a possible way to cope with Urban Heat Island (UHI), even if their design is not straightforward and requires taking into account many variables, strictly related to the local climatic conditions (Costanzo et al. Citation2016), the physical characteristics of buildings including height, number of stories, roof design, and materials influence the performance of green roofs (Berardi et al. Citation2014). In the intensive green roofs, the aesthetics aspects of the selected plants should be considered as one of the reasons for installing such green roofs. In comparison, in the extensive roofs, the main purpose is to cover bare roof surfaces with low-maintenance plants. Therefore, in plant selection, the priority is planting effect on microclimate and durability in harsh conditions. The intensive green roofs involve high maintenance costs compared to the extensive roofs. Li and Yeung (Citation2014) discovered that extensive green roofs are more popular compared to the intensive green roofs in Europe and North America. The reason for this finding might be a lower cost of installing and maintaining the green roofs.
In recent decades, Europe, especially Germany, has been experiencing the fast development of green roofs. North America and southeastern Asia have also been moving forward in this field. Green roofs benefit the ecosystem in numerous ways such as increasing sound insulation (Dunnett and Kingsbury Citation2004), increasing membrane longevity (Porsche and Köhler Citation2003), making the roof fire resistant (Köhler Citation2003), reducing the amount of energy needed for maintaining interior climates (Del Barrio Citation1998), runoff management, aesthetics, accommodating urban wildlife, improving air quality, and reducing urban heat islands (Getter and Rowe Citation2006). Ries and Kosareo (Citation2007) reported that green roofs are the most environmentally beneficial types of roofs since they add to the longevity of roofs and decrease energy waste. Van Bohemen et al. (Citation2008) found that installing green walls and roofs on structures benefits the city in numerous ways; that is, lowering the cost of heating and cooling, mitigating UHI, and entrapping PM. Silva et al. (Citation2015) conducted a field survey that describes building and roof systems of 11 case studies in Portugal in terms of anomalies, causes, and maintenance actions. They concluded that monitoring actions are important to assure the suitability of the maintenance plan.
In megacities like Tehran, which has been experiencing population growth in the recent decades, drastic changes have been made to respond to the demand of citizens. These changes have resulted in the transition of linear greenery to buildings and roads. Introducing green roof technology seems necessary to overcome the obstacles that lack of greenery has caused in Tehran.
Recently, the scientific community of Iran has realized the devastating impacts of climate change and pollutants on the urban ecosystem and proposed different ecological solutions to tackle the threats of ultra-urbanization. The best way to reach a modern and clean city is to build green structures and the most evident element of green buildings is a green roof. To provide proof for the benefits of a green roof in urban ecosystems, the scientific community is obliged to use methods like simulating the effects of green roofs and urban design on microclimate (Vatanparast et al. Citation2014). The purpose of the present study is to analyze the impacts of intensive and extensive green roofs built on Nature Bridge in Tehran as sustainable structures on its surrounding microclimate on relative humidity, air temperature, and wind speed.
2. Materials and methods
2.1. Study area
The current study was conducted in the Nature Bridge, which is the largest pedestrian bridge in Tehran, Iran (35° 45ʹ 15.4“ N, 51° 25ʹ 13.3“ E) with the height of 40 m and length of 270 m (). The curved body of the bridge in different heights gives visitors countless views and perspectives. The bridge connects two public parks: Taleghani Park and Abo-Atash Park that pass across Modarres Expressway, one of the main highways in northern Tehran.
Figure 1. Geographical position of the study area.
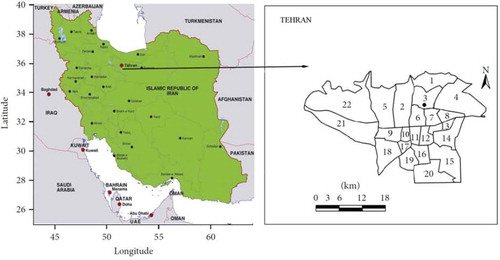
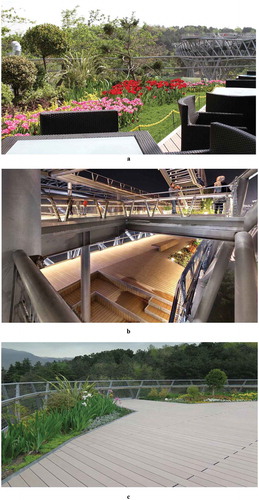
This iconic pedestrian bridge is designed in three levels: The first level has a café gallery, a coffee shop, and restaurants; the second level is mainly designed for people who are crossing from one park to the other through walking, biking, skating, or riding on a horse carriage; and finally, the third level, or the stay zone, is a place to stay and sightsee. In the middle of the bridge, there are stairs and ramps designed to get from one level to another ().
Figure 2. Tehran’s Nature Bridge; (a) An overview of the bridge, (b) Levels and details of the bridge, and (c) Green roofs on the bridge levels in different parts.
The main objective of the present work is to reach a sustainable design and construction compatible with the environment, a harmonious with the environment, and with less ecologically damaging effects.
2.2. Plant irrigation
Although Tehran is located in a semi-dry region and encounter with water shortage problems, a rainwater harvesting (RWH) installation is constructed on a hill in the Taleghani Park that collects precipitation during the year. The elevation difference between the RWH installation (water reservoir) and the Nature Bridge is 20 m. This height difference helps water pumping from reservoir to green roof area without electrical power. There is a gravity drip irrigation system installed in the green roof for plants irrigation. In addition, there are several moisture sensors in medium to irrigate green roof plants only when it is needed. Such a system optimizes irrigation efficiency and leads to the reduced water use.
2.3. Scenarios and measurements
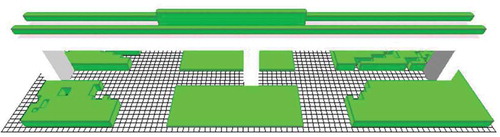
To assess the effects of green roofs in the study area, two scenarios were generated. In the first scenario (control), the green roof was excluded from the study area map (i.e. Nature Bridge), while in the second one, both intensive and extensive green roof existing on Nature Bridge were included. The Bridge was gridded as 30 × 90 × 40 m with each grid being 3 m2 (). In order to assess the impact of the intensive green roof in comparison to the extensive green roof, the authors used a universal form of the plant for each kind so the plant type will not be a defining factor in simulating the impact.
Figure 3. 3D design of the study area in second scenario.
As the green roofs show its highest effect on microclimate on hot days, the measurements and simulations were carried out on 28 July 2015 according to the information obtained from Tehran’s Geophysics Weather Station.
Relative humidity, air temperature, soil temperature, and wind speed and direction were measured in the study area to be used as input for simulation model (). All the measurements were conducted on ground level at two times: 6 am and 4 pm. Relative humidity were measured using Lutron EM-9000 environment meter as 22% and 14%, respectively, representing highest and lowest relative humidity in a 2-m height. Simple forcing is applied in simulation process to make sure the air temperature will not exceed the limits of that particular day; therefore, the air temperature was measured at 6 am and 4 pm using Lutron EM-9000 environment meter and recorded 26.7°C and 37.9°C, respectively. Wind usually blows from south west in the study area and recorded 2.9 m/s using Lutron EM-9000 environment meter. Soil temperature and humidity were considered as default (i.e. 19.85°C and 50%), respectively, throughout all simulations.
Table 1. The main climate variables for the chosen summer day.
The model also considers the green roof is always in a well-hydrated situation so there is no need to implement soil temperature and humidity of green roof in the simulation. Traffic under the bridge is usually light, but the model does not recognize cars as heat emission sources. Thus, they can be used in a different study, which considers cars as pollutant emission sources.
2.4. ENVI-met model
ENVI-met is a three-dimensional microclimate model designed to simulate the surface–plant–air interactions in an urban environment with a typical resolution down to 0.5 m in space and 1–5 s in time (www.model.envi-met.com, Citation2014). The model was used to simulate some climatic variables including relative humidity, air temperature, and wind speed in the study area. The calculation procedure of ENVI-met model is listed below (www.model.envi-met.com, Citation2014):
Calculating high- and low-frequency flow of sunlight, considering shading and light reflection and refraction from building surface and plant coverage
Calculating evaporation, precipitation, and apparent heat exchange of plant coverage with a simulation of all physical parameters of the plant (for instance photosynthesis)
Calculating wall and roof temperature of structures in any given site
Calculating the exchange flow of water and heat in the soil system
Calculating parameters of biometeorology such as mean radiation temperature and Predicted Mean Vote
Calculating inert gases and dust particle’s distribution, regarding their deposition on the vegetation and roof surface
Leonardo is an add-on installed on ENVI-met Headquarter software that is used to extract the results from ENVI-met.
Yang et al. (Citation2013) verified the validity of ENVI-met results on a hot summer day in their research. In a similar manner, they verified the ENVI-met model using the measurement of the same date that simulation was conducted. In this work, they measured temperature on four different occasions and compared it with the simulated temperature. Finally, the figures from measurements, weather station, and simulations were depicted in temperature chart.
3. Results
3.1. Relative humidity
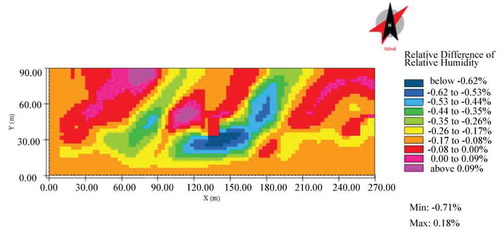
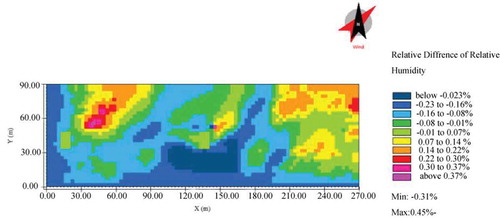
Results showed that there was a mixture of increase and decrease in relative humidity on the ground level in the second scenario compared to the first one (). Most places show a decrease in relative humidity as much as 0.71% in the second scenario, which is mainly due to drop in air temperature and alteration of wind speed and direction. The results also show that places showing no difference or increase in relative humidity as much as 0.18% either have a high amount of trees or are not located in the direct flow of wind. Consequently, those places are not affected by the alteration of wind speed in the second scenario.
Figure 4. Difference in relative humidity (%) between two scenarios at 10 am in 1.5 m.
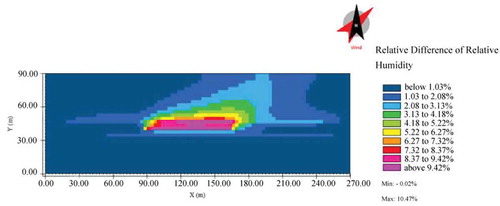
In contrast with the ground level, there is a high increase in relative humidity above the bridge due to evapotranspiration of plants in the second scenario. The highest percentage of this increase can be seen in the intensive green roof that adds up to 10.47%. This value for the extensive green roof was about 2.08%. As shown in , the southwest wind carries the humidity to the north of the bridge and raises the relative humidity up to 3.13% in the second scenario compared to the first scenario.
Figure 5. Difference in relative humidity (%) between two scenarios at 10 am in 40.5 m.
Results indicated that at 4 pm there was still decrease in relative humidity in most places on ground level as much as 0.23%, but slightly less than what observed at 10 am. The higher rate of evapotranspiration at 4 pm has lessened the effect of alteration in wind speed and direction. The increase in relative humidity in the second scenario at this hour is higher compared to that at 10 am as it reaches 0.45% ().
Figure 6. Difference in relative humidity (%) between two scenarios at 4 pm in 1.5 m.
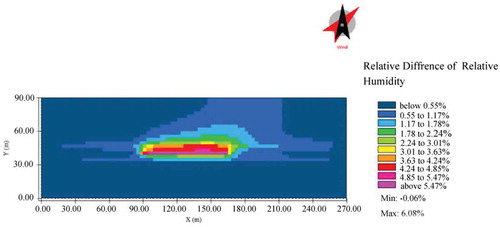
Above the bridge relative, humidity rises as high as 6.08% in the second scenario, which is caused by vegetation in intensive part of the green roof. The impact of extensive green roof vegetation on relative humidity is 1.17% at its highest ().
Figure 7. Difference in relative humidity (%) between two scenarios at 4 pm in 40.5 m.
3.2. Air temperature
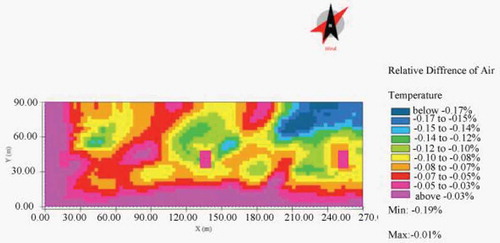
The highest drop in ground level temperature in the second scenario at 10 am is recorded at 0.18%, which is equivalent to 0.06°C. This temperature decrease occurred in the west of the middle pole of the bridge where the intensive green roof has been installed ().
Figure 8. Difference in air temperature (%) between two scenarios at 10 am in 1.5 m.
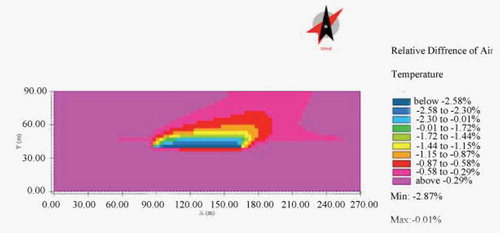
The comparison map of bridge level between two scenarios showed a 2.87% (0.8°C) drop in air temperature at 10 am in the second scenario above the intensive green roof. The intensive green roof affected air temperature 60 m north of the bridge and caused a 0.58% decrease that amounts to 0.18°C. Since the air temperature decrease caused by the extensive green roof is too low compared to the intensive green roof, it cannot be seen using this legend ().
Figure 9. Difference in air temperature (%) between two scenarios at 10 am in 40.5 m.
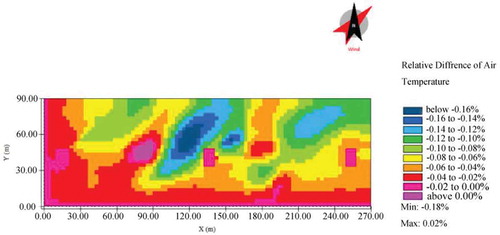
The difference in air temperature (%) between two scenarios at 4 pm on ground level () showed a drop in air temperature as much as 0.19% (0.07°C). This drop occurred in the north of the eastern park and was great because of the effect of the wind that carried cooler air in the second scenario.
Figure 10. Difference in air temperature (%) between two scenarios at 4 pm in 1.5 m.
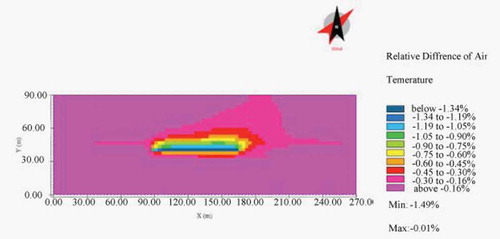
In , a comparison between two scenarios shows that temperature drop is as much as 1.49% (0.52°C) on bridge level around the intensive green roof; thus, the effect of the extensive green roof on air temperature is dismissible.
Figure 11. Difference in air temperature (%) between two scenarios at 4 pm in 40.5 m.
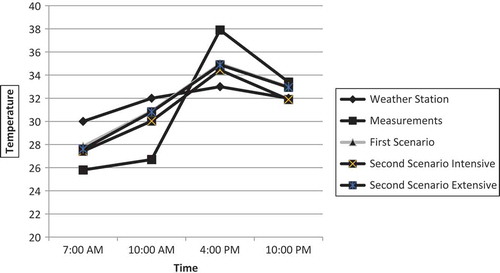
In , the simulated (First Scenario, Second Scenario Intensive Vegetation, and Second Scenario Extensive Vegetation), the real weather (Nearest weather station-Tehran Synoptic Station of Geophysics), and temperature measurements are compared.
Figure 12. The simulated (First Scenario, Second Scenario Intensive Vegetation, Second Scenario Extensive Vegetation), the real weather (Nearest weather station-Tehran Synoptic Station of Geophysics), and measurement temperatures.
3.3. Wind velocity
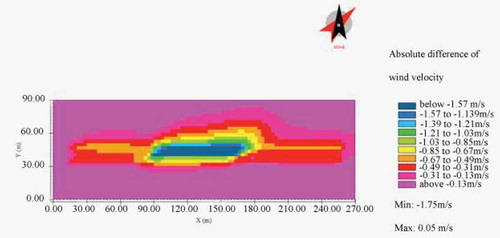
Wind velocity was considered as a constant input throughout all simulations in both scenarios, the intensive green roof affected wind flow in the second scenario and shows a decrease in wind velocity by 1.75 m/s on bridge level where the intensive green roof has been placed.
Figure 13. Difference in wind velocity (m/s) between two scenarios at 4 pm in 40.5 m.
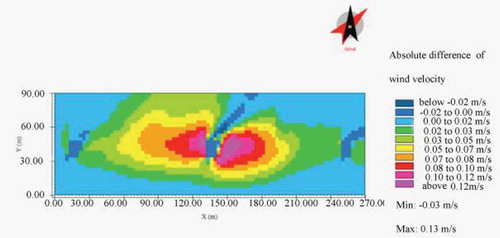
There is a mild increase in wind speed on ground level in the second scenario () that reaches 0.13 m/s at its highest. However, a gap has created north of the middle pole of the bridge, suggesting a slight decrease in wind speed that amounts to 0.03 m/s caused by a change in direction of wind flow.
Figure 14. Difference in wind velocity (m/s) between two scenarios at 4 pm in 1.5 m.
4. Discussion
The surface temperature reduction leads to reducing thermal emission from these urban surfaces and promote the urban thermal environment. Adding 10% of urban vegetation, the outdoor air temperature could be reduced by 0.5–0.8°C in the daytime (Wang et al. Citation2016).
Skelhorn et al. (Citation2014) in their simulation of green roofs in Manchester using ENVI-met discovered that trees on roofs helped air temperature decrease on the ground level by 1°C. Sodoudi et al. (Citation2014) in a similar study in Tehran using the same methods found that if 43% of buildings have a green roof, air temperature would be decreased by 1.13°C. Both studies support results of the current study on the decrease of air temperature due to the effect of a green roof on microclimate. As the green roof in this simulation did not cover the structure’s entire surface, the percentage of alteration is not as high as that of the mentioned studies. The air temperature decrease in the second scenario was lower compared to those of other two studies and was maximum 0.8°C on the bridge level. This result indicates that vegetation on high-rise structures is not always reflected on ground level.
Simulated results of the second scenario showed contradicting alterations in RH and air temperature on ground level due to geographical characteristics of different parts of the study area. These alterations might have been caused by the density of trees in the parks and change in speed and direction of wind because of the intensive green roof. It is necessary to push vegetation planting to the appropriate areas through relevant policy, as planting trees reduces the UHI effect during the day because the shading from trees reduces solar irradiance. Therefore, planting trees in areas that are used mostly during the daytime, such as business and factory districts, could provide a more significant UHI mitigation effect. Urban development policy for these areas should include guidelines about roadside tree planting and vegetation placement (Wang et al. Citation2016). Consequently, in the second scenario, the presence of green roof resulted in lower relative humidity in some parts of the study area on ground level in comparison to the first scenario highlights the importance of feasibility studies of green roof installation in different urban ecosystems.
5. Conclusion
In the presence of green roof, microclimate shows different alterations on both grounds and the bridge level. Based on the predicted results, air temperature drops substantially on the bridge when a green roof is considered in the simulation particularly around the intensive green roof. The impact of a green roof on air temperature can be seen on ground level in small quantities. Relative humidity is influenced by the change of wind velocity and air temperature. On the bridge level, there is a considerable increase in RH, especially around the intensive green roof. In addition, intensive green roof created a disturbance in wind flow and decreased its speed on the bridge. Consequently, the wind turned its way down under the bridge with a speed higher than that of the first scenario on ground level. This alteration in wind speed combined with the decrease in air temperature resulted in a lower RH on the ground level in the vicinity of the bridge. In comparison, the parts with a higher density of trees show an increase in RH as the result of more humid wind blown in the second scenario. presents a comparison of the variables applied in the designed scenarios.
Table 2. Summary of variables comparison among scenarios.
The results prove that the mitigation ability of green roofs is highly dependent on the structure built on and can vastly participate in decreasing temperature in urban systems if installed using the right blueprints. Thus, this paper recommends studying factors that influence green roofs impact on mitigating heat island, compensating the shortage of green spaces in the urban ecosystem, pollutant reduction, management of run-off water, and public health.
As parks and greenery surround the study area, the impact of a green roof on Nature Bridge seems very low and the whole idea appears unsubstantial. Accordingly, it is proven that the high installation and maintenance costs are not justified by just the aesthetics of this green roof. Hence, it is recommended conducting further studies on installing green roofs on urban structures. In order to reduce the high maintenance cost, it is also suggested planting more robust plants in warm and semi-dry cities such as Tehran. Again, it is emphasized that it is a big mistake using only aesthetically appealing plants that cannot withstand the heavy wind, strong sunlight, and the dryness on an urban bridge. Otherwise, the cost of maintaining such green roofs would be exceedingly high and the public would pay for an illusion of environmental friendly concept.
Disclosure statement
No potential conflict of interest was reported by the authors.
Additional information
Notes on contributors
Ramin Ebrahimnejad
Ramin Ebrahimnejad holds a B.Sc from University of Urmia and a M.Sc from Shahid Beheshti University. His research interests are Urban Agriculture, Organic Farming and Environmental Impact Assessment. His previous publications and researches includes green roof and green wall effects on environment, benefits of Urban Agriculture and customer behavior toward organic produce. He is currently looking for a PhD position.
Omid Noori
Omid Noori is an Assistant Professor in the Environmental Science research Institute at the Shahid Beheshti University, Tehran, Iran; where he has been a faculty member since 2006.Omid completed his PhD and M.Sc. at Tarbiat Modarres University and his undergraduate studies at Shahid Chamran University. His research interests lie in the area of Environmental & Urban Horticulture.Omid has published more than 15 papers in scientific journals, more than 7 papers has presented in international conferences and 25 papers in national conferences.
Reza Deihimfard
Reza Deihimfard is an Assistant Professor in the Environmental Sciences Research Institute at Shahid Beheshti University, Tehran, Iran; where he has been a faculty member since 2005.Reza completed his PhD at Ferdowsi University of Mashhad and his undergraduate studies at the University of Tehran. His research interests lie in the area of Crop Modelling and Systems Analysis. Over the last decade, he has published more than 16 articles in the international scientific journals (ISI) as well as around 10 papers in the international Conferences/Symposiums.
Related Research Data
References
- Berardi U. 2016. The outdoor microclimate benefits and energy saving resulting from green roofs retrofits. Energ Buildings. 121:217–229.
- Berardi U, GhaffarianHoseini AH, GhaffarianHoseini A. 2014. State-of-the-art analysis of the environmental benefits of green roofs. Appl Energ. 115:411–428.
- Costanzo V, Evola G, Marletta L. 2016. Energy savings in buildings or UHI mitigation? Comparison between green roofs and cool roofs. Energ Buildings. 114:247–255.
- Del Barrio EP. 1998. Analysis of the green roofs cooling potential in buildings. Energ Buildings. 27:179–193.
- Dunnett NP, Kingsbury N. 2004. Planting green roofs and living walls. Portland (OR): Timber Press.
- ENVI-met 4. 2014. A holistic microclimate modelling system. https://www.model.envi-met.com
- Getter KL, Rowe DB. 2006. The role of green roofs in sustainable development. HortScience. 41:1276–1286.
- Köhler M. 2003. Plant survival research and biodiversity: lessons from Europe. Paper presented at the First Annual Greening Rooftops for Sustainable Communities Conference, Awards and Trade Show; May 20–30; Chicago.
- Li WC, Yeung KKA. 2014. A comprehensive study of green roof performance from environmental perspective. Int J Sustainable Built. 3(1):127–134.
- Porsche U, Köhler M. 2003. Life cycle costs of green roofs: a comparison of Germany, USA, and Brazil. Proceedings of the World Climate and Energy Event; Dec 1–5; Rio de Janeiro, Brazil.
- Ries R, Kosareo L. 2007. Comparative environmental life cycle assessment of green roofs. Build Environ. 42:2606–2613.
- Silva CM, Flores-Colen I, Ana Coelho A. 2015. Green roofs in Mediterranean areas – survey and maintenance planning. Build Environ. 94:131–143.
- Skelhorn C, Lindley S, Levermore G. 2014. The impact of vegetation types on air and surface temperatures in a temperate city: a fine scale assessment in Manchester, UK. Landscape Urban Plan. 121:129–140.
- Sodoudi S, Shahmohamadi P, Vollack K, Cubasch U, Che-Ani AI. 2014. Mitigating the urban heat island effect in Megacity Tehran. Adv Meteorol. 2014:1–19. Article ID 547974..
- [UNDESA] United Nations Department of Economic and Social Affairs, 2012. Shanghai manual: a guideline for sustainable development of the 21st century, United Nations. https://sustainabledevelopment.un.org.
- Van Bohemen HD, Fraaij ALA, Ottelé M. 2008. Ecological engineering, green roofs and the greening of vertical walls of buildings in urban areas. In: Ecocity World Summit Proceedings. April 21–26; San Francisco, California, USA.
- Vatanparast M, Saremi H, Shokohi H. 2014. Ecological role of green roofs in sustainable urban development. Indian J Sci Res. 4(3):354–365.
- Wang Y, Berardi U, Akbari H. 2016. Comparing the effects of urban heat island mitigation strategies for Toronto, Canada. Energ Buildings. 114:2–19.
- Water Resources Group. 1998. Water laws: understanding the problems facing urban watersheds. 2005 Oct 20. http://www.waterlaws.com/guest/guest1.html/.
- Weiler SK, Scholz-Barth K. 2009. Green roof systems. Hoboken (NJ): Wiley.
- Yang X, Zhao L, Bruse M, Meng Q. 2013. Evaluation of a microclimate model for predicting the thermal behavior of different ground surfaces. Build Environ. 60:93–104.