
 ?Mathematical formulae have been encoded as MathML and are displayed in this HTML version using MathJax in order to improve their display. Uncheck the box to turn MathJax off. This feature requires Javascript. Click on a formula to zoom.
ABSTRACT
Essential ecosystem services provided by watersheds consider quantity and quality of water supply. In the current study, we used the Avoided Cost valuation method to assess the impacts of changes in land use of Guarapiranga Reservoir watershed (Metropolitan Region of São Paulo, Southeast Brazil) on the quality of raw water and on costs of treating the public water supply. Vegetation cover area significantly correlates with the average dosage of reagents for raw water treatment. Reduction of vegetation area increased 7.1 times the cost of water treatment, generating a significant externality for users of the system that reached around US$ 6.6 million in 2010. Even whether underestimated, management of the Metropolitan reservoirs should consider this value, enabling to reinforce water conservation as a state policy and effectively implemented with the participation of society. This study highlights the potential governing processes and management strategies related to the sustainable management of the watershed.
1. Introduction
Ecosystem services have been defined in various ways, depending on the ecological or the economic approaches (Braat and De Groot Citation2012). In this paper, we assumed ecosystem services as the properties and the processes of ecosystems that contribute to human welfare and support life on Earth. Hence, an ecosystem function generates a particular service when underlying natural processes trigger a series of benefits directly or indirectly appropriated by humans, creating the notion of anthropocentric usefulness (Costanza et al. Citation1997). An ecosystem service presents the possibility/potential to promote human well-being, integrating the social, economic, cultural, and health dimensions (Braat and De Groot Citation2012). Essential ecosystem services for human survival include the provision of water. Nowadays, over one billion people around the world do not have direct and free access to clean water. Tundisi (Citation2008) predicted that this number would reach more than half of the human population in the next 50 years.
Assessing the economic value is a major theme in environmental and ecological economics, mainly because distortions derived from non-incorporation of environmental benefits in economic decisions may cause environmental degradation. Knowing the ecosystems structure and its dynamics and relationships with other dimensions (e.g. social and cultural) in producing ecosystem services is another significant challenge (Müller and Burkhard Citation2012; Hackbart et al. Citation2017), including variation through scales and context (Gómez-Baggethun and Barton Citation2013). Moreover, ecosystem services and disservices may be compared to proper accounts, especially because only benefits are considered in many cases (Lyytimäki and Sipillä Citation2009). Solutions to environmental problems may involve correction of such distortions, incentives for conservation and reduction of natural resource degradation (Borger Citation1998; Braat and De Groot Citation2012). Although some ecosystem services are not economically recognized, their economic values exist given their use alters the level of production and consumption of society overall (Motta Citation1998). Ecosystem services and disservices often have small or even null weight in political decision-making processes because they are not entirely framed in commercial markets and adequately quantified in equal terms with manufactured capital (Lyytmäki and Sipilä Citation2009; Braat and De Groot Citation2012). This negligence may affect the sustainability of human life, considering that the global economy would collapse without ecosystem services, which turns their total value virtually infinite (Costanza et al. Citation1997).
One of the main challenges in this century for all countries is to provide water in adequate quantity and quality for human consumption and economic production. Nevertheless, the link between changes in water quality and multiple ecosystem services have not been well established, which is needed especially to evaluate the return on investments in conservation practices (Keeler et al. 2012). Tundisi (Citation2008) reported a global overview of progressive intensification of scarcity and degradation of water quality. This situation prevents water multiple uses, especially in the context of the major urban areas such as the Metropolitan Region of São Paulo (MRSP), Brazil. The possibility of a new crisis on qualitative and quantitative scarcity is further aggravated by global environmental changes that may alter the hydrological and biogeochemical cycles and may potentially intensify pollution, eutrophication, toxicity and disease spreading (Tundisi Citation2008; Hartmann et al. Citation2013). Land cover and use are important drivers of water quality, and their variation in space and time can convert ecosystem services in disservices, with consequences mainly for public health (Tong and Chen Citation2002; Saad et al. Citation2015; Sousa and Semensatto Citation2015; Mokondoko et al. Citation2016). Usually, when the land cover and use change, water quality changes accordingly (Tong and Chen Citation2002; Saad et al. Citation2015; Mokondoko et al. Citation2016).
The costs of environmental degradation not paid or compensated by those who generate them are the negative externalities, which in turn can potentially affect third parties without proper compensation (Motta Citation1998). Some of these externalities can become ecosystem disservices (Lyytmäki and Sipilä Citation2009). Thus, environmental valuation can assist to understand the usage scenarios and conditions of natural resources better. It allows inferring the effects of human activities on current and future projections of availability and quality of a given resource associated with impacts of political decisions on environmental conservation priorities (Braat and De Groot Citation2012). Water security depends on water availability, quality and governance (Tundisi et al. Citation2015).
The central concern for the conservation status of the Guarapiranga Reservoir is to maintain its services and multiple uses to provide water quality for public supply considering current and future generations in the MRSP. Consequently, conservation of watershed as a whole should be effectively treated as a state policy, demanding to understand how the evolution of the land cover and use generates impacts on ecosystem services. One example of the strategic importance of Guarapiranga in the urban context is the recent demand for guidance for the public supply run by the Basic Sanitation Company of the State of São Paulo (Sabesp) to ease pressure on the Cantareira System in a critical water availability situation during 2013–2015. Thus, as widely reported in the Brazilian press, the Guarapiranga Reservoir began to serve a greater number of people and had a high flow rate of 14.5 m3/s, thereby becoming the largest production system in the MRSP in 2015.
The Guarapiranga Reservoir has a history of progressive water quality degradation (Fontana et al. Citation2014; ; López-Doval et al. Citation2017; Semensatto and Asami Citation2017) and changes in land use and occupation in the last decades (Andrade et al. Citation2015). Therefore, our objective was to highlight some of the tangible economic values of the water supply ecosystem service of the Guarapiranga Reservoir by focusing on the association of land use (loss of vegetation coverage) to water quality.
After conducting an extensive search in several bases of academic, scientific, and technical publications, we noted that the vast majority of the work that had the reservoir as an object of study underscored its degradation, its misuse, and its likely future shortage, among other issues such as epidemiological approach (Arruda-Neto et al. Citation2009), a study on environmental multiproxies in waters and sediments (Cotrim et al. Citation2017) and identification of Escherichia coli in drinking water (Orsi et al. Citation2007). However, as far as could be seen, there is no valuation of the ecosystem services of this reservoir, which represents a significant gap regarding the urban water resource management.
2. Material and methods
2.1. Study area
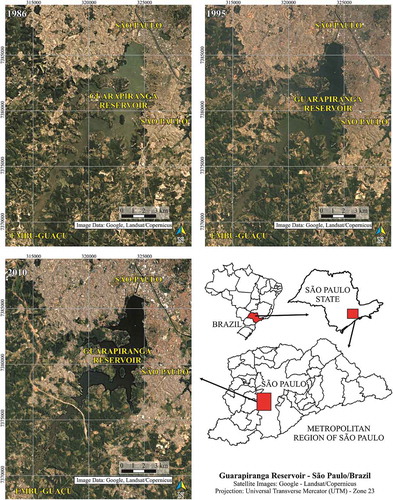
The watershed of the Guarapiranga Reservoir covers an area of 639 km2 in five cities of the MRSP: São Paulo, Cotia, Embu-Mirim, São Lourenço da Serra, and Juquitiba (). The watershed is entirely inserted at the São Paulo City Green Belt Biosphere Reserve (Man and Biosphere Programme – Unesco), and around 10% of the Municipal Environmental Protection Area of Capivari-Monos covers the southern watershed. The region is also the theme of two specific legal acts for protection and recovery of the water springs (State Act 12 233/2006 and State Decree 51 686/2007).
Figure 1. Guarapiranga Reservoir satellite images in 1986, 1995 and 2010. Urbanization took place mainly at the mid-west region of the reservoir.
Tarifa and Armani (Citation2001) have described two climatic units in the area. First, the wet tropical of the Paulistano Plateau (in the region of the reservoir), with average temperatures ranging from 19.3 to 19.6°C and average annual rainfall between 1 250 and 1 400 mm. Second, the super-moist tropical climate of the reverse of the Atlantic Plateau (closest to the top of the Serra do Mar, where are the springs of the rivers that flow to the reservoir), with average temperatures between 15.3 and 15.8°C and average annual rainfall ranging from 1 400 to 1 800 mm caused by the orographic effect. The area has a distinctive dry period from April to September and a rainy period from October to March.
According to the last update of the Development and Environmental Protection Plan of the Guarapiranga River Watershed (PDPA-Guarapiranga), the type of urban density is variable throughout the watershed, ranging from slums to luxury condominiums, many of them in an illegal situation (São Paulo Citation2011). In 2000, estimation pointed that 754 443 people lived in the watershed; this number increased to more than 900 000 in 2006. Around 60% of these new inhabitants settled in the territory of the city of São Paulo, mainly in residences lacking sanitary systems. In 2007, although public water supply served 95.7% of households within the watershed, only 59.1% were connected to the sewage system, with a little more than 38% using septic or rudimentary septic tanks. The density of inhabitants has a heterogeneous distribution. The PDPA-Guarapiranga points out that in 2000, the average population density was around 1 180 inhabitants/km2, but in the eastern and north-western portions of the reservoir, the population densities reached 10 040 and 9 420 inhabitants/km2, respectively. The average income of 56% of people who live in the watershed was lower than three official minimum Brazilian salaries, which is one of the socioeconomic criteria for poverty classification. In 2006, Cetesb recorded 15 soil contamination points, mainly represented by fuel stations and industries. In the last decades, the watershed has experienced some transformations resulting from the urbanization process, with adverse impacts on water quality. Deterioration progressed continuously without any prospect of returning to better quality standards (Fontana et al. Citation2014; ; Andrade et al. Citation2015; López-Doval et al. Citation2017; Semensatto and Asami Citation2017).
The lack of water is a historical problem in São Paulo, which has suffered severe crises throughout the 20th century. Because it is a megalopolis with a high rate of population growth in its peripheral regions, especially in the water source areas, new water sources are often required. The 1970s, for example, were a milestone for the Guarapiranga Reservoir, as the population around the watershed grew at an accelerated pace, and many of these new homes were, and still are, poor in infrastructure and without sanitation systems. Thus, in several regions of the watershed untreated household waste has been discarded for decades in the tributaries of the reservoir, despite the creation of some municipal and state government programmes for the recovery and conservation of the springs (Whately and Cunha Citation2006; SABESP Citation2008; Fontana et al. Citation2014).
2.2. Previous data
Pearson correlation analyses were performed with PAST software (Hammer et al. Citation2001) associating the land use mapping data for the watershed () obtained by Andrade et al. (Citation2015) with data of average reagent dosages used for the treatment of the raw water of the Guarapiranga Reservoir ().
Table 1. Different classes of land use and occupation (% of total area) of the Guarapiranga Reservoir Watershed in 1986, 1996, and 2010.
Table 2. Total water production (1 000 m3), total reagent consumption (kg), and average reagent concentration (kg/1 000 m3) at the water treatment station Rodolfo José da Costa e Silva Jr. in 1986, 1996, and 2010.
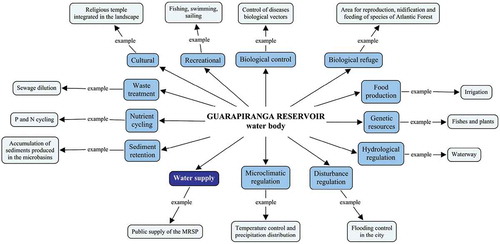
We sought to highlight the ecosystem services provided by the Guarapiranga Reservoir, based on the list proposed by Costanza et al. (Citation1997) and considering all the environmental characterization of the reservoir offered in PDPA-Guarapiranga (São Paulo Citation2011). This step served to subsidy the environmental value estimate of the set of identified ecosystem services and to envisage, indirectly, the potential underestimation of the environmental valuation change in use and occupation (), considering the supply service chosen for evaluation in this work.
Figure 2. Ecosystem services provided by the Guarapiranga Reservoir, focusing on the water supply for the MRSP.
2.3. Environmental valuation
We assessed 1986, 1996, and 2010 of the Guarapiranga Reservoir water supply service due to data available on the watershed land use and average reagent concentrations. Considering the enormous difficulty in obtaining Sabesp’s official information on the chemical products used for raw water treatment, we sought information that would serve as a proxy reference for estimating the value of the environmental impact caused by changes in watershed land use.
The economic values of environmental impacts can be conducted through different approaches, considering the nature of the impact. In this sense, there are several ways in which economic values can be placed on the environment, enabling environmental issues to be included in economic decision-making. The methods are based on the economic theory, which have been devised to assign monetary values to environmental goods and services, and these values can then be incorporated into decision-making at the sectorial and national levels.
The most appropriate method for the present study is the Avoided Cost (AC), which estimates the value of the environmental resource through the expenses incurred to mitigate the damages caused by environmental degradation (Equation 1). In this approach, the loss of the environmental attribute is worth at least the expenses incurred in its recovery.
Z: production
E: ecosystem service (e.g. good quality water supply)
S: substitute of E (e.g. consumption of reagents for treatment and maintenance of water quality).
Methods such as AC are necessary for cases where production variation (∆Z), although affected by the ecosystem service (E), does not offer observable market prices or is hard to measure. Typical cases would be those where Z is also an environmental good or service consumed free of charge, or where the production or dose-response functions are not available or even entail an extensive research effort.
Although the provision of E is free, the loss of its quality or scarcity (AC) may induce the use of other goods or services to substitute E. To keep Z constant, a unit more of S compensates a unit less of E. Then, the price of the perfect substitute (PS) observable in the market will value the variation of E. This substitution will cause users to incur a private cost (cS) in the consumption of the substitute good or service (cS = PS x AC).
In AC, cS represents the expenditures that would be incurred by users of surrogate goods or services not to change the product of Z, which depends on E (Motta Citation1998). In the present study, cS is the cost of raw water treatment (or purchase of treated water) that is necessary due to the degradation of water quality, caused by environmental impacts on water sources (replacement of vegetated areas by building areas over time).
To estimate the value of PS, we used as proxy data on chemical expenditure in 1996 and 2010 (1986 was not available), obtained in consultation with the National Sanitation Information System (SNIS), in addition to chemical reagent expense. In this case, considering the PS to get good-quality water for public supply, we also established the Attributable Portion of the System (APS) in the water supply to the MRSP ().
Table 3. Attributable portion of the supply systems (APS) of the MRSP, with the maximum flow authorized by the competent authorities under normal operating conditions. Source: Sabesp.
We calculated Ecosystem Service Value (ESV) as a component of the total economic value of environmental resources, considering the equation that expresses the Economic Value of Environmental Resources (EVER):
DUV: direct use value
IUV: indirect use value
OV: option value
VE: value of existence
As in the present study, due to data availability, we could not estimate IUV, OV and VE (values are equal to zero in the equation), the ESV estimate will be only the DUV component of EVER:
SP: price of the perfect substitute for ecosystem service (in this case, use of reagents)
APS: Attributable Portion of the System
Finally, to ensure the valuation is comparable over time and among different markets, we converted the amounts into US dollars, using the average price over time provided by the Central Bank of Brazil (Bacen).
3. Results and discussion
Andrade et al. (Citation2015) have pointed out that the reduction of vegetation cover occurred concurrently with the increase in building areas, i.e. one type of use substituted another over the studied period. They indicate this phenomenon when discussing three axes in the watershed that represent the areas where they observed vectors of more intense urbanization, maximised mainly by new highways and roads. Thus, increasing building areas increased population with concomitant reduction of vegetation cover.
The housing available for the underprivileged citizens in São Paulo is scarce and over-populated. The conditions of these new settlements (also called slums or favelas) of São Paulo have worsened over time and being occupied by people from very low socioeconomics classes. Favelas are one of the alternatives that the poor have to depend on when they have no other housing option. The location of favelas in São Paulo is mostly in the city’s unfavourable physical territory (such as slopes and river meadows) and precarious environmental situation. Due to the fact that these areas are without interest for the market and hard to build, they had remained vacant. Therefore, risky environmental areas are the places where favelas usually establish (Fix et al. Citation2003). An unexpected effect of the specific environmental legislation created by the State of São Paulo in the 1970s to preserve the reservoirs and watercourses (State Acts 898/1975 and 1172/1976) was the legal limits to construct the sanitary structures in favelas (Araújo Citation2017). Considering that these acts forbade some types of public intervention on the peripheral regions of the reservoir, the State could not improve the poor structure established by the invasions. The alternative of expelling these people was a controversial political solution never executed. Thus, a repeated cycle of irregular occupation followed by landscape degradation combined with the political and legal limitations of the state agents resulted in progressive loss of water quality in the last decades. One consequence, for example, is that the treating cost of the raw water from the Guarapiranga Reservoir increased 133% in only five years, between 1998 and 2003 (Viveiros Citation2004).
The sewage collection infrastructure does not serve most of these new settlements, and a significant part of the untreated domestic sewage is directly disposed of in the reservoir tributaries, which in its turn demanded an increase of the reagent concentrations for the treatment of raw water. Increasing population density in association with land-use changes influences the input of chemicals that interfere with water quality (Ahearn et al. Citation2005; López-Doval et al. Citation2017). Pollution by domestic sewage continued to grow at Guarapiranga Reservoir, without government investments for the construction of sewage treatment plants. With a rising population, which produces the domestic sewage, the levels of eutrophication have increased in the reservoir as a whole, reaching the hypereutrophic state in some places. Instead of controlling the use and occupation of the watershed and investing heavily in basic sanitation, as observed in New York (Chichilnisky and Heal Citation1998), the state company that manages the reservoir decided to limit the effects of pollution by applying copper sulphate pentahydrate and peroxide to control the blooms of algae and cyanobacteria. Even considering the increase in drinking water production over time, the progressive degradation of raw water quality has led to an increase in the mean number of reagents used to maintain the water quality standard distributed to the population ().
The ecosystem services that vegetation exert in the context of the hydrological balance (catchment of water for supply and maintenance of springs) and the control of disturbances (reduction of erosion, leaching risk and concentration of pollutant loads) in watersheds have been reported in the literature and coupled with the perspective of conservation (Anbumozhi et al. Citation2005; Farrik and Branfireun Citation2015; Sun et al. Citation2015). Riparian vegetation is highlighted in this context due to its direct spatial interaction with water resources, which provides ecosystem services with a significant role for water quality maintenance (Anbumozhi et al. Citation2005; Randhir and Ekness Citation2013) and protection of the environmental health of the tributaries of public supply systems (Honey-Rosés et al. Citation2013; Mokondoko et al. Citation2016).
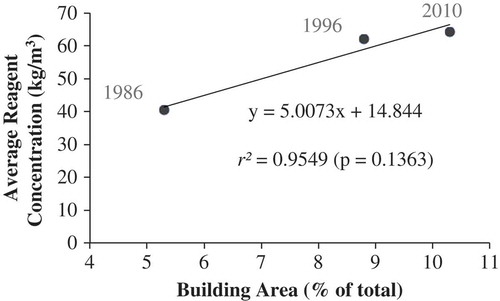
In fact, in the Guarapiranga Reservoir, the reduction of the percentage of vegetated areas is significantly correlated with the increase of the reagent concentration in the water treatment station (). It indicates that the deforestation hampered the quality of the water supply service, which makes the externality of replacing ecosystem services (average reagent concentration) increasing costs for society. In the opposite direction, the growth in the proportion of building areas in the watershed has an opposed relation with the mean number of reagents ().
Figure 3. Scatter plot between the vegetation area (forest + grassland) and the average reagent concentration for raw water treatment.
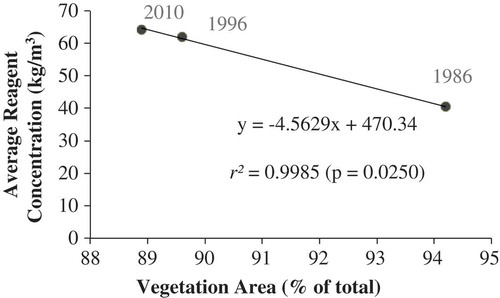
Figure 4. Scatter plot between built-up area and average reagent concentration of raw water treatment reagents.
Unplanned built-up areas, such as the many settlements in the Guarapiranga watershed, can create ecosystem disservices (Lyytimäki and Sipilä Citation2009; Gómez-Baggethun and Barton Citation2013; Tobias Citation2013). Hoyer and Chang (Citation2014) have observed that in the watersheds of northwestern Oregon (USA), water production is more sensitive to climatic constraints, while land use and occupation are the main drivers of mobility and nutrient retention. Ahearn et al. (Citation2005) have shown that land coverage drives the loading of some nutrients that are essential for primary productivity in aquatic ecosystems. These observations must be valid for the Guarapiranga Reservoir because its springs have a geomorphological context with significant influence of the interaction between the regional microclimate and the relief, but the territorial occupation changes guide the nutrient export to the water column (López-Doval et al. Citation2017). The progressive eutrophication of the Guarapiranga Reservoir is a result of the increasing urbanization of the watershed without effective planning (Fontana et al. Citation2014). Eutrophication led to episodes that demanded direct intervention to control degrading water quality events, such as the massive cyanobacteria blooms (Beyruth Citation2000; Sant’Anna et al. Citation2007), loading of domestic sewage (Semensatto and Asami Citation2017) and detection of emerging pollutants (López-Doval et al. Citation2017). These events potentially affect human well-being, but a major limitation in models to predict recreation and commercial values is the lack to link actions to changes in ecosystems and modifications in valued attributes (Keeler et al. Citation2012). A peculiar characteristic of the urban growth of this reservoir and one that intensifies its negative impacts is that the majority of the dwellings that have appeared in the last three decades near its margins have suppressed the riparian buffer zones. The dwellings have low constructive standards, and the sanitary sewage system does not serve around 40% of the residences (São Paulo Citation2011).
Vegetation removal affects the average reagent concentration used in the raw water treatment for public supply (Tong and Chen Citation2002; Anbumozhi et al. Citation2005; Mokondoko et al. Citation2016). Hence, the substitute for the valuation of ecosystem services of good-quality water supply is the increasing cost of treatment. The application of the EVER calculation indicates that the reduction of the vegetation cover in 0.7% of the area of the watershed increased 7.1 times the cost of replacing this ecosystem service between 1996 and 2010 (). The reduction of the vegetation cover advance in the watershed has eliminated the service provision and demanded an increasing disbursement of the substitution for the maintenance of water quality, generating a significant externality for the users as a whole.
Table 4. Ecosystem Service Value (ESV) for the ecosystem service of water supply of the Guarapiranga Reservoir in 1996 and 2010.
Due to the restricted data availability and difficulties in obtaining data, the environmental valuation was limited to the direct use value (DUV) relative to the water supply service (e.g. recreation and value of real estate market could not be estimated). The indirect use values (IUV) (e.g. microclimatic regulation), option value (OV) and existence value (EV) (e.g. biodiversity value and refugees) were not estimated. Therefore, the total values presented here are underestimated, because, despite a variety of ecosystem services provided by the reservoir, this work analysed only the supply of water for public supply purposes.
Obtaining data to perform environmental valuation in Brazil is a challenging task. The public bodies responsible for generating the data applicable to the valuation usually do not have the information in the desired format, nor do they provide it. In this study, unfortunately, this situation has been confirmed. Numerous unsuccessful attempts have been made to obtain more detailed historical data on water treatment at the Rodolfo José da Costa e Silva Jr. water treatment plant from Sabesp, real estate market data through Embraesp (to apply the valuation method of hedonic prices). Despite these difficulties and underestimation, the value obtained in this study is already a reference for the evaluation of public policies that guarantee the environmental balance and access to the service of water supply for human consumption.
The estimated economic value of environmental resources is controversial and has been the target of criticism from ecological economists (Nogueira et al. Citation2000; Braat and De Groot Citation2012). However, its application is advocated to provide values that sensitize decision makers and help them reverse or alleviate the qualitative and quantitative scarcity of ecosystem services (Keeler et al. Citation2012). There are examples in the world and Brazil, in this sense (Oliveira et al. Citation2011; Braat and De Groot Citation2012), and some efforts in the MRSP for the control of atmospheric pollution are remarkable. The concentration levels of air pollutants in the city of São Paulo were assessed regarding health costs in 2005 at around US$ 200 million per year (Miraglia and Saldiva Citation2005). Another investigation estimated the health costs due to air pollution in 29 Brazilian metropolitan regions at US$ 1.7 billion annually (Miraglia and Gouveia Citation2014). These efforts point to the need for managers to seize this information to make investments and public policies feasible and to minimize environmental and social impacts (Costanza Citation2000). In this sense, the present study represents a pioneer work in estimating a first economic value of the effects of the environmental degradation in the watershed on the water quality for public supply in the MRSP.
Jacobs et al. (Citation2016) have demonstrated the relevance of integrated valuation for a broad diversity of contexts, such as landscape planning, urban planning, river watershed management, environmental conflict resolution, support for social struggles in environmental conflicts, or strategic impact assessments. Nevertheless, the effectiveness of investments in nature-based solutions, such as the maintenance of the vegetation area in the river watershed, has been demonstrated (Liquete et al. Citation2016), which supports an environmental decision-making process in the river watershed management.
One limitation of this study is the coverage of the total economic value of the environmental resource, according to the difficulties already exposed. Although we must observe the bias of the underestimation of the total economic value of the ecosystem service, it represents the first value for environmental conservation purpose and human life protection in this reservoir.
Ecosystem services sustain life and human well-being on the planet. Considering that human activities influence the quantity and quality of ecosystem services and that market often neglects the economic contributions of these services, we need an effort to estimate the real values of ecosystems for society and the impacts of their degradation or conservation. The urgent implementation of this task will help decision-makers to take a more rational and sustainable path.
The reduction of 0.7% in the vegetation coverage area increased the cost of water treatment 7.1 times, generating a significant externality for the users of the system, whose value resulted in about US$ 6.6 million in 2010. Even if these values are underestimated and partial, the management of the Metropolitan reservoirs should take into account this scenario, enabling the conservation of the natural resources to be reinforced as a state policy and effectively implemented with the participation of the society.
In the case of water resource management, the great challenge is to maintain the quantity and quality of the water supply for the multiple uses of current and future generations. The watershed of the Guarapiranga Reservoir provides a series of ecosystem services for the MRSP, and the knowledge of its condition from the environmental and ecological economy is essential information for its management.
Acknowledgements
The authors are grateful to Carlos Eduardo de Mattos Bicudo, Wanderley da Silva Paganini and Werner Siegfried Hanisch for their comments to improve the article. The first author received a scholarship from Capes (Coordenação de Aperfeiçoamento de Pessoal de Nível Superior), Ministry of Education, to carry out this project.
Disclosure statement
We declare no potential conflict of interest.
Additional information
Funding
Notes on contributors
Felipo Meireles de Brito
Felipo Meireles de Brito is undergraduate in Biological Sciences and MSc. in Ecology and Evolution.
Simone Georges El Khouri Miraglia
Simone Georges El Khouri Miraglia is a full-time professor at the Department of Chemistry Engineering, Universidade Federal de São Paulo, Brazil, and leader of the Laboratory of Economy, Health and Environmental Pollution (LESPA).
Décio Semensatto
Décio Semensatto is a full-time professor at the Department of Environmental Sciences, Universidade Federal de São Paulo, Brazil, and leader of the Research Group in Planning and Processes in Environment.
References
- Ahearn DS, Sheibley RW, Dahlgren RA, Anderson M, Johnson J, Tate KW. 2005. Land use and land cover influence on water quality in the last free-flowing river draining the western Sierra Nevada, California. J Hydrol. 313:234–247.
- Anbumozhi V, Radhakrishnan J, Yamaji E. 2005. Impact of riparian buffer zones on water quality and associated management considerations. Ecol Eng. 24:517–523.
- Andrade MRM, Salim A, Rossini-Penteado D, Costa JA, Souza AA, Saad AR, Oliveira AMS. 2015. Mapeamento do uso da terra para avaliação da qualidade das águas do Reservatório Guarapiranga [Mapping land use to assess water quality of Guarapiranga Reservoir]. Geociências. 34(2):258–274. Portuguese.
- Araújo R. 2017. Recuperação urbana e saneamento ambiental na bacia hidrográfica do Guarapiranga: de onde viemos, onde estamos e para onde vamos [Urban recovery and environmental sanitation of the Guarapiranga watershed: from where we came, where we are and where we will go]. In: Bicudo CEM, Bicudo DC, editors. 100 Anos da Represa Guarapiranga: lições e desafios. 1st ed. Curitiba: Editora CRV; 429–450. Portuguese.
- Arruda-Neto JDT, Oliveira MCC, Sarkis JES, Bordini P, Manso-Guevara MV, Garcia F, Prado GR, Krug FJ, Mesa J, Bittencourt-Oliveira MC, et al. 2009. Study of environmental burden of lead in children using teeth as bioindicator. Environ Int. 35(3):614–618.
- Beyruth Z. 2000. Periodic disturbances, trophic gradient and phytoplankton characteristics related to cyanobacterial growth in Guarapiranga Reservoir, São Paulo State, Brazil. Hydrobiologia. 424:51–65.
- Borger FG. 1998. Valoração Econômica do Meio Ambiente: aplicação da técnica avaliação contingente no caso da bacia do Guarapiranga [Enviromental economic valuation: applying the contingent evaluation in the case of Guarapiranga watershed]. In: Veiga JE, editor. Ciência Ambiental: primeiros Mestrados. 1st ed. São Paulo: Editora Annablume; 229–252. Portuguese.
- Braat LC, De Groot R. 2012. The ecosystem services agenda: bringing the worlds of natural science and economics, conservation and development, and public and private policy. Ecosyst Serv. 1:4–15.
- Chichilnisky G, Heal G. 1998. Economic returns from the biosphere. Nature. 391:629–630.
- Costanza R. 2000. Social goals and the valuation of ecosystem services. Ecosystems. 3(1):4–10.
- Costanza R, d’Arge R, De Groot R, Farber S, Grasso M, Hannon B, Limburg K, Naeem S, O’Neill RV, Paruelo J, et al. 1997. The value of the world’s ecosystem services and natural capital. Nature. 387:253–260.
- Cotrim MEB, Martins EAJ, Furusawa HA, Shihomatsu HM, Monteiro LR, Lebre DT, Otomo JI, Silva LL, Adame G, Brito CF, et al. 2017. Qualidade ecológica da Represa Guarapiranga: água e sedimentos superficiais: multitraçadores ambientais – metais, elementos-traço, interferentes endócrinos, HPAs e fármacos [Ecological quality of the Guarapiranga Reservoir: water and superficial sediments: environmental multiproxies – metal, trace elements, endocrine interferents, APHs and drugs]. In: Bicudo CEM, Bicudo DC, editors. 100 Anos da Represa Guarapiranga: lições e desafios. 1st ed. Curitiba: Editora CRV; 429–450. Portuguese.
- Farrik KK, Branfireun BA. 2015. Flowpaths, source water contributions and water residence times in a Mexican tropical dry forest catchment. J Hydrol. 529(3):854–865.
- Fix M, Arantes P, Tanaka G. 2003. The case of São Paulo, Brazil. In: United nations human settlements programme, editor. The challenge of slums: global report on human settlements. London: Earthscan; p. 1–40.
- Fontana L, Albuquerque ALS, Brenner M, Bonotto DM, Sabaris TP, Pires MA, Bicudo DC. 2014. The eutrophication history of a tropical water supply reservoir in Brazil. J Paleolimnol. 51(1):29–43.
- Gómez-Baggethun E, Barton DN. 2013. Classifying and valuing ecosystem services for urban planning. Ecol Econ. 86:235–245.
- Hartmann, DL, Tank AMGK, Rusticucci M, Alexander LV, Brönnimann S, Charabi Y, Dentener FJ, Dlugokencky EJ, Easterling DR, Kaplan A, Soden BJ, Thorne PW, Wild M, Zhai PM. 2013. Observations: Atmosphere and Surface. In: Stocker, TF, Qin D, Plattner GK, Tignor M, Allen SK, Boschung J, Nauels A, Xia Y, Bex V, Midgley PM, editors. Climate Change 2013: The Physical Science Basis. Contribution of Working Group I to the Fifth Assessment Report of the Intergovernmental Panel on Climate Change. Cambridge: Cambridge University Press; p. 159-254.
- Hackbart VCS, Lima GTNP, Santos RF. 2017. Theory and practice of water ecosystem services valuation: where are we going?. Ecosyst Serv. 23:218–227.
- Hammer Ø, Harper DAT, Ryan PD. 2001. PAST: paleontological statistics software package for education and data analysis. Palaeontologica Electronica. 4(1):1–9.
- Honey-Rosés J, Acuña V, Bardina M, Brozovic N, Marcé R, Munné A, Sabater S, Termes M, Valero F, Vega À, et al. 2013. Examining the demand for ecosystem services: the value of stream restoration for drinking water treatment managers in the Llobregat River, Spain. Ecol Econ. 90:196–205.
- Hoyer RChang H. 2014. Assessment of freshwater ecosystem services in the tualatin and yamhill basins under climate change and urbanization. applied Geography. 53:402-416.
- Jacobs S, Dendoncker N, Martín-López B, Barton DN, Gomez-Baggethun E, Boeraeve F, McGrath FL, Vierikko K, Geneletti D, Sevecke KJ, et al. 2016. A new valuation school: integrating diverse values of nature in resource and land use decisions. Ecosyst Serv. 22(B):213–220.
- Keeler BL, Polasky S, Brauman KA, Johnson KA, Finlay JC, O’Neill A, Kovacs K, Dalzell B. 2012. Linking water quality and well-being for improved assessment and valuation of ecosystem services. P Natl Acad Sci USA. 109(45):18619–18624.
- Liquete C, Udias A, Conte G, Mase F. 2016. Integrated valuation of a nature-based solution for water pollution control. Highlighting hidden benefits. Ecosyst Serv. 22(B):392–401.
- López-Doval JC, Montagner CC, Albuquerque AF, Moschini-Carlos V, Umbuzeiro G, Pompêo M. 2017. Nutrients, emerging pollutants and pesticides in a tropical urban reservoir: spatial distributions and risk assessment. Sci Total Environ. 575:1307–1324.
- Lyytimäki J, Sipilä M. 2009. Hopping on one leg – the challenge of ecosystem disservices for urban green management. Urban For Urban Gree. 8:309–315.
- Miraglia SGEK, Gouveia N. 2014. Custos da poluição atmosférica nas regiões metropolitanas brasileiras [Costs of atmospheric pollution in the Brazilian metropolitan regions]. Cien Saúde Coletiva. 19(10):4141–4147. Portuguese.
- Miraglia SGEK, Saldiva PH. 2005. An evaluation of air pollution health impacts and costs in São Paulo. Brazil Environ Manage. 35(5):667–676.
- Mokondoko P, Manson RH, Pérez-Maqueo O. 2016. Assessing the service of water quality regulation by quantifying the effects of land use on water quality and public health in central Veracruz, Mexico. Ecosyst Serv. 22:161–173.
- Motta RS. 1998. Manual para valoração econômica de recursos ambientais [Handbook for economic valuation of environmental resources]. Rio de Janeiro: IPEA/MMA/PNUD/CNPq. Portuguese.
- Müller F, Burkhard B. 2012. The indicator side of ecosystem services. Ecosyst Serv. 1:26–30.
- Nogueira JM, Medeiros MAA, Arruda FST. 2000. Valoração econômica do meio ambiente: ciência ou empiricismo? [Economic valuation of environment: science or empiricism?]. Cad Cien Tecnol. 17(2):81–115. Portuguese.
- Oliveira PLD, Figueiredo BRD, Cardoso AA. 2011. Atmospheric pollutants in São Paulo state, Brazil and effects on human health–a review. Geochimica Brasiliensis. 25(1):17–24.
- Orsi RH, Stoppe NC, Sato MIZ, Ottoboni LMM. 2007. Identification of Escherichia coli from groups A, B1, B2 and D in drinking water in Brazil. J Water Health. 5(2):323–327.
- Randhir TO, Ekness P. 2013. Water quality change and habitat potential in riparian ecosystems. Ecohydrol Hydrobiol. 13(3):192–200.
- Saad AR, Martinez SS, Goulart ME, Semensatto D, Vargas RR, Andrade MRM. 2015. Efeitos do uso do solo e implantação da estação de tratamento de esgoto sobre a qualidade das águas do Rio Baquirivu-Guaçu, Região Metropolitana de São Paulo [Effects of land use and implementation of a sewage treatment plant on the water quality of the Baquirivu-Guaçu river, São Paulo metropolitan region]. Rev Bras Rec Hídr. 20:147–156. Portuguese.
- SABESP. 2008. Dossiê Sistema Guarapiranga [Guarapiranga system dossier]. São Paulo: Espaço das Águas Fundação Patrimônio Histórico da Energia e Saneamento Companhia de Saneamento Básico do Estado de São Paulo. http://memoriasabesp.sabesp.com.br/acervos/dossies/pdf/9_sistema_guarapiranga.pdf. Portuguese.
- Sant’Anna CL, Melcher SS, Carvalho MC, Gelmego MP, Azevedo MTP. 2007. Planktic cyanobacteria from upper Tietê basin reservoirs, SP, Brazil. Braz J Bot. 30(1):1–17.
- São Paulo (Estado). 2011. Atualização do Plano de Desenvolvimento e Proteção Ambiental (PDPA) da bacia hidrográfica do Guarapiranga [Update of the development and environmental protection plan (PDPA) of the Guarapiranga watershed]. http://www.ambiente.sp.gov.br/cpla/2013/03/14/aprm-area-de-protecao-e-recuperacao-de-mananciais/. Portuguese.
- Semensatto D.Asami T. 2017. Além dos Índices Numéricos: a qualidade da água da Represa Guarapiranga ao longo do tempo e do espaço [Beyond numerical indices: the water quality of the Guarapiranga Reservoir through time and space]. In: Bicudo, CEM, Bicudo, DC, editors. 100 anos da Represa Guarapiranga: lições e desafios [100 years of the Guarapiranga Reservoir: lessons and challenges]. 1st ed. São Paulo: Editora CRV; p. 383-400.
- Sousa RS, Semensatto D. 2015. Qualidade da água do Rio Piracicaba: estudo de caso do efeito da estação de tratamento de esgoto Piracicamirim, município de Piracicaba (SP) [Water quality of the Piracicaba River Basin: study case of the effect of piracicamirim wastewater treatment plant, Piracicaba (SP)]. Rev Bras Rec Hídr. 20:629–638. Portuguese.
- Sun S, Sun G, Caldwell P, McNulty S, Cohen E, Xiao J, Zhang Y. 2015. Drought impacts on ecosystem functions of the U.S. National forests and grasslands: part II assessment results and management implications. For Ecol Manage. 353:269–279.
- Tarifa JR, Armani G. 2001. Os climas naturais [The natural climates]. In: Tarifa JR, Azevedo TR, editors. Os Climas na Cidade de São Paulo: teoria e prática. 1st ed. São Paulo: Geousp; 34–46. Portuguese.
- Tobias S. 2013. Preserving ecosystem services in urban regions: challenges for planning and best practice examples from Switzerland. Integr Environ Assess Manage. 9(3):243–251.
- Tong STY, Chen W. 2002. Modeling the relationship between land use and surface water quality. J Environ Manage. 66:377–393.
- Tundisi JG. 2008. Water resources in the future: problems and solutions. Estudos Avançados. 22(63):7–16.
- Tundisi JG, Matsumura-Tundisi T, Ciminelli VS, Barbosa FA. 2015. Water availability, water quality water governance: the future ahead. Proc Int Assoc Hydrol Sciences. 366:75–79.
- Viveiros M 2004 Jul 25. Esgoto dobra custo de tratamento da água [Sewage doubles water treatment cost]. Folha do Estado de São Paulo. [accessed 2017 Dec 26]. http://www1.folha.uol.com.br/fsp/cotidian/ff2507200401.htm.
- Whately M, Cunha P. 2006. Seminário Guarapiranga 2006: proposição de ações prioritárias para garantir água de boa qualidade para abastecimento público [Guarapiranga Seminar 2006: priority actions to ensure good quality water for public supply]. São Paulo: Instituto Socioambiental. Portuguese.