
ABSTRACT
LEED v4 for Neighborhood Development (LEED-ND) is a neighborhood sustainability assessment tool developed through a collaborative effort between the United States Green Building Council, the Congress for the New Urbanism, and the Natural Resources Defense Council. LEED-ND utilizes a credit-based ratings system that serves as a template for the development of green, sustainable neighborhoods. This research study analyzes the locational and demographic attributes of 246 proposed, completed, and/or in progress LEED-ND sites to better understand whether LEED-ND and its ratings system are achieving its goal of promoting greater social equity. This study analyzes the temporal changes of eight demographic variables that are indicative of neighborhood gentrification. These variables include educational attainment, median income, median rent, median land values, household size, median age, percent non-white, and racial diversity. Statistically significant changes to educational attainment, median rent, and diversity were observed at various geographic levels. It was also determined that the effects of LEED-ND developments are likely felt beyond the physical boundaries of the sites. The findings suggest that LEED-ND developments may function as catalysts of neighborhood gentrification rather than promoting greater social equity.
1. Introduction
In the early 21st century, sustainable urban development has become a significant environmental concern as vast areas of land are consumed for urban development while unsustainable quantities of finite natural resources are depleted faster than they can naturally be replenished (GFN Citation2018). In an attempt to reduce the use of natural resources, promote environmentally friendly design, and minimize negative environmental effects, Leadership in Energy and Environmental Design (LEED) was developed in 1998 by the U.S. Green Building Council (USGBC). Since its inception, LEED has continued to evolve, taking lessons learned from past buildings and projects, and applying them to new sustainable design approaches and initiatives. Originally only applied to individual buildings, the LEED certification process has since been applied to neighborhood-scale developments, known as LEED-Neighborhood Development (LEED-ND) (USGBC Citation2018a).
By the early 1990s, a ‘new urbanism’ movement began to gain momentum, giving rise to organizations such as the USGBC in 1993 (U.S. EPA Citation2016). The USGBC is a non-profit organization dedicated to the design, construction, and operation of cost- and energy-efficient green buildings (USGBC Citation2018b). The Congress for the New Urbanism (CNU) was chartered in 1996 with the goals of combating urban sprawl and encouraging urban infill, traditional neighborhoods, and transit-oriented development (Congress for the New Urbanism Citation2015a). In 2007, LEED-ND (v.1) was created through a collaborative effort involving CNU, the USGBC, and the Natural Resources Defense Council (NRDC) (Congress for the New Urbanism Citation2015b). LEED-ND was designed to provide a holistic framework for approaching neighborhood development.
LEED-ND shifts the focus of sustainable design away from individual buildings and practices, towards the development of sustainable urban neighborhoods. Neighborhoods are assessed using a rating system in which points (or credits) are earned for adhering to the design practices and standards laid out in the LEED (v.4) for Neighborhood Development Project Checklist (USGBC Citation2014). The purpose of the standards is to reduce and reverse environmental impacts, protect natural resources, create a green economy, and enhance social equality through the creation of healthy and productive human environments (USGBC Citation2018b). The LEED-ND rating system, however, may not sufficiently encourage social equity and diversity as one study found that, ‘only 40% of LEED-ND-certified projects currently include affordable housing’ (Garde Citation2009; Sharifi and Murayama Citation2014; Szibbo Citation2016). The ratings system includes a section dedicated to smart location and linkage which encourages the redevelopment of urban areas with existing infrastructure (USGBC Citation2013). This ‘infill’ redevelopment may be beneficial for distressed communities experiencing severe disinvestment and high residential vacancy and joblessness. Redeveloping abandoned or underused properties also provides room for development that might have otherwise been sited on green space or agricultural land, i.e. ‘greenfield’ development (U.S. EPA Citation2017).
An important consideration when planning sustainable developments and the redevelopment of infill areas is the displacement of low income households that may occur as a result of gentrification. Kim (Citation2016) found that income diversity in infill developments only increases when areas are undergoing gentrification. In the case of a neighborhood in Toronto, Dale and Newman (Citation2009) suggested that there is little to no evidence indicating that sustainable developments encourage or even help maintain social diversity and equity within existing neighborhoods. Urban social and economic diversity should be encouraged as developments hosting people of mixed incomes, ages, races, genders, etc. are essential to place diversity and inclusivity (Talen Citation2006). The intentional or unintentional displacement of existing low income residents during redevelopment is in direct opposition to the goals of sustainable development. Talen (Citation2006) argues that planners should lead the way by encouraging mixed-use areas that promote social equity. As more large-scale mixed-use redevelopment projects such as LEED-ND projects are completed, it becomes increasingly important to understand the effects these developments have on the demographic makeup of the areas surrounding them, and to ascertain to what degree, if any, they may catalyze gentrification and displacement in surrounding communities. This may be especially critical in dense urban areas and large metropolitan regions where most LEED-ND projects are located (Smith and Bereitschaft Citation2016). Therefore, it is necessary to understand where LEED-ND sites are being built in terms of the socioeconomic makeup of neighborhoods, and how they may impact changes in neighborhood composition during and after their construction.
This study aims to characterize how and to what extent LEED-ND projects are influencing immediate and adjacent neighborhood demographics including income, rent, land value, age, family size, educational attainment, and ethnic makeup. To assess the temporal effects that LEED-ND projects may have had on the demographic composition of surrounding neighborhoods, we analyze these demographics before and after redevelopment. As large infill projects built under the guise of urban revitalization or sustainable development continue to gain traction, it will become increasingly important to understand how LEED-ND projects influence the developmental trajectory of adjacent urban neighborhoods. Knowledge regarding these effects could help inform changes to LEED-ND policies and goals aimed at mitigating displacement in the face of gentrification, while promoting greater overall social equity within, and adjacent to, redevelopment sites.
2. Background
LEED-ND is a relatively new neighborhood sustainability and assessment (NSA) tool. One of the primary objectives of LEED-ND is to enhance social equity, but it is unknown whether this goal is being achieved using the current ratings system. Previous research has shown that gentrification is often a result of urban revitalization and redevelopment, and thus it is worth exploring whether LEED-ND developments are having a similar impact (Dale and Newman Citation2009; Howell Citation2016; Marcus and Zuk Citation2017; Zuk et al. Citation2017). To address this concern, it is first worthwhile to consider in more detail the LEED-ND framework and the process of gentrification.
2.1 LEED-ND
The LEED-ND framework was created by the USGBC, a non-profit organization overseen by a board of directors (USGBC Citation2018b). Similar to LEED certified buildings, LEED-ND projects aim to reduce energy and natural resource consumption as well as mitigate environmental impacts (U.S. Green Building Council Citation2015). LEED-ND certification often equates to higher property values that appreciate over time, lower utility bills and operating costs, and may lead to international project acclaim (USGBC Citation2016). LEED-certified projects have performed exceptionally well in leasing markets due to lower operating costs, higher rents, and higher selling premiums (Wiley et al. Citation2010). LEED-ND’s simple point-based system and market-based approach, which often rewards developers with faster permit approval, reduced local fees, density bonuses, and green/eco branding, has the potential to be widely adopted (Garde Citation2009; USGBC Citation2012).
In addition to environmental considerations, LEED-ND certification was crafted to encourage urban design and development practices that advance urban livability such as providing lively public spaces, enhancing opportunities for physical activity, and improving the social milieu of the neighborhood (LEED-ND v.4). The evidence so far is mixed on whether these goals have been realized. Stevens and Brown (Citation2011) documented more physical activity among children living in a more walkable LEED-ND development when compared with a less walkable neighborhood, however the authors admit that families more likely to encourage walking may be more prone to move into these types of developments. Boeing et al. (Citation2014) examined a gentrifying neighborhood in Oakland, CA generally considered highly livable by residents, yet noted that the neighborhood could not achieve LEED-ND certification due to technical disqualifications such as the presence of residential garages and driveways. The general consensus is that the LEED-ND rating system and certification is a step in the right direction, but that the process could be enhanced, or at least offer more flexibility, to achieve stated goals.
The LEED-ND rating system is comprised of five categories; smart location and linkage, neighborhood pattern and design, green infrastructure and buildings, innovation and design process, and regional priority credits (USGBC Citation2014). LEED-ND(v.4) certification may be awarded once a project has reached substantial completion and all occupancy certificates have been given out. A LEED-ND project has the potential to earn up to 110 points and may be certified as either LEED Certified (40–49 points), LEED Silver (50–59 points), LEED Gold (60–79 points), or LEED Platinum (80+ points) (USGBC Citation2014).
The smart location and linkage category of LEED-ND is dedicated to reducing urban sprawl, broadly characterized as low-density development, as well as reducing the negative environmental impacts of urban development. Smart location and linkage promotes sustainable development by offering certification credits to sites that contribute less to urban sprawl and land fragmentation. This may be accomplished by siting a location in a brownfield or infill site that has local access to existing transportation, resulting in lower automotive dependency and less need for automotive infrastructure (USGBC Citation2013). Smith and Bereitschaft (Citation2016) conducted a night-time light intensity and land-use study aimed at classifying LEED-ND projects using locational attributes, and found that 114 of 246 sites were located in inner-suburban or central urban infill areas (Smith and Bereitschaft Citation2016). LEED-ND sites were also predominantly located in large central metropolitan statistical areas (Smith Citation2015). These results appear to reflect the influence of Smart Location and Linkage credits within the LEED-ND certification and rating system.
Smart Location and Linkage credits make up more than twenty-five percent of all possible credits within the rating system, however Housing Types and Affordability is only a subsection of Neighborhood Pattern and Design worth just over six percent of all ratings credits (U.S. Green Building Council Citation2014). Smart Location and Linkage are important factors in deciding LEED-ND site eligibility, but difficulty in identifying project sites may be one of the reasons that few LEED-ND sites have received certification (Talen et al. Citation2013). Talen et al. (Citation2013) recommended identifying all LEED-ND eligible sites at the city level rather than looking for individual site locations. This method would provide a city-wide inventory of LEED-ND ready parcels that could potentially make LEED-ND more affordable, and certification more attainable (Talen et al. Citation2013).
Researchers argue that the framework for the LEED-ND rating system, now in its fourth (v.4) iteration, still contains limitations that should be addressed (Mapes and Wolch Citation2011; Berardi Citation2013; Boyle et al. Citation2018). According to Garde (Citation2009), LEED-ND accreditation may be too easy to attain as developers may choose to focus on specific ratings system categories that provide larger credits such as walkability, while ignoring other items like renewable energy (Garde Citation2009; Knack Citation2010). Boyle et al. (Citation2018) suggests that neighborhood sustainability assessment (NSA) tools are becoming the preferred sustainable development tools for both developers and urban planners. The authors examined three separate NSA tools including LEED-ND. They found LEED-ND as an NSA tool to be inappropriate for use in urban infill due to the quantitative nature of the approach. They recommend modifying current NSA tools like LEED-ND that rely on rating systems so that they are ‘more socially oriented and locally relevant’ (Boyle et al. Citation2018, p. 15). This would be done by shifting away from a purely quantitative rating system towards more qualitative methods, requiring more civic involvement and incentives, and an overall more holistic approach that takes into consideration the concerns of all stakeholders (Boeing et al. Citation2014; Boyle et al. Citation2018). Similarly, Berardi (Citation2013) conducted a study of the rating systems for the same NSAs and found that all of them failed to fully address the criteria of sustainability. According to Berardi, all three of the rating systems were primarily focused on an environmental approach to development, and that a more holistic approach that addresses the dynamic nature of cities is necessary (Berardi Citation2013). Mapes and Wolch (Citation2011) shared a similar sentiment while considering the uniformity with which the LEED-ND framework approaches projects regardless of physical scope. They recommend distinguishing between projects based on attributes such as size or ambitions. Also of concern is the fact that a developer may choose to only have a portion of their project assessed, even if it is a relatively small part of a much larger development (Mapes and Wolch Citation2011).
Several critics have noted the relative paucity of points available for housing types and affordability within the neighborhood pattern and design category of the LEED-ND rating system. Currently, housing types and affordability may only contribute up to seven credits out of the 110 credits possible (U.S. Green Building Council 2014b). Garde (Citation2009) concluded that too much weight was given to project location in the rating system, making it easy to certify projects that were well-located even if housing types and affordability were not considered. Despite this, Garde found that 68.5 percent of the LEED-ND projects surveyed included some affordable housing (Garde Citation2009). Seven years later, Szibbo (Citation2016) conducted a similar study that reported only 40 percent of LEED-ND certified projects included affordable housing. Both projects concluded with suggestions on how to strengthen the housing types and affordable housing credits within the rating system. Some of these suggestions include weighting the housing credits more heavily, providing additional credits for workforce housing, credit for providing reduced utility pricing for low income households, developing project goals for specific locations and contexts, and making optional criteria mandatory so that cost effectiveness would not dictate which credits would be sought after (Garde Citation2009; Szibbo Citation2016). These investigations point to the shortcomings of the LEED-ND rating system associated with housing types and affordability. The relative insignificance of the seven credits provided for voluntarily including various housing types and affordable housing may not be enough to properly support inclusivity or mitigate residential displacement following redevelopment.
2.2 Gentrification
Gentrification has been defined as a process in which deteriorating urban neighborhoods, resulting from years of public and private disinvestment, undergo revitalization that brings about new affordable housing options for the middle-class, new infrastructure, new amenities, and new job opportunities. Neighborhood stabilization and the addition of new amenities attracts new, middle-class (and, often, white) gentrifiers who are better able to afford the rising neighborhood housing and service costs. As costs increase, the existing low income, and often minority, residents are forced to relocate to less desirable neighborhoods (Bates Citation2013; Marcus and Zuk Citation2017; Zuk et al. 2018). Altaweel (Citation2018) went so far as to suggest that ‘gentrification can be seen as social cleansing in which neighborhoods push out lower income residents’ (Altaweel Citation2018, p. 1).
Residential displacement associated with gentrification may cause significant distress for low income families and individuals. Negative effects of residential displacement include harassment prior to eviction, being forced to choose poor housing conditions as a trade-off for relocation, a period of homelessness, relocating far from their original homes, moving into areas with less jobs, longer commutes, more environmental or safety issues, and a generally traumatic experience for those involved (Marcus and Zuk Citation2017). However, there may also be benefits to existing residents who manage to remain in neighborhoods undergoing revitalization. Neighborhood improvements associated with gentrification may include lower violent crime, higher scores on standardized testing within public schools, higher rates of employment and income levels, and greater educational attainment (Dastrup and Ellen Citation2016).
Bates (Citation2013) defined a new approach to mitigating the negative outcomes of gentrification by focusing on racially inclusive development. This strategy involves identifying how public investment affects markets, and utilizing the public sector to anticipate and regulate housing market changes. Washington D.C. has introduced similar policies aimed at reducing gentrification in areas experiencing large-scale urban redevelopment. The primary foci of these policies include the preservation of affordable housing, giving tenants the right of first refusal before a building is sold, and treating residency rather than ownership as the basic criteria for neighborhood citizenship (Howell Citation2016). HUD has recommended similar policy changes to preserve existing affordable housing, encourage greater development of rental units at various price points, encourage regional cooperation and strategies, and engage community residents (U.S. Department of Housing and Urban Development Citation2016). These policies are in line with Dale and Newman’s (Citation2009) recommendations following research on the equity of urban development and sustainability projects. The authors concluded that truly sustainable design needs to focus on its accessibility to a diverse group of people, careers, and services. They suggest that this may be achieved by including equity and livability policies that are treated as distinctly different variables, and that the inclusion of affordable housing in and of itself is not enough to meet the needs of low income households within sustainable urban developments (Dale and Newman Citation2009).
Including existing residents in the planning process of redevelopment is another key recommendation to support greater equity and inclusivity (Green Citation2014; Oliver and Pearl Citation2017). Without extensive involvement between the city, residents, and developers, a project may end up benefiting only the developer and not existing residents (Green Citation2014). Oliver and Pearl (Citation2017) came to a similar conclusion in their assessment of the LEED-ND and CASBEE NSA tools. They argue that the inclusion of community consultation and engagement within the framework of LEED-ND and CASBEE was a positive addition, but it comes up short of what is needed. The authors refer to this as a ‘tick-box’ approach that should be reassessed to encourage more collaboration between the public, private investors, and third-parties (Oliver and Pearl Citation2017). Along with a collaborative approach to redevelopment, the developers themselves must also be evaluated. Moore and Bunce ask, ‘who counts as “developers”?’ (Moore and Bunce Citation2009, p. 605). They suggest that true urban sustainability may only be possible when private developers are kept in check (Moore and Bunce Citation2009). Effectively addressing residential displacement resulting from gentrification is a complicated process that includes both qualitative and quantitative components. Given that one of the stated goals of LEED-ND is social equity, and that redevelopment under the guise of urban sustainability and livability is increasingly common, it is worthwhile to assess whether LEED-ND development, guided by the LEED-ND rating system, may be promoting neighborhood gentrification.
3. Methods
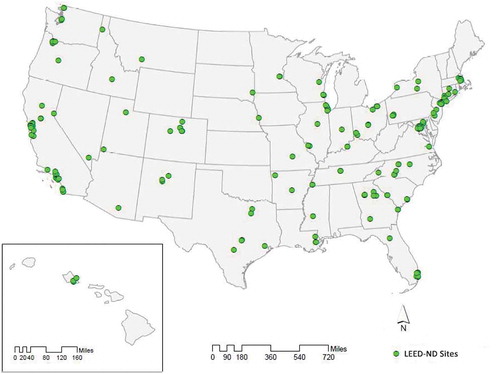
This study focused on the same LEED-ND projects examined by Smith and Bereitschaft (Citation2016) and included 246 proposed or certified LEED-ND sites (). Smith and Bereitschaft’s list of project sites was chosen for analysis in lieu of using only certified projects as few sites were certified prior to 2017. Also, only 2016 census data was available for analysis at the start of this research study. Smith and Bereitschaft (Citation2016) determined that 114 LEED-ND sites were in urban areas based on night-time light intensity scores and land cover types. It was decided to restrict the current study to only those LEED-ND sites in urban locations as gentrification is often associated with neighborhood change in urban areas with concentrations of vulnerable, low-income and minority groups (Marcus and Zuk Citation2017).
Figure 1. Proposed or certified LEED-ND site locations from 2009 to 2016.
An online search for LEED-ND site master plans was conducted prior to analysis. These master plans were used to verify site locations and addresses, and to determine the approximate center of each development. Determining whether LEED-ND sites were located within urban areas was done by geocoding and mapping sites using ArcMap 10.4. All locations were manually verified using the ESRI Aerial Imagery basemap and the site master plans. Once the approximate center of each development was marked, an urban area TIGER/Line shapefile provided by the United States Census Bureau was added to the layers (U.S. Census Bureau Citation2018b). All sites located within urbanized areas as of the year 2000 were analyzed. Sites in non-urban areas were removed to focus on locations where gentrification was more likely.
After determining which LEED-ND sites met our initial criteria, we used the site master plans to create development boundaries around each site. These boundaries, along with historical Google Earth Pro satellite imagery, enabled the identification of those sites that had undergone, or were undergoing, redevelopment since 2009. This step was necessary since many of the projects listed on the USGBC website are not yet certified. LEED-ND projects were placed into one of four categories: completed, substantial completion, partial completion, or no progress. A project was determined to be complete if construction ended prior to 2017, and either a supporting article marking completion was available, or an updated aerial image indicated that construction was complete. Projects categorized as having reached ‘substantial completion’ were between 50–99% complete prior to 2017. This determination was based on a comparison of the land area completed to the land area yet to be developed within the site boundaries. The same approach was used for sites only partially completed prior to 2017. Partial completion sites were those sites that were less than 50% complete. Finally, no progress sites included LEED-ND sites that were listed on the USGBC website, but no additional information could be found, or no progress could be observed using historic aerials.
Following data processing, it was decided that only completed sites would be included in the demographic analysis portion of the study since residents may not be present in partially completed sites. Temporal analysis of the completed LEED-ND sites relied on data from the 2000 census, and the 2012–2016 American Community Survey (ACS) 5-year estimate data (U.S. Census Bureau Citation2018a). The five-year aggregation of community surveys provides the largest possible sample size with the most reliability (U.S. Census Bureau Citation2018c). Nevertheless, it should be acknowledged that the survey data itself was downloaded through IPUMS NHGIS, University of Minnesota (Manson et al. Citation2018). Eight socio-economic/demographic variables were employed to evaluate neighborhood change: educational attainment, median income, median rent, median value, average household size, median age, percent non-white, and racial diversity. Census block group level data was used to determine the scale of the effects of LEED-ND sites on neighborhood change.
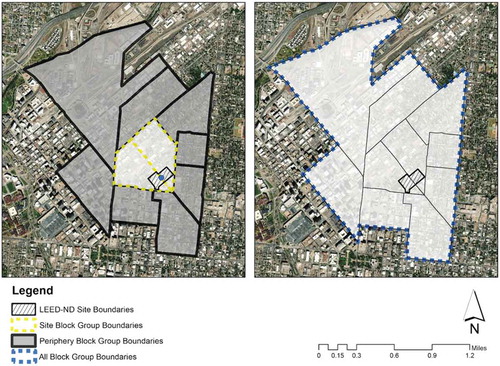
To more fully characterize the potential effects of LEED-ND sites on existing neighborhood residents we examined three separate spatial groupings of block groups: site block groups, periphery block groups, and all block groups (). While demographic data was not available for individual developments, these data should be represented by the block group-level data available through the ACS. Site block groups included only the block group, or in some cases multiple block groups, in which a LEED-ND site was contained. If a site spanned multiple block groups, the data for each block group was aggregated and averaged such that only one data observation would exist for that site. The site block group analysis provided data on the potential impact of LEED-ND development on the immediate neighborhood. Periphery block groups included any block group that shared a border with a site block group, but not the site block group itself.
Block groups that shared a corner with a site block group were included with the periphery block groups. Periphery block group values for each variable were again aggregated and averaged to provide a single value for each. The periphery block group analysis was used to characterize neighborhood change in the broader, surrounding neighborhood that may result from LEED-ND site construction. The ‘all block groups’ category included the values of both the site block group and periphery block groups. These values were again aggregated and averaged for each LEED-ND site. This final aggregation of data was used to determine whether overall neighborhood change could be detected when both the immediate and surrounding site environs were considered.
Although census block groups provide the proper neighborhood-scale for this analysis, it should be noted that the smaller census aggregation units (particularly from the ACS) like block groups and census tracts tend to be more prone to sampling error than larger units such as places and counties (Spielman et al. Citation2014; Spielman and Folch Citation2015). This error will be most pronounced for the single site block groups, but should be reduced when aggregating several block groups together to form the ‘all block groups’ category. Though imperfect, the ACS census data provides the best standardized means of comparing change in neighborhood demographics across cities over a multi-year period.
Figure 2. Example LEED-ND site illustrating site block groups, periphery block groups, and all block groups as they were combined for analysis. This example, showing the ‘Park Avenue Redevelopment Block 3’ LEED-ND site near Denver, CO, was situated within two block groups, so both block groups were treated as the site block group. The site block group(s) variable values were aggregated and averaged.
The demographic variables used to assess gentrification were chosen following an in-depth review of the literature. The Los Angeles displacement pressure index, for example, included income, rent, education level, household size, and race (Bousquet Citation2017). HUD identified income, race, rent, educational attainment, and age as indicators of gentrification (U.S. Department of Housing and Urban Development Citation2016). Green (Citation2018) analyzed income, green development, and tax incentives, but also recommended studying age, gender, race, and education as demographic factors specifically focused on brownfield redevelopment.
This study set out to determine whether statistically significant differences in levels of educational attainment, median income, median rent, median land values, average household size, median age, percent non-white, and racial diversity occurred in or around LEED-ND sites after development. Based on previous findings, it is expected that the educational attainment level will increase as college educated individuals move into urban areas undergoing gentrification (Zuk et al. 2018; Couture and Handbury Citation2017). Income, rent, and land values are also expected to increase as redeveloping areas become more desirable (Ellen and O’Regan Citation2011; Green TL Citation2018). Changes in household size may occur as well as a decrease in median age in gentrifying communities as young, college educated gentrifiers seek urban lifestyles (Bousquet Citation2017; Couture and Handbury Citation2017). Finally, the percent of non-white residents may decrease while racial diversity increases, at least temporarily. Eventually, however, diversity may decline as minorities become displaced (Couture and Handbury Citation2017; Zuk et al. 2018).
All values for median income, median rent, and median land value were inflation adjusted to 2016 so the values for years 2000 and 2016 could be compared. The Consumer Price Index was used to adjust all monetary values with respect to inflation (U.S. Bureau of Labor Statistics Citation2018). Racial diversity was calculated using Simpson’s (Citation1949) diversity index:
(D1) = 1 – pᵢ2
Where D₁ is diversity and pᵢ2 is the summation of the squared proportions of each racial and/or ethnic group compared to the total population of individuals. A diversity value close to 1 is considered highly diverse; a value close to 0 indicates little or no diversity. The Simpson Diversity Index is expected to perform well when dealing with multiple, separate sites (Morris et al. Citation2014).
Descriptive statistics were calculated for all variables to quantify socioeconomic and demographic changes. Variables also underwent statistical significance testing at the 95 percent confidence level utilizing paired t-tests. Block groups with missing data were removed from the dataset for both sample years so that the sample sizes would remain the same. Finally, variables that experienced statistically significant change underwent correlation analysis to determine the relationship between demographic changes at the city level versus the ‘all block groups’ data level for LEED-ND sites. More rapid change in demographic characteristics over the study period at the neighborhood level relative to the surrounding city would provide additional evidence of localized gentrification.
This research aims to characterize the effects of urban LEED-ND sites on nearby neighborhood socioeconomic and demographic composition. Specifically, we ask: do block group demographics change significantly in areas affected by LEED-ND developments, and if so, is gentrification commonly indicated by these changes? Additionally, are LEED-ND projects being built in a variety of neighborhoods with varying demographic and socio-economic profiles, or are they concentrated in particular types of neighborhoods? It is hypothesized that LEED-ND developments are catalysts of neighborhood gentrification, and that the extent of the effects of redevelopment reach beyond the boundaries of the immediate block groups in which they are sited.
4. Results
4.1 Locational analysis
A total of 225 LEED-ND sites were found located within urban area census boundaries. Using aerial imagery and/or articles announcing site completion or progress, 61 sites were determined to have been completed, 31 sites had reached substantial completion, and 53 sites showed signs of being partially completed by the end of 2016. An additional 101 sites were removed from the analysis because either site progress began after 2016, or site progress could not be verified. Of the 61 completed sites (), 59 were used in the demographic analysis. The ‘Simpson Wisser Fort Shafter’ and ‘Hawaii Regional Housing PPV Increment 2’ projects were removed from the sample because they consisted of on-base military housing. It was assumed that the demographic profiles of these neighborhoods would remain fairly constant before and after development.
LEED-ND sites were located in a variety of urban neighborhoods with a wide range of demographic profiles (). For instance, only 1.19 percent of residents in and around the ‘Sustainable Fellwood’ development in Savannah, GA held a bachelor’s degree or higher in 2000 while 90.5 percent of residents in the ‘PHS District Neighborhood the Presidio’ development near San Francisco, CA held the same degree or higher. Likewise, land values ranged from $1.36 million for the ‘PHS District Neighborhood the Presidio’ to just $44k in the ‘9th and Berks Street TOD’ development in Philadelphia, PA.
Figure 3. Completed LEED-ND sites in the United States (Sites may not be certified).
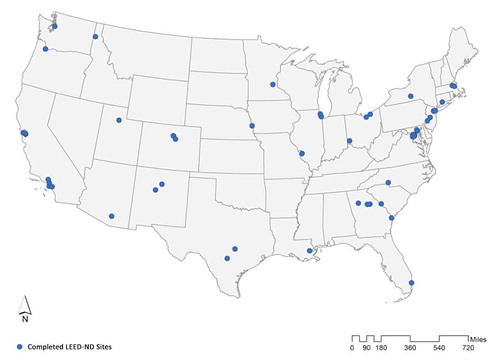
Table 1. LEED-ND site variable ranges, national mean values, and urban area mean values for the 59 sites analyzed in this study based on 2000 census data. Monetary data was inflation adjusted to reflect 2016 values.
Regarding diversity, many LEED-ND site locations exhibited relatively homogenous populations. For instance, ‘Powell’s Pointe’ in Augusta, GA was almost entirely comprised of an older population of black residents with low educational attainment, low income, low land values, low rent, and limited diversity. By contrast, the Village at Taylor Pond was primarily comprised of older, white residents with high incomes, land values, rent, and educational attainment. While the percent of non-white residents in LEED-ND location block groups was more than twenty percent higher than the national mean, Simpson’s Diversity Index value was nine percent lower than the national mean. In general, the mean percent of residents with a bachelor’s degree or higher, median income, average household size, median age, and diversity associated with the areas in and around LEED-ND sites was lower than the national average ().
Median rents, median land values, and the percent of non-white residents found in and around LEED-ND sites were higher than the national means. Compared with the national urban area means, educational attainment, median income, median rent, median land values, percent non-white, and diversity values were all higher around LEED-ND sites. Household size and median age were lower around LEED-ND sites than they were compared to the national urban area means.
4.2 Block group demographic analysis
The block group level analyses provided insight into the demographic changes associated with LEED-ND projects at various geographic scales. At the site block group level, the variables percent bachelor’s degree and median rent experienced statistically significant change between the years 2000 and 2016 (). Mean percent bachelor’s degree increased significantly (p < 0.01) from 15.4 to 23.8 percent. Of the 59 sites analyzed, 45 completed sites experienced an increase in level of educational attainment while 14 decreased. The change in median rent was also significant and positive (p = 0.013) with an increase of $257, from $873 in 2000 to $1,129 in 2016 (in 2016 dollars). Of the 58 sites analyzed, 46 LEED-ND sites experienced an increase in average rent. Median income, median land value, median age, and Simpson’s Diversity Index values all increased over the 2000 to 2016 time period, but none were statistically significant at this level.
Table 2. Site block group demographic means and statistical significance results.
The periphery block group level analysis returned similar statistically similar results with the addition of another variable. Percent bachelor’s degree, median rent, median land value, and Simpson’s Diversity Index experienced statistically significant increases (). The mean percent bachelor’s degree changed significantly and positively (p = 0.01), increasing 5.5 percent from 17.5 to 23 percent. Only seven of the 59 LEED-ND sites experienced decreases in the level of educational attainment at the periphery block group level while 52 sites exhibited increases. Median rent also increased significantly and positively by $279 from $838 to $1,117. Of the 59 sites where rent was analyzed, 56 sites experienced increases, while only three experienced decreases. Median land value also increased significantly and positively by $148,058 from $191,744 to $339,802. Of the 59 sites, 54 experienced positive changes in land value, 4 experienced decreases, and one site had no data available for analysis. The Simpson’s Diversity Index value also increased significantly (p = 0.047) from 0.393 to 0.448. Of the 59 completed sites, the diversity value of 43 sites increased while it decreased in 16 locations. Percent non-white remained largely unchanged between 2000 and 2016, decreasing only 0.1 percent from 53.3 percent to 53.2 percent. Median income, median land value, and median age all increased, but not significantly.
Table 3. Periphery block group demographic means and statistical significance results.
Finally, the analysis involving ‘all block groups’ provided a macro level view of the effects of LEED-ND sites on the surrounding neighborhood by considering those containing the site as well as adjacent block groups (). Median rent was the only variable to exhibit statistically significant change when the data were aggregated in this way, with an increase from $844 to $1,115 per month. Of the 59 completed LEED-ND sites, 47 experienced increases in median rent values while 12 saw decreases (). Household size and percent non-white decreased between 2000 and 2016, but neither change was statistically significant. Percent bachelor’s degree, median income, median land value, median age, and Simpson’s Diversity Index values all increased, but again none of the increases were statistically significant. However, the increase in diversity was just outside the statistically significant threshold (p = 0.053).
Figure 4. Completed LEED-ND site percent change in median rent at the all block group level from 2000 to 2016.
Table 4. All block group demographic means and statistical significance results.
Although not statistically significant, LEED-ND neighborhoods also experienced a noticeable rise in median income, increasing $6,179 (12 percent) from $52,648 to $58,827. Between 2000 and 2016, 38 sites experienced an increase in median income while 21 saw a decrease at the all block group level. Median land values alsoincreased, and by an even greater amount (21 percent) from $279k to $338k.
4.3 Neighborhood vs. city demographic change
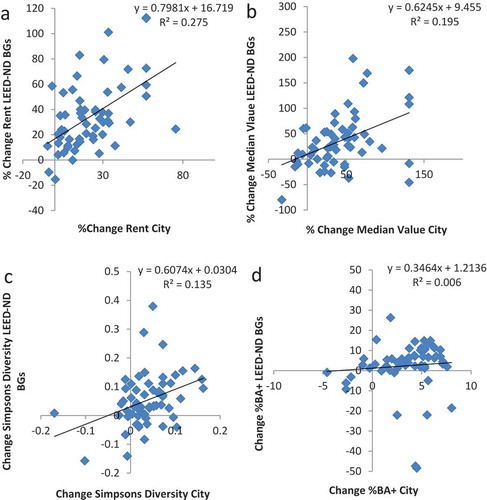
Three of the four variables that exhibited significant change over the study period (rent, median land value, and Simpson’s Diversity index) in the neighborhoods encompassing LEED-ND sites (i.e. the ‘All LEED-ND block groups’ data layer) changed by an amount similar to the cities in which they were located (). The slope of the trend line indicates that, for those LEED-ND neighborhoods located in a city where percent change in rent is less than 80 percent (which included all cities within the sample), the change in rent may be expected to exceed that of the encompassing city. The rate of change in median land value and Simpson’s diversity, however, were similar for LEED-ND neighborhoods and their encompassing cities, and no significant correlation was observed between the two spatial scales for percent change in educational attainment (%BA+). Taken together, the evidence suggests that demographic change observed around the LEED-ND sites cannot be fully explained by the broader socio-economic and demographic changes at the city scale, though most variables did exhibit similar, and significantly correlated, increases.
Figure 5. Correlation analysis comparing changes in A) rent, B) median land value, C) Simpson’s Diversity Index, and D) % bachelor’s degree at the city level to the ‘all block groups’ level of LEED-ND sites.
5. Discussions and conclusions
This study set out to determine whether block group demographics changed significantly in areas affected by LEED-ND developments, and if so, whether these changes are indicative of gentrification. It was hypothesized that LEED-ND developments would impact demographics within both immediate and adjacent neighborhoods, and that these changes would suggest some degree of gentrification. In one or more analyses, we observed statistically significant changes to educational attainment, median rent, median land value, and Simpson’s Diversity Index values between 2000 and 2016. These results – particularly those of increasing education, rent, and land value – support the hypothesis that LEED-ND developments may serve as catalysts of neighborhood gentrification (Zuk et al. 2018; Couture and Handbury Citation2017). Increases in diversity may also point to gentrification as this process often occurs in areas containing concentrations of segregated minority groups (Marcus and Zuk Citation2017; Zuk et al. 2018). While the changes in percent non-white were not statistically significant, the percent of non-white residents decreased at all three geographic levels. Thus, increases in diversity may occur as a result of the introduction of new residents whom are frequently white (Baker and Lee Citation2017).
It was expected that if LEED-ND sites were catalyzing gentrification then significant changes would also have been observed in median income, median age, average household size, and percent non-white (Bousquet Citation2017; Pudlin Citation2016; U.S. Department of Housing and Urban Development Citation2016; Bates Citation2013). One possible explanation as to why we did not observe a significant change in these variables is the limited temporal scope of this research. The LEED-ND sites began construction in 2009 and many of the completed sites have only just recently reached completion. Given the short temporal duration between site construction/completion and the 2016 dataset used in this study, it is possible that not enough time had elapsed for redevelopment to significantly influence neighborhood demographics. However, although none of these variables experienced significant change, percent non-white decreased, while median income values increased, as expected. The positive increases in median income along with the decrease in non-white population are in agreement with previous gentrification research (Dale and Newman Citation2009; Bates Citation2013; Zuk et al. 2018).
Notably, statistically significant changes in median rent values were observed across all three geographic scales, statistically significant changes in educational attainment were seen at the site block group and periphery block group levels, statistically significant changes to land value were seen at the periphery block group level, and statistically significant changes to diversity values were also seen at the periphery block group level. Admittedly, some of the change in socio-economic and demographic characteristics observed around LEED-ND sites over the study period are linked to broader changes in their surrounding cities. The increase in rent, however, was generally greater for LEED-ND sites than for their surrounding cities, providing evidence of gentrification in these neighborhoods.
One explanation as to why median rent changed at all three geographic levels, but educational attainment, land value, and diversity did not, is that these sites are merely experiencing the first phases of gentrification. As observed in other studies, rent and land value increases are often associated directly with redevelopment as reinvestment in site amenities and infrastructure increases the desirability of an area and attracts higher-income residents (Ellen and O’Regan Citation2011; Zuk et al. 2018). This increased desirability then attracts new, middle class white gentrifiers into the area. As more gentrifiers move into the LEED-ND sites, it’s expected that educational attainment and diversity will continue to increase in step (Zuk et al. 2018; Couture and Handbury Citation2017). Importantly, the findings of this study suggest that LEED-ND sites may spur gentrification beyond their immediate block groups and well into peripheral block groups. Additional consideration should therefore be given to how development will affect surrounding areas.
It is important to consider that reinvestment and subsequent neighborhood change, whether promoted by large-scale developments like those associated with LEED-ND or otherwise, are not universally detrimental to local communities. Indeed, cities are often willing to work with developers, using tax increment financing (TIFs) and other incentives to revitalize struggling areas and grow the local tax base (Dale and Newman Citation2009; Fainstein Citation2010; Squires and Lord Citation2012). The primary concern is that equitable consideration is seldom given to existing and lower-income residents, nor is there often adequate inclusion of the local community in planning decisions. With a stronger focus on social inclusivity, the LEED-ND certification process could become an additional tool for local municipalities looking to advance social as well as economic and environmental sustainability.
A final question this study sought to address was whether LEED-ND projects were being built in a variety of neighborhoods with varying demographic and socio-economic profiles, or if they were concentrated in particular types of neighborhoods. The locational analysis portion of this study determined that LEED-ND developments are typically found within urban areas, and that they are sited in a variety of urban neighborhoods with various demographic profiles. Out of the original 246 sites studied in this analysis, 225 were found to be contained within the 2000 census urbanized area boundaries. This is in line with Smith and Bereitschaft (Citation2016) findings as they identified 204 out of 246 sites were found within urbanized areas based on night-time light intensity values. Demographically, LEED-ND sites were found located in a variety of urban neighborhoods with a wide range of demographic profiles.
The results of this study in combination with previous research on redevelopment may be used to re-evaluate existing development policies and procedures (Dale and Newman Citation2009; Szibbo Citation2016). As mentioned, the LEED-ND rating system may not sufficiently promote its goal of achieving greater social equity as little consideration is given to housing types and affordability, let alone the likely effects of gentrification. The LEED-ND rating system provides up to seven credits for the inclusion of various housing types and affordable housing, but as of now, the inclusion of affordable housing is optional. Even if the inclusion of affordable housing was a mandatory requirement, it is not always sufficient to mitigate gentrification (Dale and Newman Citation2009).
The socioeconomic and demographic make-up of neighborhoods should be considered before, during, and after redevelopment to better plan for, and reduce, gentrification-led displacement. Possible changes to the LEED-ND rating system could include an affordable housing mandate that is weighted similarly to that of Smart Location and Linkage. Another change to the rating system could include the addition of a component(s) directly aimed at identifying areas susceptible to gentrification, and the development of a gentrification mitigation plan. This could be done using a displacement index similar to those used by the Los Angeles Innovation Team or Portland’s Bureau of Planning and Sustainability (Bousquet Citation2017). Once areas susceptible to gentrification are identified as potential LEED-ND sites, it would be necessary to devise a location-specific gentrification mitigation plan that would involve all stakeholders. Previous research has shown that a collaborative approach to development that involves existing residents, city and planning officials, developers, non-profit organizations, and other stakeholders is necessary to advance community sustainability (Green Citation2014; Oliver and Pearl Citation2017).
This research provides evidence that LEED-ND is indeed functioning as a catalyst of neighborhood gentrification. It is important, however, to consider that gentrification is a process, and that this study was constrained temporally. As such, future research could re-evaluate this group of LEED-ND sites, perhaps five or ten years from now, and determine if gentrification has in fact advanced. Additional completed LEED-ND sites should soon be available for analysis, providing a larger dataset from which to draw upon. LEED-ND and its rating system represent a widely-embraced strategy to enhance neighborhood sustainability and economic vitality, but the USGBC’s current system of assessment may have a darker side: a tendency toward gentrification and reduced inclusivity.
Disclosure statement
No potential conflict of interest was reported by the authors.
Additional information
Notes on contributors
Eric M. Benson
Eric M. Bensonis an M.A. Geography graduate from the University of Nebraska at Omaha who works as a geospatial analyst. His research and professional interests include urban sustainability,land development,and GIS.
Bradley Bereitschaft
Bradley Bereitschaftis an Associate Professor of geography at the University of Nebraska at Omaha. His research and teaching interests include urban geography, urban sustainability, and urban livability.
References
- Altaweel M. 2018 Mar 26. Using GIS to study gentrification. GIS Lounge. GIS Industry: [about 4 screens]. [accessed 2018 Mar 27]. https://www.gislounge.com/using-gis-study-gentrification/.
- Baker DM, Lee B. 2017. How does light rail transit (LRT) impact gentrification? evidence from fourteen US urbanized areas. J Plan Educ Res. 39(1):35–49.
- Bates LK. 2013. Gentrification and displacement study: implementing an equitable inclusive development strategy in the context of gentrification. Portland (OR): City of Portland Bureau of Planning and Sustainability.
- Berardi U. 2013. Sustainability assessment of urban communities through rating systems - ProQuest. Environ Dev Sustain. 15(6):1573–1591.
- Boeing G, Church D, Hubbard H, Mickens J, Rudis L. 2014. LEED–ND and livability revisited. Berkeley Plan J. 27(1):131–155.
- Bousquet C. 2017. using mapping to understand gentrification, prevent displacement. Government Technology. Data: [about 14 screens]. [accessed 2018 Jun 24]. http://www.govtech.com/data/Using-Mapping-to-Understand-Gentrification-Prevent-Displacement.html.
- Boyle L, Michell K, Viruly F. 2018. A critique of the application of neighborhood sustainability assessment tools in urban regeneration. Sustainability. 10(4):1005.
- Congress for the New Urbanism. 2015a. CNU History. Washington (DC): Congress For The New Urbanism. [accessed 2018 Sep 10]. https://www.cnu.org/movement/cnu-history.
- Congress for the New Urbanism. 2015b. LEED for Neighborhood Development. Washington (DC): Congress For The New Urbanism. [accessed 2018 Sep 10]. https://www.cnu.org/our-projects/leed-neighborhood-development.
- Couture V, Handbury J. 2017. Urban Revival in America, 2000 to 2010. UC Berkeley: University of Pennsylvania and NBER. https://econ.uconn.edu/wp-content/uploads/sites/681/2017/08/UrbanizationPatterns_v89.pdf.
- Dale A, Newman LL. 2009. Sustainable development for some: green urban development and affordability. Local Environ. 14(7):669–681.
- Dastrup S, Ellen IG. 2016. Linking residents to opportunity: gentrification and public housing. Cityscape: J Policy Dev Res. 18(3):87–107.
- Ellen IG, O’Regan KM. 2011. How low income neighborhoods change: entry, exit, and enhancement. Reg Sci Urban Econ. 41(2):89–97.
- Fainstein S. 2010. Redevelopment planning and distributive justice in the American metropolis. SSRN Available at SSRN. doi:10.2139/ssrn.1657723
- Garde A. 2009. Sustainable by design?: insights from U.S. LEED-ND pilot projects. J Am Plan Assoc. 75(4):424–440.
- GFN. 2018. Ecological Footprint. Oakland (CA): Global Footprint Network. [accessed 2018 Sep 9]. https://www.footprintnetwork.org/our-work/ecological-footprint/.
- Green J. 2014 Sept 26. Is urban revitalization without gentrification possible? The Dirt. [about 3 screens]. [accessed 2018 Jul 8]. https://dirt.asla.org/2014/09/26/is-urban-revitalization-without-gentrification-possible/.
- Green TL. 2018. Evaluating Predictors for Brownfield Redevelopment. Land use Policy 73(2018):299–319.
- Howell K. 2016. Preservation from the bottom-up: affordable housing, redevelopment, and negotiation in Washington, DC. Hous Stud. 31(3):305–323.
- Kim J. 2016. Achieving mixed income communities through infill? the Effect of infill housing on neighborhood income diversity. J Urban Affairs. 38(2):280–297.
- Knack RE. 2010. LEED ND: what the skeptics say. Planning. 76(10):18–21.
- Manson S, Schroeder J, Riper DV, Ruggles S. 2018. IPUMS national historical geographic information system: version 13.0 [Database]. Minneapolis: University of Minnesota. doi:10.18128/D050.V13.0.
- Mapes J, Wolch J. 2011. ‘Living Green’: the promise and pitfalls of new sustainable communities. J Urban Des. 16(1):105–126.
- Marcus J, Zuk M. 2017. Displacement in San Mateo County, California: consequences for housing, neighborhoods, quality of life, and health. Berkeley (CA): University of California, Berkeley Institute of Governmental Studies. Research Brief.
- Moore S, Bunce S. 2009. Delivering sustainable buildings and communities: eclipsing social concerns through private sector-led urban regeneration and development. Local Environ. 14(7):601–606.
- Morris EK, Caruso T, Buscot F, Fischer M, Hancock C, Maier TS, Meiners T, Muller C, Obermaier E, Prati D, et al. 2014. Choosing and using diversity indices: insights for ecological applications from the German biodiversity exploratories. Ecol Evol. 4(18):3514–3524.
- Oliver A, Pearl DS. 2017. Rethinking sustainability frameworks in neighbourhood projects: a process-based approach. Build Res Inf. 46(5):513–527.
- Pudlin A. 2016. Los Angeles index of displacement pressure. ArcGIS. [accessed 2018 Jun 24]. http://www.arcgis.com/home/item.html?id=70ed646893f642ddbca858c381471fa2.
- Sharifi A, Murayama A. 2014. Neighborhood sustainability assessment in action: Cross-evaluation of three assessment systems and their cases from the US, the UK, and Japan. Build Environ. 72:243–258.
- Smith RM. 2015. Planning for urban sustainability: the geography of LEED®–Neighborhood Development™ (LEED®–ND™) projects in the United States. Int J Urban Sustainable Dev. 7(1):15–32.
- Smith RM, Bereitschaft B. 2016. Sustainable urban development? Exploring the locational attributes of LEED-ND projects in the United States through a GIS analysis of light intensity and land use. Sustainability. 8(6):547.
- Spielman SE, Folch D, Nagle N. 2014. Patterns and causes of uncertainty in the American Community Survey. Appl Geogr. 46:147–157.
- Spielman SE, Folch DC. 2015. Reducing uncertainty in the American Community Survey through data-driven regionalization. PLoSOne. 10(2):e0115626.
- Squires G, Lord AD. 2012. The transfer of tax increment financing (TIF) as an urban policy for spatially targeted economic development. Land Use Policy. 29(4):817–826.
- Stevens R.BBrown, B.B. 2011. Walkable urban LEED_Neighborhood-Development (LEED-ND community design and children's physical activity. selection, environmental, or catalyst effects? International Journal of Behavioral Nutrition and Physical Activity. 8:139.
- Szibbo N. 2016. Lessons for LEED® for neighborhood development, social equity, and affordable housing. J Am Plan Assoc. 82(1):37–49.
- Simpson EH. 1949. Measurement of Diversity. Nature 163–688.
- Talen E. 2006. Design that enables diversity: the complications of a planning ideal. J Plan Lit. 20(3):233–249.
- Talen E, Allen E, Bosse A, Ahmann J, Koschinsky J, Wentz E, Anselin L. 2013. LEED-ND as an urban metric. Landscape Urban Plan. 119:20–34.
- U.S. Bureau of Labor Statistics. 2018. CPI Home. Washington (DC): U.S. Bureau of Labor Statistics. [accessed 2018 Jul 8]. https://www.bls.gov/cpi/.
- U.S. Census Bureau. 2018a. American FactFinder - using FactFinder. Washington (DC): U.S. Census Bureau. [accessed 2018 Jul 8]. https://factfinder.census.gov/faces/nav/jsf/pages/programs.xhtml?program=acs.
- U.S. Census Bureau. 2018b. TIGER/Line® Shapefiles and TIGER/Line® Files. Washington (DC): U.S. Census Bureau. [accessed 2018 Jul 8]. https://www.census.gov/geo/maps-data/data/tiger-line.html.
- U.S. Census Bureau. 2018c. When to use 1-Year, 3-Year, Or 5-Year Estimates. Washington (DC): U.S. Census Bureau. [accessed 2018 Sep 2]. https://www.census.gov/programs-surveys/acs/guidance/estimates.html.
- U.S. Department of Housing and Urban Development. 2016. Ensuring Equitable Neighborhood Change: Gentrification Pressures on Housing Affordability. Washington (DC): Office of Policy Development and Research. p. 1–21.
- U.S. EPA. 2016. Basic Information. Washington (DC): U.S. Environmental Protection Agency. [accessed 2018 Jul 8]. https://archive.epa.gov/greenbuilding/web/html/about.html.
- U.S. EPA. 2017. Smart Growth, Brownfields, and Infill Development. Washington (DC): U.S. Environmental Protection Agency. [accessed 2017 Apr 9]. https://www.epa.gov/smartgrowth/smart-growth-brownfields-and-infill-development.
- U.S. Green Building Council. 2012. A Local Government Guide to LEED for Neighborhood Development. Washington (DC): U.S. Green Building Council. [accessed 2019 Jul 16]. https://s3.amazonaws.com/legacy.usgbc.org/usgbc/docs/Archive/General/Docs6131.pdf
- U.S. Green Building Council. 2013. Smart Location and Linkage. Washington (DC): U.S. Green Building Council. [accessed 2018 Sep 10]. https://www.usgbc.org/drupal/legacy/usgbc/docs/Archive/General/Docs2865.pdf
- U.S. Green Building Council. 2014. Checklist: LEED V4 for Neighborhood Development. Washington (DC): U.S. Green Building Council. [accessed 2018]. http://www.usgbc.org/resources/leed-v4-neighborhood-development-checklist.
- U.S. Green Building Council. 2015. Encouraging Building Energy Improvements through Tax Incentives. Washington (DC): U.S. Green Building Council. [accessed 2018 Jul 8]. http://www.usgbc.org/resources/encouraging-building-energy-improvements-through-tax-incentives.
- U.S. Green Building Council. 2016. Benefits of Green Building. Washington (DC): U.S. Green Building Council. [accessed 2018 Jul 8]. http://www.usgbc.org/articles/green-building-facts.
- U.S. Green Building Council. 2018a. LEED v4 Neighborhood Development Guide. Washington (DC): U.S. Green Building Council. [accessed 2018 Jul 8]. http://www.usgbc.org/guide/nd.
- U.S. Green Building Council. 2018b. About USGBC. Washington (DC): U.S. Green Building Council. [accessed 2018 Jul 8]. https://new.usgbc.org/about.
- Wiley JA, Benefield JD, Johnson KH. 2010. Green design and the market for commercial office space. J Real Estate Finance Econ. 41(2):228–243.
- Zuk M, Bierbaum AH, Chapple K, Gorska K, Loukaitou-Sideris A. 2017. Gentrification, displacement, and the role of public investment. J Plan Lit. 33(1):31–44.