
ABSTRACT
Africa’s high level of food insecurity is exacerbated by rapid urbanisation, leading to the diversion of resources from food production in rural areas. Despite this, food insecurity policies continue to disproportionately focus on rural dwellers due to persistently high levels of rural poverty. We examine the association between housing type and urban food insecurity using the 2017 South Africa General Household Survey. Using the Household Food Security Access Scale and a dietary diversity indicator, we find that like other forms of deprivation in South Africa, food insecurity has significant racial and gender dimensions. Dwelling type is vital in influencing the food insecurity of households using both measures. Persons living in informal homes are more likely to experience food insecurity than those in semi-formal and formal dwellings. There is a need to create a synergy between new and already existing programmes so that they are appropriately leveraged.
Introduction
Africa remains embroiled in the paradox of being a predominantly agrarian continent while still recording the highest levels of food insecurity and hunger globally (FSIN Citation2018). Even though South Africa has been adjudged the only African country to be categorised as having a low level of threat of hunger (Grebmer et al. Citation2014) and is a net exporter of agricultural commodities (Du Toit et al. Citation2011; Koch Citation2011), a significant proportion of its population is threatened by food insecurity (Shisana et al. Citation2013). The threat of food insecurity and levels of hunger at the micro level in South Africa appear to be mainly driven by high inequality and the pattern of poverty.
The National Health and Nutrition Survey reports that up to 26% of households surveyed experience hunger (Shisana et al. Citation2013). Furthermore, an estimated 14% of the country’s population are vulnerable to food insecurity (Koch Citation2011). As with other socio-economic indicators in the country, the level of food insecurity varies significantly by location, gender, and race. Compared to 32% of urban informal households, 37% of rural informal households are reported to be food insecure (Shisana et al. Citation2013). Urban formal households recorded the lowest level of hunger of 19% (Shisana et al. Citation2013).
At provincial level, the Eastern Cape recorded the highest levels of hunger of 36.2% with the Western Cape reporting the lowest level of 16.4% (Shisana et al. Citation2013). The non-white population generally records the highest levels of food insecurity (Shisana et al. Citation2013).
However, the black African population group has the highest prevalence of food insecurity (Shisana et al. Citation2013; Stats Citation2014; Stats SA Citation2017). Available data from the General Household Survey suggests that at the national level, 22.6% of the population is severely food insecure (Stats SA Citation2018). More so, 11.3% of households and 13.2% of individuals are identified as hungry (Stats SA Citation2018).
Food insecurity effectively captures how food relates to forms of deprivation including poverty (Bhattacharya et al. Citation2004; Burns Citation2004; Hendriks Citation2005). This link with poverty implies that all segements of the population that exhibit high levels of poverty if not food insecure, face an imminent threat of food insecurity.
Despite lowering poverty significantly since 1993, over 30 million people in South Africa live in poverty and are associated with specific groups of the national population (Stats Citation2015; Stats SA Citation2017, Citation2018). Latest national food poverty estimates indicate that poverty has increased in South Africa from 20.2% in 2014 to 25.2% in 2017 (Stats Citation2015; Stats SA Citation2017, Citation2018).
However, a more challenging dimension to the issue of poverty is its nature and character. Poverty in South Africa has geospatial, regional, and gender dimensions. Also, due to the country’s history of apartheid, when the largest segment of the population, specifically the non-white population were systematically discriminated against, poverty and all forms of deprivation in South Africa continue to exhibit strong racial patterns.
Rural areas continuously record much higher levels of poverty than urban areas with the rural poverty level of 81.3% as against the urban equivalent of 40.6% (Stats Citation2014; Stats SA Citation2017). In terms of regional distribution, Eastern Cape, Kwazulu Natal, North West, Mpumalanga, and Limpopo all report poverty levels above 50% with Limpopo having the highest level of 70.1% (Stats SA Citation2017). The provinces with the lowest levels of poverty are Gauteng and the Western Cape, reporting values of 33.1% and 37.1% respectively (Stats SA Citation2017).
Past racial patterns continue to dominate, thus poverty has a racial gradient. The black African population record a level of 64.2% compared to 41.3% of the coloured people, 5.9% of the Indian population and 1.0% of the minority white population (Stats SA Citation2017). Poverty in South Africa is also a gendered problem as females report higher levels than males, 57.2% and 53.7% respectively (Stats SA Citation2017).
Additionally, South Africa like others on the continent is experiencing rapid urbanisation (Guneralp et al. Citation2017). The urban share of the country’s population has been consistently rising from approximately 60% in 2007 to 66% in 2017 and this growth is expected to continue (www.statista.com 2018). This high urbanisation rate further complicates the landscape of food insecurity in South Africa as both human and physical resources are moved away from food production since food production predominantly occurs in rural areas.
With its large and growing share of urbanites in the national population, increasingly smaller numbers of South Africans depend directly on agricultural activities directly as a source of food. The implication is that most of South Africa’s population depend on cash to purchase food, especially so in the urban areas. Therefore any challenges to the supply of food and hikes in food prices such as the 2008 world food crisis and the 2015 drought directly translate into higher prices for these net food buyers and could potentially compromise their food security.
Since 2015, food prices have generally been rising (Stats Citation2016). This implies that urban dwellers are particularly vulnerable to volatile food prices and are often forced to decrease other expenditure to meet their basic food requirements (Headey and Fan Citation2008; Cohen and Garrett Citation2010; Ivanic et al. Citation2011). Szabo (Citation2016) also notes that urbanisation constitutes a challenge to food availability in terms of changing consumption patterns, food production, and supply processes. Rapid urban growth implies more food will have to be available to people who live in an environment that has traditionally been perceived as inappropriate for agriculture. As urban growth continues, water which is a crucial resource for agricultural production is becoming scarcer and often wasted due to excessive domestic and industrial usage, thus jeopardising food supplies (FAO Citation2011).
In the context of growing economies, poor urban dwellers are thereby at risk of consuming inadequate and low-quality food, including street food, which may be unhygienic, thus exposing them to health risks (Omemu and Aderoju Citation2008; Rheinländer et al. Citation2008; Alkon et al. Citation2013).
Urbanisation is thus highly correlated with access to and consumption of ultra-processed foodstuffs, which have higher levels of sugar and salt (Koc and Welsh Citation2001; Alkon et al. Citation2013). Being the most accessible and affordable foods in many urban spaces, the urban poor tend to consume these high-energy processed foods because of affordability and accessibility (Alkon et al. Citation2013; Malik Citation2013; Peyton et al. Citation2015).
Globally, a response to the challenge of urbanisation for food production has been the increase in urban agriculture in the forms of community gardens, kitchen gardens and backyard gardens (Zezza and Tasciotti Citation2010; Crush and Frayne Citation2011; Afriyie et al. Citation2014; Tacoli and McGranahan Citation2015). Urban areas are currently being viewed as new frontiers for food production and anticipated to contribute significantly to feeding the growing urban populations (Zezza and Tasciotti Citation2010; Tacoli and McGranahan Citation2015).
While there is an increasing number of studies looking at the linkages between urbanisation and food insecurity, literature on the association between housing and food insecurity in the context of urban areas is limited, especially so in the context of developing countries. Studies in developed countries that have focused on the issue of housing in relation to urban food insecurity have often focused on issues related to housing stability and costs. Evidence however suggests that in urban areas, housing quality, stability and costs are associated with food insecurity (Pothukuchi and Kaufman Citation1999; Ma et al. Citation2008; Arene and Anyaeji Citation2010; Silva et al. Citation2017).
More so, the focus of policies that seek to address food insecurity has overwhelmingly been on rural dwellers and smallholders. The emergence of an urban food insecurity problem in the context of the existing high levels of rural poverty and food insecurity calls for extensive research on urban-specific associates and causal pathways. Housing and food insecurity are two contemporary urban challenges, and as South Africa rapidly urbanises, it is critical to examine how these two interplay. Thus the examination of the interaction between housing type and urban food insecurity, an underexplored pathway in developing countries is crucial.
Using data from the General Household Survey (GHS), we examine the food insecurity challenge in urban areas by posing the question: Does the type of dwelling matter for levels of food insecurity of urban households? The hypothesis is that living in an informal dwelling leads to an increased threat of food insecurity.
The paper is organised as follows; the next section presents a conceptualisation of food insecurity, the methodology is then presented, followed by the results, discussions, conclusions and recommendations respectively.
The concept of food insecurity
Food insecurity is challenging to define as a multiplicity of concepts is embedded in it. A clue can be deduced from the definition of food security (Eicher and Staatz Citation1985) as ‘the ability of a country or region to provide timely, stable and nutritionally rich food supply to the population over the long term’ (Staatz et al. Citation1990). Thus the inability to do so constitutes food insecurity. Another way of looking at food insecurity touches on the anxiety about having food or having adequate money to purchase food, as this often leads to individuals cutting their portion to avoid hunger, for example (Klein Citation1996). The two definitions provided also illustrate how the concept has oscillated in the level of analysis from a focus on national and international food insecurity in the early periods to a discussion at the household or individual level in the 1980s and 1990s (Maxwell and Smith Citation1992). These definitions also indicate that food insecurity has a spatial and temporary dimension; it may be chronic; occurring over a long period or short term; a temporary decline in access food to sufficient food.
The FAO succinctly sums this up when it defines food security as ‘a situation that exists when all people, at all times, have physical, social and economic access to sufficient, safe and nutritious food that meets their dietary needs and food preferences for an active and healthy life’ (FAO et al. Citation2012, p. 57). This definition draws out the need for any proper assessment of food and nutrition security to focus on factors that affect food availability, food access and food utilisation (Szabo Citation2016). This is key because the aforementioned factors have the potential to influence both the current food security status and the potential for change in this status.
Thus, in an analysis of food insecurity at the household level in the context of urbanisation, we examine factors that affect the immediate status of a household and those that may lead to a change in the food and nutritional status of the household. This is achieved by exploring all aspects such as availability of food, utilisation and stability of food security (Szabo Citation2016) at the household level. Food insecurity has also been conceptualised as a sub-category of poverty. Food poverty reflects the lack of enough income or resources necessary to obtain the amount of food required to be food secure (FAO Citation2008; Burchi and De Muro Citation2016).
The households’s status of food and nutrition security depends on whether food is readily available to the household, a typical supply-side problem which in urban areas often ceases to be a problem of production only (Battersby Citation2012; Szabo Citation2016). Even if the food is readily available, householdaccess, depends on the ability of the household to obtain sufficient quantity and quality food that meets the nutritional needs of its members, which is also further complicated by the urban landscape in developing countries (Szabo Citation2016). Beyond influences such as poverty, inequality, high price levels, availability of food, and other geopolitical and social factors, access to food is heavily dependent on food preferences. Finally, utilisation of food, which relates to the intake of adequate quantity and quality of food depends largely on individual-specific characteristics. Thus to effectively analyse food insecurity in households, it is important to explore factors that affect the availability of food, the use of food and access to food for a given period.
Methods
Study design
The paper conducts a quantitative cross-sectional analysis. The analysis combines both descriptive charts and tables with an estimation of two binary regression models using the nationally representative 2017 South Africa General Household Survey.
Data source
The GHS is an annual survey that has been gathering information on critical characteristics of the country’s population at the household level since 2002. The survey scope includes topics such as education, health and social development, housing, household access to services and facilities, food insecurity and agriculture (Stats SA Citation2018). The two-stage stratified sample design adopted for the survey conducts a Probability Proportional to Size (PPS) sampling of Primary Sampling Units (PSU) at the first stage (Stats SA Citation2018). The second stage performs a systematic sampling of Dwelling Units (DUs). The household response rates for the 2017 survey was 89.4% (Stats SA Citation2019).
Variables
Based on the theoretical discussions, and data availability, variables were selected to understand the food insecurity situation in South Africa’s urban areas, presents a summary of measures used. The two explained variables adopted in measuring household food security are generated from the survey using available data on household access and food group consumption patterns namely: Household Food Insecurity Access Score (HFIAS) indicator and the Household Dietary Diversity (HDD) index. The explanatory variables include household characteristics of income, age of household head, gender of household head, household size, the presence of children in the household, race or population group of household head,Footnote1 employment status of household head, a generated variable reflecting the type of dwelling and a variable indicating if a household benefitted from low-income housing or Reconstruction and Development Programme (RDP).
Table 1. Summary of variables/measures used in the analysis.
Construction of HFIAS, HDD and dwelling type variables
The Household Food Insecurity Access Score (HFIAS) measures food insecurity from an access perspective (Coates et al. Citation2007). The index itself is an additive index computed with questions related to household’s access to food. From 2010, the GHS included eight questions that show changes households made in their diet or consumption of food as a result of limited resources to acquire food. In line with the GHS, we allocate a score of 1 for an affirmative response and 0 otherwise. The final index sums up the scores and is classified as follows: a total score of 0 to 1 indicates that household is food secure, a score from 2 to 6 reflects inadequate food security while households that score from 7 to 9 are regarded as severely inadequate. The binary measure applied for this study combines inadequate and severely inadequate as one category.
The HDD index is entirely different from the access based measure of food insecurity above as it captures the consumption of various food groups over a specified reference period (Swindale and Bilinsky Citation2006; Kennedy et al. Citation2010; Jones et al. Citation2013). However, similar to the HFIAS, the index also sums responses provided by the households (Hoddinott and Yohannes Citation2002). The GHS provides ten food groups, and these are used in computing an HDD index; households which fall below the mean and median of 7 were regarded as having low dietary diversity.
A relative index of dwelling type was created and composed of variables that provide information about the nature and features of the dwelling. Based on the literature, assumptions were made about variables that would best describe formal versus informal dwelling, and we selected the following variables: the location of the toilet (whether in the dwelling or outside the dwelling); an indicator for crowding in the household; whether rooms in houses have multiple uses; wall, floor and roofing materials.
Principal Components Analysis (PCA) was used in combining these variables into a single index. The average value of the Kaiser-Meyer-Olkin (KMO) measure of sampling adequacy is 83%; the value for each variable included is above 50%; and the lowest individual value is 76%. The KMO results suggest a pattern of strong correlations among these variables and justifies the application of PCA in the index creation.
The final dwelling type index is categorised into three levels to reflect formal, semi-formal and informal dwellings. An example of a formal dwelling would be a brick house with tile or concrete roofing and polished wood or carpeted floors. The formal house will also have a toilet inside the dwelling, low overcrowding indicator and fewer rooms with multiple uses. An informal dwelling would have plastic or cardboard walls, plastic or cardboard roof, earth or dung floors with high numbers of people per room, toilet facility outside the dwelling and rooms performing multiple functions.
Finally, the income variable in the GHS survey is an imputed variable from some income sources such as rental incomes and grant incomes. Due to this nature, the variable records outliers with many zero income values. The outliers in the income variables are treated by replacing the bottom 1% with the value of the 5th percentiles and setting the top 1% to the 99th percentile. The selected treatment for outliers ensures that cases are maintained.
Data analysis
The relationships between the two measures of food insecurity (i.e. the dwelling type and other socioeconomic status variables) are explored using a binary regression model. More so, food insecurity index which is at three levels is reformulated as a binary indicator. This indicator variable takes the value of 0 as food insecure- the sum of inadequate and severely inadequate, while the value of 1 for the variable indicates adequate food security. Before the estimation of the two models, tables and charts were used to describe the data and provide a picture of the food insecurity situation, comparing and highlighting the differences between the two measures of access to food and dietary diversity. The data analysis further applies the sample weight to correct estimates of the national population levels.
Results and discussions
Description of survey
The final sample contains 12,361 urban households after generating all the variables of which approximately 60% were male headed and 40% female-headed. Population group distribution of the sample indicates that black Africans headed 77% of sampled households, 13% were headed by coloured, 3% by Indians and 8% by whites (Stats SA Citation2001). On average, a household consisted of 3 members with the largest household having 21 members and the smallest being a single person household.
The HFIAS indicated that 20% of the population was food insecure as measured by access. However, when food insecurity is measured using the dietary diversity score, this increases to 36%. The final distribution of the dwelling type variables is as follows: 33% of households lived in formal housing, 31% in semi-formal housing and 36% in informal housing.
The state and nature of food insecurity in urban South Africa
shows a summary of household characteristics by food security status and dwelling type. The average age of household head for food insecure households for both HFAIS and HDD indicators of food security is lower than that of food secure households. Household heads in informal dwellings are younger than those living in semi-formal and formal dwellings with average ages of 40, 47 and 48 years respectively. Mean incomes of food secure households measured by HFAIS and HDD are quite close at ZAR11,038.10 and ZAR11,536.81 respectively and are significantly higher than those of food insecure households which record means of ZAR4,342.53 and ZAR6,625.75. However, it is noted that mean incomes of food insecure households measured by HDD are quite high. The gradient of mean total incomes of households living in the various dwelling types was as expected with families in relatively more formal dwellings recording the highest mean incomes of ZAR 17,612.27. This is followed by those living in semi-formal dwellings who have a mean income of ZAR 7,771.36. Households in informal dwellings had the lowest mean incomes of ZAR 4,496.30.
Table 2. Summary of household characteristics by food security status and dwelling type (n = 12,361).
The average family size of people living in formal and informal dwellings was 3 persons, with semi-formal dwelling having an average of 4 members. When measured by both HFAIS and HDD food insecurity, there was a consistent racial pattern. Using race of head of households as a proxy measure of household’s population group, households headed by blacks and coloureds recorded highest levels of food insecurity of 21.20% and 22.25% for the HFAIS scale and 40.29% and 28.29% for the HDD measure respectively. However, as indicated by the figures presented, while coloured households record a higher level based on the access measure, the dietary diversity measure suggests that black families have less diverse diets. Indian and white families had relatively low food insecurity scores with Indian families having more varied diets than white families (See for details). An access based measure of food insecurity shows that female-headed homes are less food secure however this is reversed when we examine dietary diversity, which indicates that female-headed homes have relatively more diverse diets. There was a little variation in the average number of people employed in households by food security status or dwelling type with an average of 1 member employed in each home. Homes with children had food insecurity levels of 22.36% and 32.85% for HFAIS and HDD indicators respectively.
presents percentages of households in each dwelling type considered as food insecure using HDD and HFIAS. The results show that households living in formal dwellings recorded lower levels of food insecurity irrespective of the measure applied. For example, 19%, 35% and 50% of formal, semi-formal and informal households respectively are considered as food insecure when measured by the HDD. This compares with 7%, 19% and 27% for formal, semi-formal and informal households respectively considered as food insecure when measured by HFIAS.
Figure 1. Percentage of household classified as food insecure using HDD and HFIAS computed by authors using data from the 2017 General Household Survey.
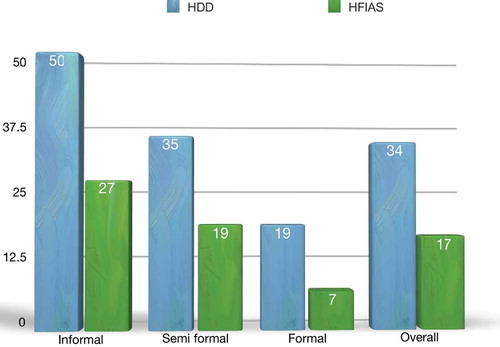
The analysis shows that significantly larger shares of households are food insecure when measured by HDD as compared to an HFIAS measure of food insecurity. Dietary diversity measures of food insecurity are associated with micronutrient deficiencies, as limited or constrained diets are potentially nutrient poor.
presents the results of two binary logistic regressions for Household Food Insecurity Access Score (HFIAS) and Household Dietary Diversity (HDD) indicators and household characteristics respectively. The two models show considerable similarities as they both examine food insecurity. However, on specific outputs, the HFIAS and the HDD indicators show significant uniqueness (these will be discussed in detail in the discussion section of the paper).
Table 3. Logistic regression results for Household Food Insecurity Access Score (HFIAS) and Household Dietary Diversity (HDD) indicators both coded as 1 for food secure and 0 otherwise and household characteristics (n = 10,345).
The following variables: total income, dwelling type, low-income housing, race, age of household head, gender of household head, number of employed people in household engaging in subsistence agriculture, level of education of head of household were significant in both models with specific differences in coefficient and significance levels. The variable showing whether or not any member of the household received a government grant was not significant in both models. Household size was significant for the HFIAS model but not the HDD model and having at least one child household member was significant for the HDD model but not the HFIAS model.
For many urban dwellers, the market is the primary source of food for their families, making income an essential factor for safeguarding the food security status of their families. Income was found to be significant in both the HFIAS and the HDD models suggesting that income is essential for both the access measure of food insecurity and the dietary diversity measure. The odds ratio of [OR: .78, 95% CI: .74-.81] and [OR: .89, 95% CI: .85-.92] respectively for the HFIAS and the HDD models show that people with higher incomes are less likely to be food insecure.
Whether measured by access or by dietary diversity, the more formal the dwelling type, the lower the likelihood of being food insecure. For example, compared with the reference group of informal dwelling, the formal dwelling had odds of [OR: .37, 95% CI: .31-.45] and [OR: .43, 95% CI: .38-.49] for the HFIAS and the HDD indicators of food insecurity respectively.
The low-income housing variable is statistically significant with odds of [OR: 1.42, 95% CI: 1.25–1.60] and [OR: 1.32, 95% CI: 1.18–1.47] respectively for the access based and dietary diversity measures of food insecurity.
The age of the household head was positively and significantly associated with food security status using both HFIAS and HDD indicators. This variable affects households’ food insecurity status positively and significantly at 5% probability level in the study area. The nature of the relationship also shows that older household heads have a higher chance to be food insecure than younger ones.
Employed members of the household have a positive and significant at 1% probability level in the study area. Similar to the finding on incomes, it implies that having an employed member, improves households’ food security status.
A critical finding was the significant relationship between subsistence agriculture and both measures of food security which shows that engaging in subsistence agriculture not only enhances the household’s access to food but also improves dietary diversity.
The education level of the household head showed a significant positive relationship with both HFIAS and HDD indicators indicating that the more educated the household head is, the less likely the household is to be food insecure.
Compared to male-headed households, female-headed households are less likely to be food secure households when measured by access. However, this relationship flips when food security is measured by dietary diversity. Using the HDD measures suggest that female-headed households are more likely to have a more diverse diet. When food security is measured by access, all racial groups except for the coloured population are more likely to be food secure than the black group which was the reference group. However, the coloured population is slightly better off than the black African population when measured using the HDD.
Household size affects household food insecurity status. However, our analysis suggests that when food security is measured by dietary diversity, household size ceases to be important. Increasing household size is only significant with an access based measure of food insecurity.
Discussions
Despite the large proportion of South African households being food insecure, studies (e.g. Hendriks Citation2005; Altman et al. Citation2009; Hendriks Citation2013) more than a decade apart indicate that there is little certainty about the exact form, nature and reasons for the high levels of food insecurity and malnutrition; especially in children. This study, therefore, sheds light on the situation at the household level by applying two measures of food insecurity (i.e. HFIAS and HDD and their relationship with a dwelling type in urban areas). The results showed that the patterns of food insecurity remain consistent for both measures, as gender, racial and other socioeconomic factors were consistently shown to be associated with both the HFIAS and HDD indicators. There was also some uniqueness in these two measures which was anticipated as the HDD has been shown to provide a more qualitative measure of food insecurity than HFIAS (Hoddinott and Yohannes Citation2002; Steyn et al. Citation2006).
Similar to the outcomes of other studies on food insecurity in South Africa (Aliber Citation2003; Baiphethi and Jacobs Citation2009; Hendriks Citation2013), all socioeconomic factors showed a consistent relationship with both measures of food insecurity. Both incomes and employment proved to be necessary for food security confirming the importance of the ability to purchase food by urban dwellers. A significant source of food for all households in South Africa is the market (Baiphethi and Jacobs Citation2009). However, increasing food prices (Stats Citation2016) means that the dependence on the market could further push families into food insecurity. Since 2015, food prices have been trending upwards with an average food price increase of 8.7% between December 2014 and December 2015 (Stats Citation2016). This was further compounded by droughts across the country. Using both measures, the results also suggest that urban households engaging in subsistence farming are crucial in safeguarding food security, thus highlighting the importance of household food production for meeting food and dietary needs. Baiphethi and Jacobs (Citation2009) indicate that subsistence production has the potential to provide up to 90% of food consumed. However, many urban dwellers are often unable to engage in subsistence food production due to lack of access to land and water. It is therefore not surprising that urban residents in informal dwellings, those who are most unlikely to have access to land and afford water for subsistence agriculture record the highest levels of food insecurity (De Bon et al. Citation2009; Crush and Frayne Citation2011; Crush et al. Citation2011; Cook et al. Citation2015).
More so, the study suggests that in South Africa, the type of housing is significant for food insecurity as the less formal the dwelling (defined by the kind of building material), the higher the likelihood of experiencing food insecurity.
The Reconstruction and Development Programme (RDP) was a national intervention programme aimed at responding to the high levels of poverty and access to housing. The programme provided low-cost housing, essential services, education, and health care to low-income families. The housing component of the RDP was taken up by the National Department of Housing after it was discontinued, and they still provide subsided housing. We use a variable to capture all forms of subsidized housing for low incomes families including RDP housing. Due to the nature of the housing programmes, these houses are generally categorized as semi-formal based on the dwelling type index. However, the socioeconomic profile of households in these dwellings means that we anticipate that the recipients of these houses are more likely to be food insecure and this is confirmed by the results of this study.
Poverty and many measures of vulnerability are gendered, and many studies have confirmed that females and female-headed households are more likely to be food insecure than male-headed households (World Bank Citation2001; Odame et al. Citation2002; Thorne-Lyman et al. Citation2010). Often, the reasons for the disadvantaged position of female-headed households on the issue of food insecurity relates to the broader socioeconomic structure and the continued disadvantages faced by women in governance, economic systems and the labour market. However, while this relationship was confirmed when food insecurity was measured using the HFIAS indicator, the HDD indicators suggest that female-headed households were better off. The explanation for this may lie in the nature of the variables. While women are indeed a vulnerable group, evidence indicates that female-headed households devote higher proportions of household resources to basic needs. For example, female-headed homes ensure that children are not disadvantaged (Chant Citation2007; Ochieng et al. Citation2017). Indeed, studies highlight that when economic power is given to women in the form of control of expenditure or income there is a more significant benefit in terms of enhanced nutrition in homes (Handa Citation1996; Lorge Rogers Citation1996; van Den Bold et al. Citation2013). Using both measures of food security, households with better educated heads were also more likely to be food secure than those without. This result parallels other studies in other countries, which provide explanations of the ability of educated heads to use nutritional knowledge (Ochieng et al. Citation2017). Others propose the better living conditions in households with educated heads as a result of higher income generation capacity through diversification of incomes, competency and use of technology as an explanatory factor (Sisay and Edriss Citation2012).
Another variable that showed differences in association with the HFIAS and the HDD indicators was the household size. With an average household size of 3 persons and approximately only 1 person being employed in 50% of households, having larger households leads to pressure on limited resources which reflects in an increased probability of being food insecure. This is so when food security is measured using the HFIAS indicator and this finding resonates with other studies (e.g. Sisay and Edriss Citation2012; Powell et al. Citation2017). However, household size had no association with the HDD indicator.
Furthermore, race in South Africa is a good indicator of socioeconomic status, and several studies have shown that the black African population group records the highest prevalence of food insecurity (Shisana et al. Citation2013; Stats Citation2015; Stats SA Citation2019). The pattern of race and food insecurity in South Africa mirrors poverty measures as the previously disadvantaged groups of black African and coloured races continue to remain vulnerable. This is confirmed in the analysis for both indicators signifying that these two groups remain most likely to be food insecure. While the black African group recorded the lowest levels of dietary diversity, the coloured group was the most disadvantaged when food insecurity was measured using the HFIAS.
Conclusion and recommendations
The study concludes that redefining the problem of food insecurity to adequately capture the urban challenge is essential as a large and growing share of the national population currently reside in urban areas. While urban dwellers continue to rely on the market to meet their food needs, the results of this study highlight the importance of subsistence agricultural production even in urban areas for reducing food insecurity and improving dietary diversity. Strategies to reduce malnutrition and enhance household food security should also include targets for home food production. The importance of the dwelling type variable implies that the broad categorisation of geographic areas into urban formal, traditional regions and farms may potentially fail to capture the specificity of the urban challenge of food insecurity.
The general pattern of the associations for several socioeconomic variables with the two food insecurity measures used is consistent with existing literature. These results thus call for continued attention to the poor, black and coloured racial groups and a focus on job creation. Equally important are unique outcomes that showed that economic empowerment of women is essential in reaching a diverse diet and fighting malnutrition. Differences in the results for the two measures of food insecurity affirms that an adequate understanding of the food insecurity challenge in South Africa will only be reached with a comprehensive measurement of food insecurity which captures both the quantity and quality dimensions. The findings also support existing research on the heightened threat to food security in informal urban areas.
Several policies exist that address the challenge of food insecurity in urban areas and should be further leveraged. The Child Support Grant (CSG) is already available to over two-thirds of all children in the country (Delany et al. Citation2016) and many urban children benefit from School Feeding programs. Our findings show that these programmes are important for ensuring the food security of households and their children. The association of both measures of food insecurity with income and employment point to the importance of programmes such as the Community Works Programme and the Expanded Public Works Programme in ensuring food security in urban areas. Also, the results point to the need to strengthen programmes of the National Department of Agriculture, Forestry and Fisheries (DAFF) such as the food garden projects that target both rural and urban food security by supporting urban agriculture, community food projects, household food production, new gardens and rehabilitating abandoned projects. The national policy on food and nutrition security strives on five pillars including food assistance, nutrition education, local economic development, market participation and risk management (Department of Social Development and Fisheries, D. of A. F. and Citation2013). It is thus crucial to ensure linkages and synergies between these and other programmes so that they are appropriately leveraged.
Consent for publication
Not applicable.
Acknowledgements
The authors would like to thank the DST-NRF Centre of Excellence in Food Security Grant UID: 91490, Statistics South Africa and Datafirst.
Disclosure statement
No potential conflict of interest was reported by the authors.
Additional information
Funding
Notes on contributors
Coretta M. P. Jonah
Coretta M.P. Jonah, PhD is a Researcher with the Persistence of Child Malnutrition in South Africa of the DST-NRF Centre of Excellence in Food Security at the University of the Western Cape. She is an economist with expertise in public policy analysis, human development, poverty and inequality and development advisory. She is currently working on the contemporary development challenge of food and Nutrition Security, focusing on maternal and child health and nutrition. Email: [email protected]
Julian D. May
Julian D. May, PhD is the Principal Investigator for the Persistence of Child Malnutrition in South Africa of the DST-NRF Centre of Excellence in Food Security at the University of the Western Cape. An expert in Applied Poverty Reduction Assessment, Professor May has worked on options for poverty reduction including land reform, social grants, information technology and urban agriculture in Africa and the Indian Ocean Islands. He is also the Director of the DST-NRF Centre of Excellence in Food Security. Email: Julian May [email protected]
Notes
1. Statistics South Africa defines this as a group with common characteristics (in terms of descent and history), particularly in relation to how they were (or would have been) classified before the 1994 elections. The following categories are provided in the census: black African, coloured, Indian or Asian, white, other. Definition is available here: http://www.statssa.gov.za/census/census_2001/concepts_definitions/concepts_definitions.pdf.
References
- Afriyie K, Abass K, Adomako JAA. 2014. ‘Urbanisation of the rural landscape: Assessing the effects in peri-urban Kumasi’, Int J Urban Sustainable Dev. 6(1):1–19. doi: 10.1080/19463138.2013.799068.
- Aliber M. 2003. Chronic poverty in South Africa: incidence, causes and policies. World Dev. 31(3):473–490. doi:10.1016/S0305-750X(02)00219-X.
- Alkon A, Block D, Moore K, Gillis C, DiNuccio N, Chavez N. 2013. Foodways of the urban poor. Geoforum Pergamon. 48:126–135. doi:10.1016/J.GEOFORUM.2013.04.021.
- Altman M, Hart T, Jacobs P. 2009. ‘Household food security status in South Africa’, Agrekon. (Accessed 2014 Oct 24). Available at: http://www.tandfonline.com/doi/abs/10.1080/03031853.2009.9523831.
- Arene CJ, AnyaejiM RC. 2010. ‘Determinants of Food Security among Households in Nsukka Metropolis of Enugu State, Nigeria’, Pak J Soc Sci. 30(1):9–16.
- Baiphethi M, Jacobs P. 2009. ‘The contribution of subsistence farming to food security in South Africa’, Agrekon. (Accessed 2014 Oct 24). Available at: http://reference.sabinet.co.za/sa_epublication_article/agrekon_v48_n4_a6.
- Battersby J. 2012. Urban food security and the urban food policy gap. 11. Kingston and Cape Town. Available at: [Accessed 2014 Oct 24]. http://www.mandelainitiative.org.za/images/docs/2012/papers/18_Battersby_Urban food security and urban food policy gap.pdf.
- Bhattacharya J, Currie J, Haider S. 2004. Poverty, food insecurity, and nutritional outcomes in children and adults. J Health Econ. 23(4):839–862. doi:10.1016/j.jhealeco.2003.12.008.
- Burchi F, De Muro P. 2016. From food availability to nutritional capabilities: advancing food security analysis. Food Policy. doi:10.1016/j.foodpol.2015.03.008.
- Burns C. 2004. ‘A review of the literature describing the link between poverty, food insecurity and obesity with specific reference to Australia’, Melbourne: Victorian Health Promotion …. (Accessed 2014 Oct 30) Available at: http://secure.secondbite.org/sites/default/files/A_review_of_the_literature_describing_the_link_between_poverty_food_insecurity_and_obesity_w.pdf.
- Chant S. 2007. Children in female-headed households: interrogating the concept of an ‘inter-generational transmission of disadvantage’ with particular reference to the gambia, Philippines and Costa Rica. (Accessed 2018 Dec 14). Available at: http://www.lse.ac.uk/collections/GenderInstitute.
- Coates J, Swindale A, Bilinsky P. 2007. Household Food Insecurity Access Scale (HFIAS) for measurement of Food Access: Indicator Guide. Food and Nutrition Technical Assitance (FANTA) project. Washington DC: United States Agency for International Development.
- Cohen MJ, Garrett JL. 2010. The food price crisis and urban food (in)security. Environ Urban. 22(2):467–482. doi:10.1177/0956247810380375.
- Cook J, Oviatt K, Main DS, Kaur H, Brett J. 2015. Re-conceptualizing urban agriculture: an exploration of farming along the banks of the Yamuna River in Delhi, India. Agric Human Values. doi:10.1007/s10460-014-9545-z.
- Crush J, Hovorka A, Tevera D. 2011. Food security in Southern African cities: the place of urban agriculture. Prog Dev Stud. 11:285–305. doi:10.1177/146499341001100402.
- Crush JS, Frayne GB. 2011. Urban food insecurity and the new international food security agenda. Dev South Afr. 28:527–544. doi:10.1080/0376835X.2011.605571.
- De Bon H, Parrot L, Moustier P. 2009. Sustainable urban agriculture in developing countries: A review. Sustain Agr. doi:10.1007/978-90-481-2666-8_38.
- Delany A, Grinspun A, Nyokangi E. 2016. Why consider children and social assistance? (Accessed 2018 Apr 18) Available at: http://www.ci.uct.ac.za/sites/default/files/image_tool/images/367/Child_Gauge/2006/Child_Gauge_2016-children_social_assistance_introduction.pdf. Accessed 18 April 2018.
- Department of Social Development and Department of Agriculture Forestry and Fisheries. 2013. National Policy on Food and Nutrition Security. Pretoria. (Accessed 2018 Jan 14) Available at: https://www.nda.agric.za/docs/media/NATIONALPOLICYonfoodandnutriritionsecurity.pdf.
- Du Toit D, Ramonyai MD, Lubbe P. 2011. Food Security. Pretoria. (Accessed 2018 Dec 15). Available at: http://www.nda.agric.za/docs/genreports/foodsecurity.pdf.
- Eicher C., KStaatz J. M, 1985. ‘Food Security Policy in Sub-Saharan Africa’, Food Security Policy, pp. 215–229
- FAO. 2008. ‘Deriving food security information from national household budget surveys’, Deriving food security information from, p. 186. (Accessed 2017 Jul 6). Available at: https://flore.unifi.it/retrieve/handle/2158/395332/13821/Sibrian 2008.pdf#page=19.
- FAO. 2011. Food agriculture and cities: challenges of food and nutrition security, agriculture and ecosystem management in an urbanizing world –food for the cities multi-disciplinary initiative., FAO, Rome, Italy. (Accessed 2014 Oct 25) Available at: http://www.fao.org/fileadmin/templates/FCIT/PDF/FoodAgriCities_Oct2011.pdf.
- FAO, WFP and IFAD. 2012. The state of food insecurity in the world: economic growth is necessary but not sufficient to accelerate reduction of hunger and malnutrition. Rome. (Accessed 2014 Oct 30) Available at: http://www.fao.org/3/a-i3027e.pdf.
- FSIN. 2018. Global report on food crises 2018, World Food Programme. Available at: https://docs.wfp.org/api/documents/WFP-0000069227/download/?_ga=2.173913956.657215195.1542509882-311049899.1542509882.
- Güneralp B, Lwasa S, Masundire H, Parnell S and Seto KC. 2017. Urbanization in Africa: challenges and opportunities for conservation. Environmental Research Letters. IOP Publishing, 13(1), p. 15002. doi: 10.1088/1748-9326/aa94fe.
- Handa S. 1996. Expenditure behavior and children’s welfare: an analysis of female headed households in Jamaica. Journal of Development Economics. North-Holland. 50(1):165–187. doi:10.1016/0304-3878(96)00008-9.
- Headey D, Fan S. 2008. Anatomy of a crisis: the causes and consequences of surging food prices. Agr Econ. 39:375–391. doi:10.1111/j.1574-0862.2008.00345.x.
- Hendriks S. 2013. FOOD SECURITY IN SOUTH AFRICA: STATUS QUO AND POLICY IMPERATIVES AEASA presidential address 1 October 2013, Bela Bela Sheryl Hendriks 1. (Accessed 2018 Dec 14). Available at: https://repository.up.ac.za/bitstream/handle/2263/40789/Hendriks_Food_2014.pdf?sequence=1.
- Hendriks SL. 2005. The challenges facing empirical estimation of household food (in)security in South Africa. Dev South Afr. 22(1):103–123. doi:10.1080/03768350500044651.
- Hoddinott J, Yohannes Y. 2002. Dietary diversity as a food security indicator. Food Consumption Nutr Div. 136:1–94. doi:10.1016/S0306-9192(99)00035-4.
- Ivanic M, Martin W, Zaman H. 2011. Estimating the short-run poverty impacts of the 2010–11 surge in food prices. The World Bank ( Policy Research Working Papers). doi: 10.1596/1813-9450-5633.
- Jones AD, Ngure FM, Pelto G, Young SL. 2013. What are we assessing when we measure food security? A compendium and review of current metrics. Adv Nutr. doi:10.3945/an.113.004119.
- Kennedy GL, Ballard T, Dop M. 2010. Guidelines for measuring household and individual dietary diversity.Nutrition and consumer protection division, FAO. Nutr Consum Prot Div. doi:613.2KEN.
- Klein B. 1996. ‘Food security and hunger measures: promising future for state and local household surveys’, Family economics and nutrition review/(USA). (Accessed 2014 Oct 30). Available at: http://agris.fao.org/agris-search/search.do?recordID=US1997076328.
- Koc M, Welsh J. 2001. ‘Food, foodways and immigrant experience’, Toronto: Centre for Studies in Food …. (Accessed 2014 Nov 24). Available at: http://canada.metropolis.net/EVENTS/ethnocultural/publications/aliments_e.pdf.
- Koch J. 2011. ‘The food security policy context in South Africa’. (Accessed 2014 Oct 24). Available at: http://www.econstor.eu/handle/10419/71767
- Lorge Rogers B. 1996. The implications of female household headship for food consumption and nutritional status in the dominican republic, world development. (Accessed 2018 Dec 14). Available at: https://ac.els-cdn.com/0305750X9500122S/1-s2.0-0305750X9500122S-main.pdf?_tid=17e30a0a-984d-4875-92ff-54607cc95f2f&acdnat=1544801483_243f771d5ee852d777646ec73ae59e6e.
- Ma CT, Gee L, Kushel MB. 2008. Associations between housing instability and food insecurity with health care access in low-income children. Ambulatory Pediatr. 8:50–57. doi:10.1016/j.ambp.2007.08.004.
- Malik K. 2013. ‘Human development report 2013. The rise of the South: Human progress in a diverse world.’ New York New York UNDP 2013.
- Maxwell S, Smith M. 1992. Household food security: a conceptual review. Food Security: concepts, indicators, measurements …. (Accessed 2014 Oct 29). Available at: http://www.ifad.org/hfs/tools/hfs/hfspub/hfs_1.pdf.
- Ochieng J, Afari-Sefa V, Lukumay PJ, Dubois T, van Wouwe JP. 2017. Determinants of dietary diversity and the potential role of men in improving household nutrition in Tanzania. PLoS One. Edited by J. P. van Wouwe. Public Library of Science. 12(12):e0189022. doi:10.1371/journal.pone.0189022.
- Odame H, Hafkin N, Wesseler G, Boto I. 2002. Gender and agriculture in the information society. 55. ISNAR. (Accessed 2018 Dec 14). Available at: http://ebrary.ifpri.org/cdm/ref/collection/p15738coll11/id/298.
- Omemu AM, Aderoju ST. 2008. Food safety knowledge and practices of street food vendors in the city of Abeokuta, Nigeria. Food Control. Elsevier. 19(4):396–402. doi:10.1016/J.FOODCONT.2007.04.021.
- Peyton S, Moseley W, Battersby J. 2015. Implications of supermarket expansion on urban food security in Cape Town, South Africa. African Geographical Review. 34(1):36–54. doi:10.1080/19376812.2014.1003307.
- Pothukuchi K, Kaufman JL. 1999. Placing the food system on the urban agenda: the role of municipal institutions in food systems planning. Agric Human Values. 16:213–224. doi:10.1023/A:1007558805953.
- Powell B, Kerr RB, Young SL, Johns T. 2017. The determinants of dietary diversity and nutrition: ethnonutrition knowledge of local people in the East Usambara Mountains, Tanzania. J Ethnobiol Ethnomedi BioMed Cent. 13(1):23. doi:10.1186/s13002-017-0150-2.
- Rheinländer T, Olsen M, Bakang JA, Takyi H, Konradsen F, Samuelsen H. 2008. Keeping Up Appearances: perceptions of Street Food Safety in Urban Kumasi, Ghana. J Urban Health. Springer US. 85(6):952–964. doi:10.1007/s11524-008-9318-3.
- Shisana O, Labadarios D, Rehle T, Simbayi L, Zuma K, Dhansay A, Reddy P, Parker W, Hoosain E, Naidoo P, et al. 2013. The South African national health and nutrition examination survey. Cape Town: Human Sciences Research Council (HSRC) Press. Accessed 2018 May 15. Available at http://www.hsrc.ac.za/en/research-outputs/view/6493
- Silva MR, Kleinert WL, Sheppard AV, Cantrell KA, Freeman-Coppadge DJ, Tsoy E, Roberts T, Pearrow M. 2017. The relationship between food security, housing stability, and school performance among college students in an urban university. J Coll Stud Retention: Res Theory Pract. doi:10.1177/1521025115621918.
- Sisay E, Edriss A-K 2012. Determinants of food insecurity in addis ababa city, ethiopia, journal of economics and sustainable development www.iiste.org ISSN. Online. (Accessed 2018 Dec 14). . Available at: www.iiste.org.
- Staatz J, D’Agostino V, Sundberg S. 1990. Measuring food security in africa: conceptual, empirical, and policy issues. Am J Agric Econ. 72(5):1311–1317. doi:10.2307/1242553.
- Stats SA. 2001. Stats SA census 2001 concepts and definitions. Pretoria. (Accessed 2019 Aug 15). Available at: http://www.statssa.gov.za/census/census_2001/concepts_definitions/concepts_definitions.pdf
- Stats SA. 2017. Poverty trends in South Africa: An examination of absolute poverty between 2006 and 2015. Pretoria. (Accessed 2019 Jul 15). Available at: http://www.statssa.gov.za/publications/Report-03-10-06/Report-03-10-062015.pdf
- Stats SA. 2018. General household survey, 2016. Pretoria. (Accessed 2019 Jan 15). Available at: https://www.statssa.gov.za/publications/P0318/P03182016.pdf
- Stats SA. 2019. General household survey 2017. Pretoria. (Accessed 2019 Jun 12). Available at: http://rodra.co.za/images/countries/south_africa/research/P03182017%20household%20survey%20stats%20sa.pdf
- Stats SA 2014. Poverty trends in South Africa, Press statements. (Accessed 2019 Jun 10). Available at: http://www.statssa.gov.za/?p=2591.
- Stats SA 2015. General household survey 2014. Pretoria. Available at: http://www.statssa.gov.za/publications/P0318/P03182014.pdf.
- Stats SA 2016. Consumer price index march 2016. P0141. Pretoria.
- Steyn NP, Nel JH, Nantel G, Kennedy G, Labadarios D. 2006. Food variety and dietary diversity scores in children: are they good indicators of dietary adequacy? BioMed Cent. 9(05):1064–1069. doi:10.1079/PHN2005912.
- Swindale A, Bilinsky P. 2006. Household Dietary Diversity Score (HDDS) for measurement of household food access: indicator guide. Food Nutr Tech Ass. doi:10.1017/CBO9781107415324.004.
- Szabo S. 2016. Urbanisation and food insecurity risks: assessing the role of human development. Oxf Dev Stud. Routledge. 44(1):28–48. doi:10.1080/13600818.2015.1067292.
- Tacoli C, McGranahan G, Satterthwaite D. 2015. Urbanisation, rural–urban migration and urban poverty, Background Paper for World Migration Report 2015. Migrants and Cities: New Urban Partnerships to Manage Mobility.
- Thorne-Lyman AL, Valpiani N, Sun K, Semba RD, Klotz CL, Kraemer K, Akhter N, de Pee S, Moench-Pfanner R, Sari M, et al. 2010. Household dietary diversity and food expenditures are closely linked in rural Bangladesh, increasing the risk of malnutrition due to the financial crisis. J Nutr. doi:10.3945/jn.109.110809.
- van Den Bold M, Quisumbing AR, Gillespie S. 2013. Women’s empowerment and nutrition: an evidence review. Ssrn. October. doi:10.2139/ssrn.2343160.
- von Grebmer K, Saltzman A, Birol E, Wiesmann D, Prasai N, Yin S, Yohannes Y, Menon P, Thompson J, and Sonntag A. 2014. 2014 Global Hunger Index: The Challenge of Hidden Hunger. Bonn, Washington, D.C., and Dublin: Welthungerhilfe, International Food Policy Research Institute, and Concern Worldwide. http://dx.doi.org/10.2499/9780896299580
- World Bank. 2001. Engendering development through gender equality in rights, resources, and voice (Policy and Research Working Paper No. 21776). Washington (DC): World Bank., World Bank. doi: 10.1149/2.0751412jes.
- www.statista.com 2018. • South Africa - urbanization 2007–2017 | statistic. (Accessed 2018 Dec 15). Available at: https://www.statista.com/statistics/455931/urbanization-in-south-africa/.
- Zezza A, Tasciotti L. 2010. Urban agriculture, poverty, and food security: empirical evidence from a sample of developing countries. Food Policy. 35:265–273. doi:10.1016/j.foodpol.2010.04.007.