
ABSTRACT
Municipal Authorities (Assemblies) in Ghana have been unable to generate adequate revenue to effectively manage sanitation. To address this challenge, the Akuapem North and Ga West Municipalities have recently introduced a sanitation surcharge, which is collected through property rates. Using a mixed-method approach, this paper assesses the attitudes of policymakers and taxpayers towards the policy and the implications for its effective implementation. Qualitative data were collected through interviews with officials of the Municipal Assemblies while quantitative data were collected through a survey of 832 randomly selected property owners. The study revealed that policymakers’ de jure acceptance of the policy has not translated into de facto implementation. Although most taxpayers support the policy, a significant minority of them oppose it due to lack of trust in the Assemblies. Therefore, the Assemblies need to devise effective communication strategies, and enhance transparency in the use of revenue collected through the surcharge.
Introduction
Ghana, like the rest of Sub-Saharan Africa, has urbanised rapidly over the last few decades. According to census data, the urban share of the country’s population increased from 23% in 1960 to 32% in 1984, 44% in 2000 and about 51% in 2010 (GSS Citation2013). The data also show that, on average, the absolute urban population grew at over 4% per annum between 1960 and 2010. If this trend continues, the country’s urban population is projected to be 18,715,282, or 59.1% of the total population, in 2020.
Although urbanisation creates opportunities for economic development, it also brings challenges. Over the past decade, a significant proportion of Africa’s urban population has been living in extreme poverty, which is characterised in part by inadequate access to safe water and sanitation services (see Boadi et al. Citation2005; Gulyani et al. Citation2005; Komives et al. Citation2005; WHO/UNICEF Citation2013; Cobbinah et al. Citation2015). In Ghana, and indeed the rest of Africa, urbanisation has resulted in significant deficits in the provision of key infrastructure such as water, sewerage systems, and sanitation facilities in cities and towns (Oduro et al. Citation2014). For instance, in 2018, 56% of Ghana’s urban population used improved sanitation facilities that were shared with other households while 19% either relied on unimproved facilities or practiced open defaecation (GSS Citation2018).
Since 1988, Ghana has implemented a comprehensive decentralisation policy that resulted in the establishment of metropolitan, municipal and district assemblies (MMDAs), which are charged with the responsibility of providing sanitation and other services in their respective jurisdictions. The Ministry of Sanitation and Water Resources (MSWR), created in 2017, is responsible for formulating sanitation policies to guide the MMDAs in planning and implementing sanitation improvement programmes and projects. The main sources of funds for the MMDAs to provide sanitation services include: the District Assemblies Common Fund (DACF) and other central government transfers; their own Internally Generated Funds (IGFs); and donor support, which is usually channelled through specific programmes and projects. Despite the existence of these funding sources, the MMDAs have not been able to mobilise adequate resources to effectively deal with sanitation, especially in urban centres (see Owusu Citation2010; Peprah et al. Citation2015). For instance, in Awutu Senya East Municipality, one of the fastest-growing municipalities located close to the city of Accra, about 62% of households resort to burning or burying their domestic solid waste, dumping it in public open spaces, dumping it indiscriminately, or using other unhealthy waste disposal methods (GSS Citation2014). They use these methods because they do not have access to improved services such as house-to-house collection or dumping in publicly provided central waste containers. To address this challenge, some MMDAs are looking for innovative ways of generating additional revenue to finance sanitation services. (For the purpose of this paper, sanitation refers broadly to environmental sanitation, which has been defined in the next section.) One such innovation is a sanitation surcharge, which is currently being implemented in the Akuapem North Municipality in the Eastern Region and Ga West Municipality in the Greater Accra Region.
Since 2013, the Akuapem North Municipal Assembly has imposed an annual flat levy of GHS 5.00 on property owners, which is included in property rate bills as a sanitation surcharge. Similarly, with support from Water & Sanitation for the Urban Poor (WSUP), the Ga West Municipal Assembly in 2017 began to impose an annual sanitation surcharge amounting to 10% of the property rate. Although the two municipalities adopted the policy independently, the aim of both initiatives is to generate additional revenue to supplement existing sources of funding for improved sanitation service delivery.
Although sanitation surcharge policies already exist in several African countries (see WSP Citation2004; WSUP Citation2012), little is known about their effectiveness in financing urban sanitation in Ghana. However, effectiveness of public policies can be largely dependent on the attitudes of key stakeholders. For instance, a sense of ownership, acceptance and attitudes among members of the target community (the public) are essential ingredients for the success of public policies (see Brynard Citation2009; Taweekaew Citation2014). On the part of public officials who formulate and implement public policies, factors such as commitment, cooperation and other attitudinal predispositions are also known to influence the design, implementation and effectiveness of public policies (see Brynard Citation2009; Ugwuanyi and Chukwuemeka Citation2013; Ahmed and Dantata Citation2016). Therefore, understanding the attitudes of key stakeholders towards the sanitation surcharge policy in Akuapem North and Ga West Municipalities is critical if it is to be successfully implemented in those municipalities and possibly replicated in other jurisdictions. It is against this backdrop that this research sought to assess the attitudes of two important categories of stakeholders – policymakers and taxpayers – towards the sanitation surcharge policy and its implementation to date in the two municipalities.
Policymakers here include the elected and appointed members of the Assemblies who have the ultimate political responsibility to make decisions for overall development of the municipalities, as well as technocrats who advise and implement the developmental decisions of the political class (the Assembly). In both Akuapem North and Ga West Municipalities, the sanitation surcharge policy was approved by the Assembly, and the technocrats were expected to manage its implementation. Because the sanitation surcharge in both municipalities is collected via the property rate, the term ‘taxpayer’ is used here to refer to owners of rateable, landed properties (buildings). They are key because their acceptance of the surcharge and their willingness (and actual ability) to pay it can make or unmake the sanitation surcharge policy.
Overview of key concepts
Sanitation
In 2007, readers of the British Medical Journal (BMJ) chose the sanitation revolution as the most important medical milestone since 1840 (Ferriman Citation2007 cited in Mara et al. Citation2010). This revolution in sanitation has been transformational in the developed world, but in the developing world, access to improved sanitation has not been widely achieved (Schertenleib Citation2005). It was for this reason that the United Nations, as part of the Millennium Development Goals (MDGs), set a target to halve the proportion of the world’s population without safe drinking water and basic sanitation between 1990 and 2015. However, while the water component of the target was achieved, the sanitation part was not. As of 2015, the proportion of the global population that used improved sanitation facilities was only 68%, which was nine percentage points behind the MDG target of 77% (WHO/UNICEF Citation2015); and indeed, we could query whether 68% of people genuinely have sanitation of acceptable quality. The worst situation was in sub-Saharan Africa where only 30% of the population was said to have access to some form of improved sanitation (WHO/UNICEF Citation2015). Accordingly, Goal 6 of the Sustainable Development Goals (SDGs) seeks to ‘ensure availability and sustainable management of water and sanitation for all’ by the year 2030 (UN Citation2017). Sanitation has gained such global attention as it contributes significantly to health, productivity and general wellbeing (see Huuhtanen and Laukkanen Citation2009; Mara et al. Citation2010; Mills and Cumming Citation2016). But, what is sanitation?
Various scholars, development practitioners and organisations have used the term sanitation to mean different things in different contexts. Some define sanitation narrowly as the safe management of faecal matter (e.g. Eawag/Sandec Citation2008; Huuhtanen and Laukkanen Citation2009; Lipson et al. Citation2010; Mara et al. Citation2010). For instance, Lipson et al. (Citation2010, p. 1) define it as ‘improvements which provide public or household faecal disposal facilities, and/or improve community faecal disposal and treatment methods’. It includes both the facilities and institutional/managerial arrangements put in place to ensure hygienic defaecation, as well as the disposal or treatment of excreta in such a manner that it does not adversely affect human health.
Others define sanitation more broadly by emphasising environmental sanitation and thereby incorporating other elements of a healthy environment in addition to faecal matter management. For instance, according to the National Sanitation Foundation (USA), ‘sanitation is a way of life that is expressed in the clean home, the clean farm, the clean business and industry, the clean neighbourhood, the clean community’ (Park Citation2005, p. 143). UNICEF (Citation1997) defines it as ‘a process whereby people demand, effect, and sustain a hygienic and healthy environment for themselves by erecting barriers to prevent the transmission of disease agents’ (p. 2). Ghana’s Environmental Sanitation Policy (ESP), which is informed by this perspective, lists the following as the principal components of environmental sanitation:
Collection and sanitary disposal of wastes, including solid wastes, liquid wastes, excreta, industrial wastes, health-care and other hazardous wastes;
Storm-water drainage;
Cleansing of thoroughfares, markets and other public spaces;
Control of pests and vectors of disease;
Food hygiene;
Environmental sanitation education;
Inspection and enforcement of sanitary regulations;
Disposal of the dead;
Control of rearing and straying of animals;
Monitoring the observance of environmental standards (MLGRD Citation2010)
For the rest of this paper, the broad definition of sanitation is adopted so as to be in consonance with the ESP, which informs the sanitation service delivery function of the MMDAs.
Pro-poor sanitation surcharge
Sanitation surcharges are an emerging mechanism to bridge the gap in sanitation financing in sub-Saharan Africa, especially in low-income urban communities. It refers to the inclusion of a special charge in an existing user fee or levy to generate additional funds for sanitation. The surcharge, which may or may not be for sanitation services received, is often included in the water bills of water consumers (see WSP Citation2004; Janson Citation2008; EU Water Initiative Finance Working Group Citation2011; WSUP Citation2012). This is because either the amount of sanitation service received (especially in respect of sewerage service) is assumed to be proportional to the amount of water consumed or consumers are likely to resist the surcharge if they are asked to pay for sewerage separately (EU Water Initiative Finance Working Group Citation2011). In sub-Saharan Africa, sanitation surcharges are included in water bills in the urban centres of Burkina Faso (WSP Citation2004) and in cities such as Lusaka (Zambia), Dakar (Senegal), Antananarivo (Madagascar) and Beira (Mozambique) (WSUP Citation2012). This was also the case in Ghana when sewerage and water were managed by Ghana Water and Sewerage Corporation (GWSC) prior to the transfer of responsibility for sanitation to the MMDAs. (Since GWSC was a national-level agency while the MMDAs are decentralised bodies, the expectation is that public trust with respect to the use of the funds for sanitation would be higher in the latter than in the former.)
WSUP (Citation2012) classifies sanitation surcharges into two main categories: sanitation levy and sanitation services charge. Sanitation levy refers to a charge (usually included in water bills) which is not directly related to sanitation services delivered to the payer of the levy, i.e. it is not simply a charge for services received, but a cross-subsidy for wider benefit. Amounts collected may or may not be ring-fenced for spending on sanitation in low-income areas. Sanitation service charge is simply an amount charged to residents for sanitation services they have received (such as connection to a sewerage network or on-site sanitation services). However, a sanitation service charge does not necessarily reflect the actual cost of service received.
Sanitation surcharges may or may not be pro-poor. A pro-poor sanitation surcharge policy is one in which funds from the surcharge are spent in such a manner that low-income communities receive sanitation services that are over and above their contribution to the funds. It includes a situation where all or most of the funds are spent on sanitation improvements in poor communities. For instance, in Lusaka, all funds raised from the sanitation surcharge (sanitation levy) were ring-fenced for sanitation improvement in the city’s low-income communities (see WSUP Citation2012).
Property rate
In both Akuapem North and Ga West Municipalities, the sanitation surcharges are collected via property rate bills instead of water bills. This is because the Municipal Assemblies have no control over water bills, which are collected and controlled by a different entity (Ghana Water Company Ltd). In Akuapem North, the surcharge is an annual flat levy of GHC 5.00 (about USD 1.00) per property while in Ga West it is set at 10% of the property rate. In this paper, the term property rate refers to property tax. Considered efficient and equitable, property tax is a recurrent tax that local governments collect based on immovable property and, in some cases, other forms of wealth of the taxpayer (Norregaard Citation2013; Ali et al. Citation2017). It is a form of ad valorem tax because it is in proportion to the value of the taxpayer’s property, and has been described as the most popular source of local government revenue in many countries (Awunyo-Vitor et al. Citation2015).
In Ghana, property tax is one of the main sources of revenue for local governments (i.e. the MMDAs). According to Section 146(6) of Local Governance Act, 2016, Act 936, the MMDAs are mandated to impose a property rate on the rateable value of immovable property, which ‘shall vary as between specified areas of the district, except that within a mixed development area, the amount per Ghana Cedi on rateable value shall vary in respect of property used for different purposes.’ Property here includes ‘buildings, structures or similar development.’ The amount paid by a property owner is determined based on two main factors: a) rateable value of the property (which is the difference between the cost of constructing the structure anew from scratch and the cost of restoring the existing structure to its original state through rehabilitation or renovation); b) its locational classification (i.e. whether it is located in a high-, medium- or low-class residential or mixed-use development area of the city, municipality or district in question).
Conceptual framework
conceptualises how policymakers’ and taxpayers’ attitudes may influence the success of sanitation surcharge policies i.e. that adequate revenue is collected and managed by MMDAs, and disbursed in a pro-poor manner. For the purpose of this paper, policymakers’ attitudes include their acceptance of the sanitation surcharge policy and pro-poor spending of proceeds from the surcharge, as well as their commitment to the implementation of the policy. On the other hand, taxpayers’ attitudes include their willingness to pay the sanitation surcharge and support for pro-poor spending of proceeds from the surcharge, both of which may be influenced by their socio-economic characteristics (such as gender, age, education and income).
Figure 1. A framework for analysing policymakers’ and taxpayers’ attitudes towards sanitation surcharge (Source: Authors’ construct)
Favourable attitudes of both policymakers and taxpayers combine to enhance the collection of sanitation surcharge through property rate bills. Funds from the sanitation surcharge, together with funds from the traditional sources of the municipal assemblies, are used to finance sanitation improvement in a pro-poor manner.
Materials and methods
Description of study areas
Akuapem North Municipality, created in 1988 as part of Government of Ghana’s decentralisation policy, is in the south-eastern corner of the Eastern Region of Ghana (see ). Akropong, the capital of the municipality, is located approximately 23.7 kilometres south-east of the Eastern Regional capital, Koforidua, and 48.3 kilometres north-north-east of the national capital, Accra. The population of Akuapem North Municipality as of 2018 is estimated at 168,658.
Figure 2. Map of Ghana showing location of Akuapem North and Ga West municipalities (Source: Authors’ construct)
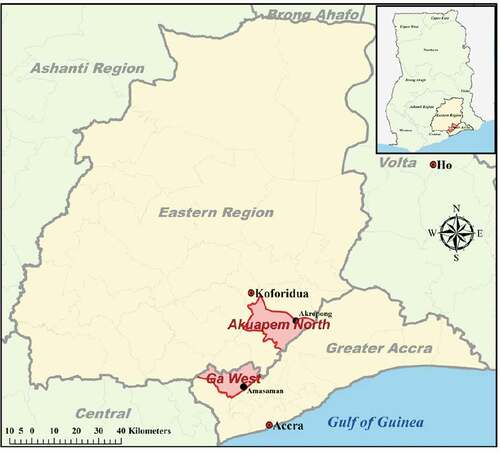
Ga West Municipality, which was created in 1988 as Ga District, is one of the 26 administrative districts in Greater Accra Region (see ). The municipal capital, Amasaman, is located approximately 20.8 kilometres north-north-west of Accra. The municipality forms part of an extensive peri-urban zone that serves as a transitional belt between the city of Accra and the countryside. According to census data, the population of the municipality (including the recently created Ga North Municipality) increased from 28,185 in 1984 to 143,489 in 2000 and 219,788 in 2010 (with an annual growth rate of 4.3% between 2000 and 2010).
Data collection methods
The study, conducted between June 2018 and January 2019, adopted the mixed-methods approach, combining quantitative and qualitative data collection and analysis. The main strength of this approach is that it produces a better understanding of the phenomenon under investigation than either a quantitative or qualitative approach would produce alone (Creswell Citation2014). Qualitative data on policymakers’ and taxpayers’ attitudes towards sanitation surcharge were collected through key informant interviews (KIIs) and focus group discussions (FGDs) while quantitative data were collected through a survey.
The KIIs involved the Coordinating Directors, Budget Officers, Development Planning Officers, Finance Officers, Environmental Health Officers and selected Assembly Members of the two municipal assemblies. These were individuals who, by virtue of their positions, were involved in either the formulation or implementation of the sanitation surcharge policy. Customised interview guides were developed to guide the interviews. The FGDs involved selected property owners and a checklist of topics were used to stimulate discussions on participants’ general perspectives on the sanitation surcharge and sanitation service delivery in the municipality in which they lived. The survey, which involved the use of a standardised questionnaire, covered the owners of 832 randomly selected properties (buildings) across the two municipalities.
Sampling
Purposive sampling was used to select officials (policymakers) of the municipal assemblies for participation in the key informant interviews. These were individuals who, by virtue of their positions and roles, were involved in the formulation or implementation of the sanitation surcharge policy, and sanitation service delivery activities in general. The survey involved a random sample of 409 properties in Akuapem North and another 423 properties in Ga West, which were calculated separately from the estimated number of buildings using data from the 2010 Population and Housing Census using Slovin’s formula and an error tolerance of 5%.
A multi-stage stratified sampling procedure was used to select the properties, focusing on communities where the Assemblies collected property rates. In Ga West Municipality, the research team identified seven (7) communities where the Assembly collected property rates and all of them were included in the study. In Akuapem North Municipality, all communities where the Assembly collects property rate were grouped under its six (6) revenue zones and these zones served as strata for sampling purposes. At least one community was randomly selected from each stratum, depending on the number of communities in that stratum. The respective sample sizes (number of properties) were then distributed proportionally among the selected communities based on their sizes (see ). Within the communities, buildings were randomly selected with the help of satellite images and ground-truthing. The survey instruments were then administered to the owners of those properties.
Table 1. Distribution of sample size
Results and discussion
Results and findings from analysis of the field data are presented and discussed in this section. Although an attempt is made to compare results from the two study municipalities, the fact that there is considerable difference between them regarding the duration of implementation of the policy (i.e. four years apart) should be noted.
Policymakers’ attitudes towards the sanitation surcharge
The success of any public policy depends largely on the acceptance and commitment of public officials (including both political leaders and technocrats) to that policy. The political leaders (i.e. the Assembly Members) demonstrated their acceptance of the sanitation surcharge policy by approving it at their General Assembly meetings. Once legislative (political) approval had been given, it was the responsibility of the technocrats to implement it.
All the key technocrats (i.e. Municipal Coordinating Directors, Finance Officers, Planning Officers, Budget Officers and Environmental Health Officers) interviewed in both municipalities indicated that, in terms of its intent and design, the sanitation surcharge was a good policy that had the potential to improve sanitation service delivery. They also indicated their agreement to the idea of spending proceeds from the sanitation surcharge in a pro-poor manner, though also arguing that the Assemblies’ expenditure on sanitation had always been pro-poor by default. This was because, although the rich pay more taxes, most of the sanitation services delivered by the Assemblies benefit poor households, especially in the provision of solid waste containers and public toilets. That was to say, priority was given to communities and neighbourhoods with pressing sanitation needs.
Although, rhetorically, the technocrats accepted the sanitation surcharge policy, this had not translated into commitment to its implementation. For instance, the study revealed that the policy had not been effectively communicated to taxpayers. Although officials in both municipalities indicated that taxpayers had duly been informed about the policy, an overwhelming majority (98–99%) of property owners surveyed said they were not aware of it. In the Ga West Municipality, revenue from sanitation surcharge was only GHS 15,096.87 (USD 3,774.22) in 2016 and GHS 15,268.20 (USD 3,392.93) in 2017.
The low level of commitment to implementation of the policy was also evident in the failure of the officials to put in measures to track the collection, disbursement and utilisation of proceeds from the surcharge. For instance, in Ga West Municipality, the original intention behind the policy was to ring-fence sanitation surcharge proceeds and restrict their utilisation to sanitation service delivery by releasing the funds to the Environmental Health/Sanitation Unit based on annual action plans and budgets for sanitation. However, this has not occurred since the policy was introduced by the Assembly. Consequently, the Assemblies were not in a position to measure their performance in respect of the sanitation surcharge policy in terms of how much was generated, how the funds had been used and whether it was making any impact on sanitation. The study also revealed that, in both municipalities, no official had been mandated to champion and coordinate the implementation of the policy.
The lack of commitment of policymakers (i.e. technocrats) in the two study municipalities to the effective implementation of the sanitation surcharge re-echoes the age-old gap between rhetoric and reality in various spheres of public policy (see Mawdsley Citation2002; Conole Citation2010; Hammad Citation2012; Larsson Citation2013; ACTION Citation2014). In the two municipalities studied, interviews with the officials mentioned earlier suggest that the lack of commitment could be attributed to the fact that environmental sanitation issues are not of top priority to the Assemblies. This implies that, in order for a sanitation surcharge to work in Ghana, a lot more needs to be done beyond merely formulating and approving the surcharge as policy.
Taxpayers’ attitudes towards the sanitation surcharge
Socio-economic characteristics of property owners
As indicated in , the survey shows that property owners in Akuapem North are much older than those in Ga West but, in both municipalities, most of them are male. The results also show that, in both municipalities, the majority of property owners either have no formal education or are educated below the secondary level and that trading and services (including tailoring, hairdressing/barbering, driving, etc.) are the dominant sources of employment. In Akuapem North, about 30% of property owners do not work due to factors such as unemployment, retirement, sickness and disability while household incomes are higher in Ga West.
Table 2. Socio-economic characteristics of property owners
Compliance with property rate payment
Since the sanitation surcharge in the two study municipalities is tied to the property rate, it is important to understand taxpayers’ compliance with this tax instrument. The survey data show that property owners’ awareness about property rate was high in both municipalities, especially in Akuapem North where almost 96% of respondents said they knew about the tax (see ). However, about 6% and 9% of respondents in Akuapem North and Ga West, respectively, were aware of their obligation to pay property rate but were unwilling to pay. The data further shows that only a little over half of the property owners surveyed in Ga West said they paid their property rate, compared to 92% in Akuapem North. It is significant to note that the self-reported compliance rate of 54% in Ga West was slightly higher than the 50% estimate given by officials of the municipality. However, this is much lower than a self-reported compliance rate of 72% found in the neighbouring Ga East Municipality in 2017 by Gordor (Citation2017).
Table 3. Awareness, willingness and compliance with property rate payment
Among property owners who said they were aware of the property rate but failed to pay it, the most commonly cited reason for non-compliance was the failure of Assembly’s revenue collectors to actually collect or demand it and the uncompleted state of the property itself (see ). In Ga West, close to a quarter of the respondents said they refused to pay the property rate because they did not trust the Assembly to put the proceeds to good use or that they would benefit, indicating that the Ga West Municipality will have to address this lack of trust in order to increase property rate compliance.
Table 4. Reasons for non-compliance with property rate payment
Awareness and support for sanitation surcharge
Only nine (or 2.2%) out of the 409 property owners surveyed in Akuapem North said they were aware of the sanitation surcharge policy in the municipality. Out of these nine respondents, seven (7) said they either ‘strongly support’ or ‘somehow support’ the policy. Similarly, only five (1.2%) out of the 423 respondents surveyed in Ga West were aware of the policy, out of whom four (4) either ‘strongly support’ or ‘somehow support’ it. (The fact that awareness rate is slightly higher in Akuapem North could be attributed to the fact that the policy was introduced in that municipality four years earlier than Ga West).Thus, support for the policy was very high among the few taxpayers who knew about it. This finding is consistent with a widely-held view that people’s awareness or knowledge of the purpose of a public policy positively impacts their acceptance and other behaviour towards that policy (see Iizuka Citation2000; Aslam et al. Citation2015; Karaoğlan and Durukan Citation2016). For instance, Karaoğlan and Durukan (Citation2016) found that environmental awareness among energy consumers in Turkey had an effect on their willingness to pay more for electricity generated from renewable resources. This implies that stepping up awareness creation and sensitisation among property owners in Akuapem North and Ga West could increase their support for the sanitation surcharge policy.
Willingness to pay the sanitation surcharge
When asked whether they were willing to pay something extra (i.e. in addition to whatever taxes or sanitation expenses they were already paying) on a monthly basis to improve upon environmental sanitation in their communities, about 62% of property owners in Akuapem North and 60% in Ga West said they were willing to do so. In a similar study in Kenya, Kisiangani et al. (Citation2018) found a higher proportion (75%) of water customers who were willing to pay a pro-poor sanitation surcharge. The data also revealed that willingness to pay (WTP) had no statistically significant association with the socio-economic characteristics of respondents in Ga West. However, in Akuapem North, WTP was found to be associated with respondents’ gender, education and household income level. In that municipality, WTP was much higher among male property owners than their female counterparts (see ). In terms of education, the majority of property owners who had had at least primary education (especially those with secondary education, 77%) were willing to pay, while the majority (59%) of those with no formal education were unwilling (see ). There was also a positive association between income class and willingness to pay. For instance in Akuapem North, while 76% of property owners whose household income belonged to the top (fifth) quintile were willing to pay, only 37% of those in the lowest (first) quintile were unwilling (see ). In Cape Town, the willingness of ‘non-poor’ residents to pay for improvements in services in informal settlements is found to be influenced by their proximity to the settlement and the mode of payment (Kobel and Mistro Citation2015).
Table 5. Willing to pay something extra to improve sanitation by gender
Table 6. Willing to pay something extra to improve sanitation by level of education
Table 7. Willingness to pay something extra to improve sanitation by income class
Support for pro-poor spending of sanitation surcharge
Respondents were also asked whether they would support the idea of the Municipal Assembly using part or all of the sanitation surcharge funds to improve sanitation in poor neighbourhoods within their community, even if residents in those neighbourhoods contributed less. Support for this suggestion was very high in the two municipalities. As shows, about 64% and 57% of respondents in Akuapem North and Ga West, respectively, said they either ‘strongly support’ or ‘somehow support’ the idea. Those who said they either ‘strongly oppose’ or ‘somehow oppose’ it was about 20% in both municipalities.
Figure 3. Respondents’ support for pro-poor spending on sanitation (Source: Authors’ construct based on field survey)
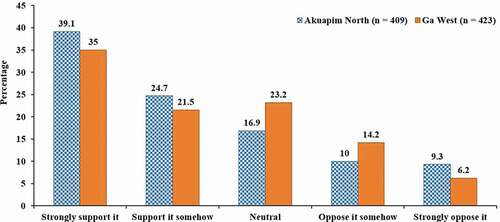
Reasons given by respondents for supporting such pro-poor spending can be categorised into two – altruistic reasons and self-interest reasons. Those with altruistic reasons are those who cited humanitarian reasons. Those with self-interest reasons thought they stood to benefit directly from such an initiative, either because they lived in poor neighbourhoods themselves or because they believed the initiative would protect them against sanitation-related diseases and other environmental hazards in the community. Among the respondents who opposed pro-poor spending on sanitation, 34% in Akuapem North and 35% in Ga West indicated they did not trust the Assemblies to use the funds for the intended purpose, or even account for them. In Kenya, support for a hypothetical pro-poor sanitation surcharge was influenced by similar factors, including solidarity with people without sanitation, trust in the water service provider to properly manage the funds and satisfaction with current water services (Kisiangani et al. Citation2018). Other reasons given by property owners in Akuapem North and Ga West who opposed pro-poor spending on sanitation are summarised in .
Box 1. Reasons why some respondents oppose pro-poor spending on sanitation
Conclusion
Using Akuapem North and Ga West Municipalities as case studies, the study sought to shed light on how the attitudes of policymakers (technocrats) and taxpayers (property owners) might affect the policy of imposing sanitation surcharges on property owners using the property rate as a channel for collection. The study has shown that, as far as the sanitation surcharge is concerned, rhetoric does not reflect reality in both municipalities. Policymakers’ acceptance and approval of the pro-poor sanitation surcharge failed to translate into effective implementation of the policy.
Property rate payment is low in Ga West Municipality, where only about half of property owners pay the rate, mainly as a result of the failure of the Assembly to demand payment, as well as mistrust in the Assembly. Since the sanitation surcharge is collected through the property rate in both municipalities, expanding the coverage and collection of property rate will have the two-pronged effect of increasing the Assembly’s IGF and proceeds from sanitation surcharge for pro-poor sanitation improvement.
Property owners’ support for the pro-poor sanitation policy was found to be generally high in the two municipalities, in terms of both their willingness to pay the sanitation surcharge and their support for pro-poor spending of funds generated by the surcharge. However, in both municipalities, about two-fifths of the property owners did not support the policy because of mistrust and negative perceptions about the Assemblies. Assemblies will therefore need to address these issues of public mistrust and negative perceptions if the sanitation surcharge is to be supported by taxpayers.
The study also reveals that effective communication and engagement with taxpayers could increase their support for sanitation surcharge and for similar local government policies. An overwhelming majority (98–99%) of property owners were unaware of the sanitation surcharge policy while a significant minority of them showed resistance to property rate payment and the pro-poor sanitation policy because they did not trust the Municipal Assemblies. However, support for the policy was very high among the few property owners who knew about it. This reinforces the popular view that citizens’ awareness and knowledge about (local) government business positively impacts the public’s acceptance and attitude towards public policy. Therefore, to increase support for sanitation surcharge and minimise taxpayers’ mistrust for the Assemblies, we suggest that there is a need to intensify public engagement through effective communication, transparency and accountability.
For the sanitation surcharge policy to achieve its purpose of generating extra funds to improve sanitation in a pro-poor manner, the Municipal Assemblies should take measures to address the issues that emerged from this study. It is recommended that, in each of the municipalities, an implementation strategy with clearly defined targets should be prepared, including measures to ring-fence the surcharge and the appointment of a senior official of the Assembly to champion and coordinate the implementation process. The Assemblies should also take measures to improve upon their performance in property rate collection by expanding coverage and devising effective and efficient payment methods. To gain public trust and cooperation, the Assemblies must devise strategies to effectively communicate and engage with taxpayers and the public at large. This should include making their annual revenue and expenditure statements available to the public, publicising development projects and other activities they undertake, and creating a system for eliciting and receiving feedback from citizens. A mix of communication methods like town hall meetings at the community level, radio announcements and discussions and social media should be explored for this purpose.
Acknowledgements
We are grateful to Department for International Development (DFID) for funding the main research project, Research around Sanitation Surcharges Included in Property Rates in Ghana, of which this paper is an output. We also appreciate the officials of Akuapem North and Ga West Municipal Assemblies and property owners in the two municipalities who participated in the research for providing data for the research. Finally, we thank our enumerators for the data collection.
Disclosure statement
There is no conflict of interest.
Additional information
Funding
References
- ACTION . 2014. From rhetoric to reality: an analysis of donor and implementing country efforts to scale up the TB-HIV response. Washington (DC): RESULTS Educational Fund.
- Ahmed IK , Dantata BS. 2016. Problems and challenges of policy implementation for national development. Res Humanit Soc Sci. 6(15):60–65. doi:https://doi.org/10.7176/RHSS.
- Ali M , Fjeldstad O-H , Katera L . 2017. Property taxation in developing countries. Christian Michelsen Inst (CMI) Brief. 16(1). March. [accessed 2019 May 6 ]. https://www.cmi.no/publications/file/6167-property-taxationin-developing-countries.pdf.
- Aslam SK , Mehboob B , Zaheer S , Shafique K . 2015. Awareness and support for anti-tobacco policies among health professional students in Pakistan: findings from the global health professional students survey, 2011. Subst Abuse Treat Prev Policy. 10(7):2–7. doi:https://doi.org/10.1186/s13011-015-0001-x.
- Awunyo-Vitor D , Osae EO , Donani S . 2015. Determinants of property rate default: evidence from the Ashanti region, Ghana. Commonwealth J Local Governance. (16/17):190–203. doi:https://doi.org/10.5130/cjlg.v0i0.4494.
- Boadi K , Kuitunen M , Raheem K , Hanninen K . 2005. Urbanisation without development: environmental and health implications in African cities. Environ Dev Sustainability. 7(4):465–500. doi:https://doi.org/10.1007/s10668-004-5410-3.
- Brynard PA . 2009. Mapping the factors that influence policy implementation. J Public Adm. 44(3.1):557–577.
- Cobbinah PB , Erdiaw-Kwasie MO , Amoateng P . 2015. Africa’s urbanisation: implications for sustainable development. Cities. 47:62–72. doi:https://doi.org/10.1016/j.cities.2015.03.013.
- Conole G . 2010. Bridging the gap between policy and practice: a reflective review and looking forward to the future. J e-Learning Knowl Soc. 6(1):13–27. [accessed 2019 May 6 ]. http://oro.open.ac.uk/21618/11/384-964-1-PB.pdf.
- Creswell JW . 2014. Research design: qualitative, quantitative and mixed methods approaches. 4th ed. Thousand Oaks (CA): Sage Publications, Inc.
- Eawag/Sandec, Department of Water and Sanitation in Developing Countries . 2008. Sanitation systems & technologies: sandec training tool 1.0 – module 4. Dübendorf: Eawag/Sandec.
- EU Water Initiative Finance Working Group . 2011. Financing for water and sanitation: a primer for practitioners and students in developing countries. Stockholm: EU Water Initiative Finance Working Group. [accessed 2019 Apr 28 ]. http://sanitationandwaterforall.org/wp-content/uploads/2018/08/euwi-fwg-primer-on-financing-final.pdf.
- Ferriman A. 2007. BMJ readers choose the ‘sanitary revolution’ as greatest medical advance since 1840. BMJ. 334:111.
- Gordor S. 2017. Assessing factors affecting property rate compliance behaviour in Ghana: the case of Ga East municipality [master’s thesis]. Accra: University of Ghana.
- [GSS] Ghana Statistical Service . 2013. 2010 population & housing census: national analytical report. Accra: Ghana Statistical Service.
- [GSS] Ghana Statistical Service . 2014. 2010 population and housing census: district analytical report (Awutu Senya East Municipality). Accra: Ghana Statistical Service.
- [GSS] Ghana Statistical Service . 2018. Multiple-indicator cluster survey 2017/18 (MICS 2017/18): survey findings report. Accra: Ghana Statistical Service.
- Gulyani S , Talukdar D , Kariuki RM . 2005. Universal (non)service? Water markets, household demand and the poor in urban Kenya. Urban Stud. 42(8):1247–1274. doi:https://doi.org/10.1080/00420980500150557.
- Hammad W . 2012. Exploring the gap between rhetoric and reality in school-based management in Egyptian schools. J Educ Inst Stud World. 2(3):45–55. [accessed 2019 Aug 12 ]. http://wjeis.org/FileUpload/ds217232/File/05b.hammad.pdf.
- Huuhtanen S , Laukkanen A . 2009. A guide to sanitation and hygiene in developing countries. Tampere: Global Dry Toilet Association of Finland, Tampere University of Applied Sciences. www.huussi.net. www.drytoilet.org.
- Iizuka M. 2000. Role of environmental awareness in achieving sustainable development. A Paper Prepared for Economic Commission for Latin America and the Caribbean (ECLAC).
- Janson N. 2008. Governance in urban sanitation sector: module 2: economics, pricing and financing of the sanitation sector. A training module for department of water supply and sanitation in developing countries (Sandec)/United Nations Institute for Training and Research (UNITAR)/World Bank Institute (WBI).
- Karaoğlan S , Durukan T . 2016. Effect of environmental awareness on willingness to pay for renewable energy. Int J Bus Manage Invent. 5(12):42–48.
- Kisiangani J , MacLeod C , Acey C , Levine D , Ronoh P , Makena E , Norman G , Khush R , Delaire C , Peletz R . 2018. Are Kenyan water customers willing to pay a pro--poor sanitation surcharge? A paper presented at: 41st WEDC International Conference (Paper 2905); Nakuru (Kenya).
- Kobel D , Mistro RD . 2015. Valuing the non-user benefits of improving water and sanitation in informal settlements: a study of Cape Town. Urban Water J. 12(3):248–261. doi:https://doi.org/10.1080/1573062X.2013.847463.
- Komives K , Foster V , Halpern J , Wodon Q , Abdullah R . 2005. Water, electricity, and the poor: who benefits from utility subsidies? Washington (DC): World Bank. [accessed 2019 Apr 28 ]. http://documents.worldbank.org/curated/en/606521468136796984/Water-electricity-and-the-poor-who-benefits-from-utility-subsidies.
- Larsson P . 2013. The rhetoric/reality gap in social determinants of mental health. Ment Health Rev J. 18(4):182–193. doi:https://doi.org/10.1108/MHRJ-04-2013-0013.
- Lipson J , Anderson L , Bolton S 2010. The public health benefits of sanitation interventions. Evans School Policy Analysis and Research (EPAR) brief no. 104. A Paper Prepared for the Water & Sanitation Team of Bill & Melinda Gates Foundation.
- Mara D , Lane J , Scott B , Trouba D . 2010. Sanitation and health. PLoS Med. 7(11):1–7. doi:https://doi.org/10.1371/journal.pmed.1000363.
- Mawdsley J . 2002. The gap between rhetoric and reality: weapons acquisition and ESDP. Bonn: Bonn International Center for Conversion.
- [MLGRD] Ministry of Local Government and Rural Development . 2010. National environmental sanitation strategy and action plan (NESSAP) 2010–2015. Accra: MLGRD.
- Mills JE , Cumming O 2016. The impact of water, sanitation and hygiene on key health and social outcomes: review of evidence. A Paper Prepared for UNICEF by Sanitation and Hygiene Applied Research for Equity (SHARE). London School of Hygiene & Tropical Medicine.
- Norregaard MJ . 2013. Taxing immovable property: revenue potential and implementation challenges. IMF Working Paper WP/13/129. [accessed 2019 May 6 ]. https://www.imf.org/external/pubs/ft/wp/2013/wp13129.pdf.
- Oduro CY , Afrane SK , Braimah I . 2014. The future of human settlements in Ghana. In: Adarkwa KK , editor. Human settlements and service delivery in Ghana. Kumasi: University Press; p. 362–379.
- Owusu G . 2010. Social effects of poor sanitation and waste management on poor urban communities: a neighbourhood-specific study of Sabon Zongo, Accra. J Urbanism. 3(2):145–160. doi:https://doi.org/10.1080/17549175.2010.502001.
- Park JW . 2005. Surimi and surimi seafood. Boca Raton (FL): Taylor & Francis Group, LLC.
- Peprah C , Oduro-Ofori E , Asante-Wusu I . 2015. Analysis of accessibility to water supply and sanitation services in the Awutu-Senya East municipality, Ghana. J Sustainable Dev. 8(8):310–325. doi:https://doi.org/10.5539/jsd.v8n8p310.
- Schertenleib R . 2005. From conventional to advanced environmental sanitation. Water Sci Technol. 51(10):7–14. doi:https://doi.org/10.2166/wst.2005.0345.
- Taweekaew K . 2014. An analysis of the factors affecting the success of environmental policy implementation: A study of the Tambon Administration Organization (TAO). Sci Res J. II(X):20–25.
- Ugwuanyi BI , Chukwuemeka EEO . 2013. The obstacles to effective policy implementation by the public bureaucracy in developing nations: the case of Nigeria. Arab J Bus Manag Rev [ Kuwait Chapter]. 2(7):59–68. [accessed 2019 Aug 12 ]. https://www.arabianjbmr.com/pdfs/KD_VOL_2_7/6.pdf.
- UNICEF . 1997. A sanitation handbook. New York (NY): UNICEF.
- [UN] United Nations . 2017. Sustainable development goals report 2017. New York (NY): United Nations.
- [WSP] Water and Sanitation Program . 2004. Mobilizing resources for sanitation: a field note. Nairobi: Water and Sanitation Program--Africa. [accessed 2019 Aug 12]. https://www.ircwash.org/sites/default/files/WSP-2004-Mobilizing.pdf
- [WSUP] Water & Sanitation for the Urban Poor . 2012. Sanitation surcharges collected through water bills: a way forward for financing pro-poor sanitation? Discussion Paper DP#004.
- WHO/UNICEF . 2013. Progress on sanitation and drinking water: 2013 update. Geneva: World Health Organization.
- WHO/UNICEF . 2015. Progress on sanitation and drinking water: 2015 update and MDG assessment. Geneva: World Health Organization.